. 2025 Jan 23;9(1):vlae004.
doi: 10.1093/immhor/vlae004.

Reduced autoimmunity associated with deletion of host CD73

Affiliations

Reduced autoimmunity associated with deletion of host CD73

Beanna Okeugo et al. Immunohorizons. .

Abstract

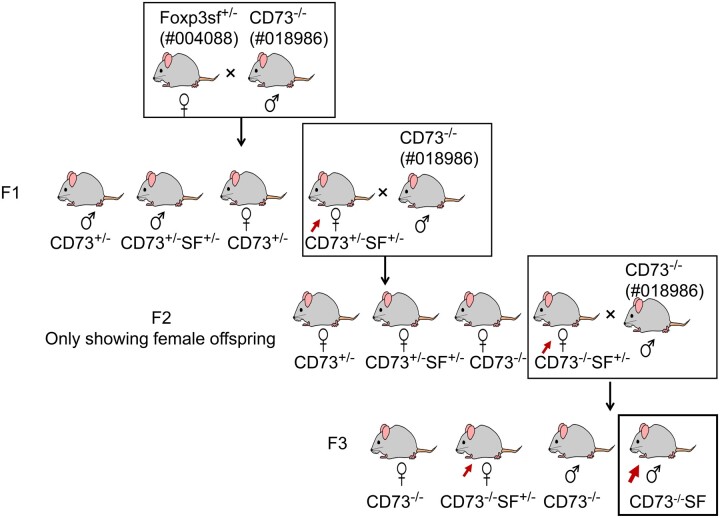
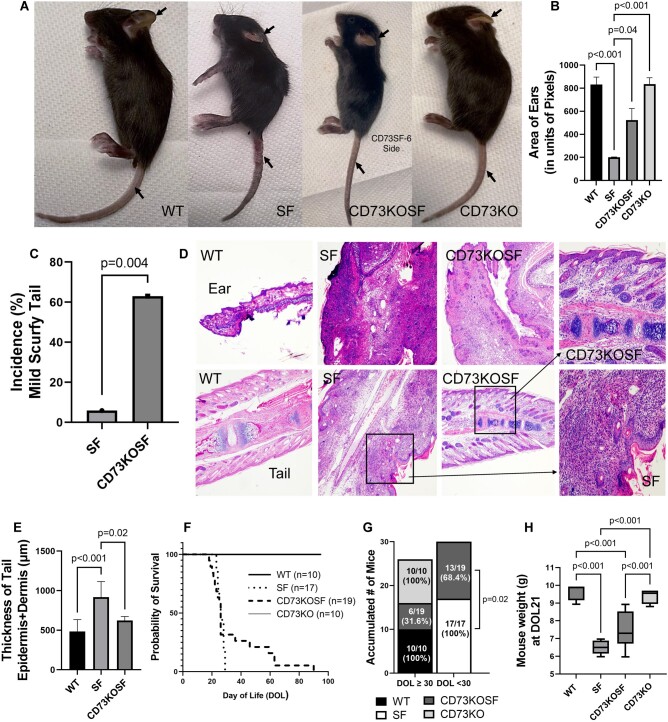
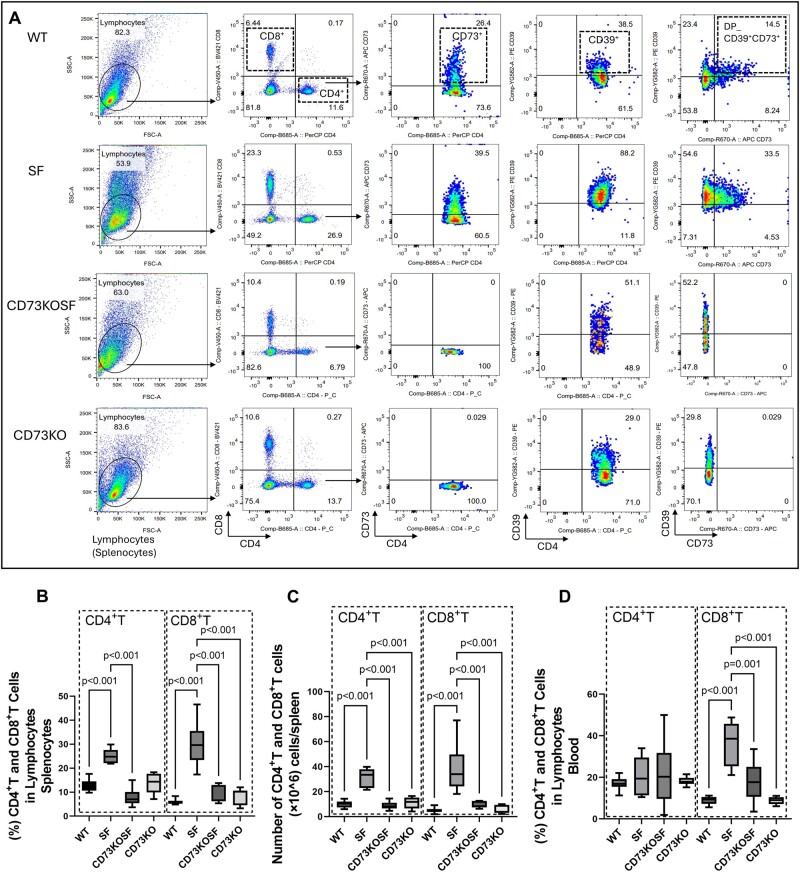
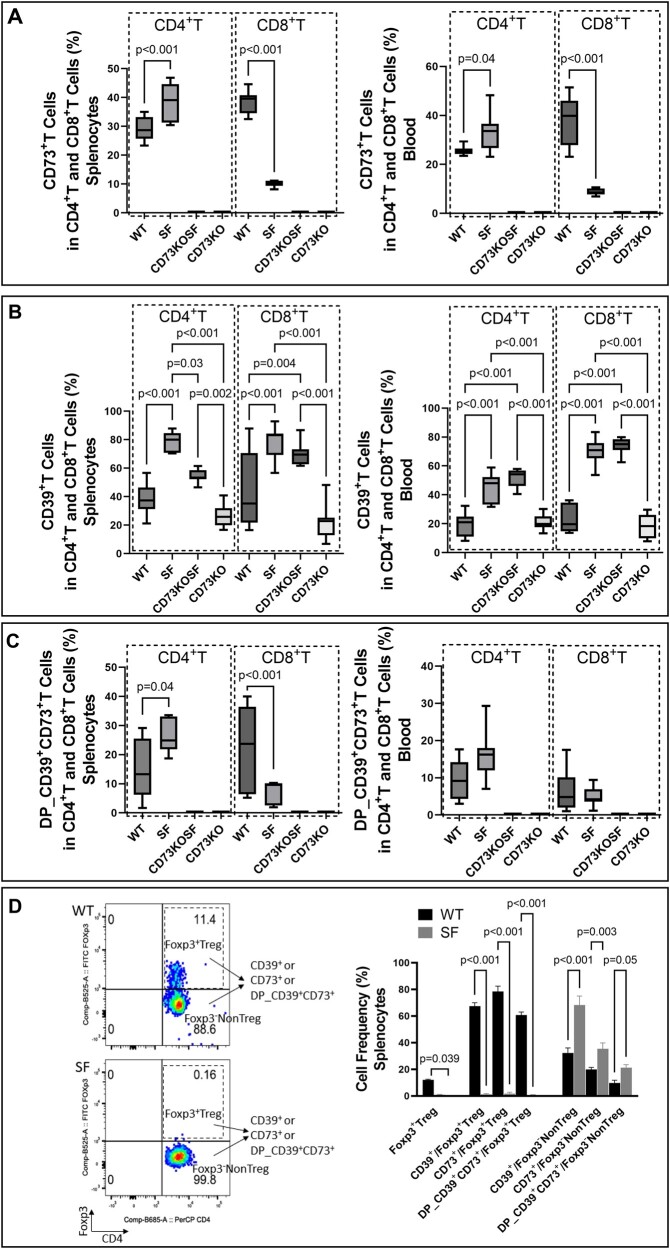
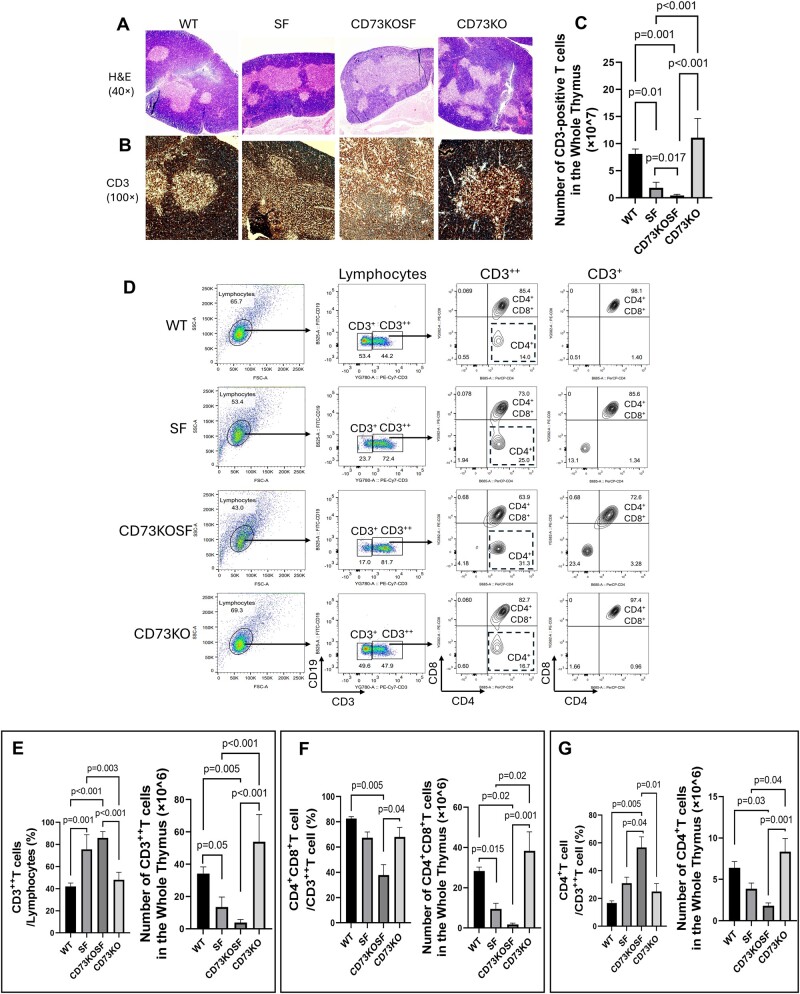
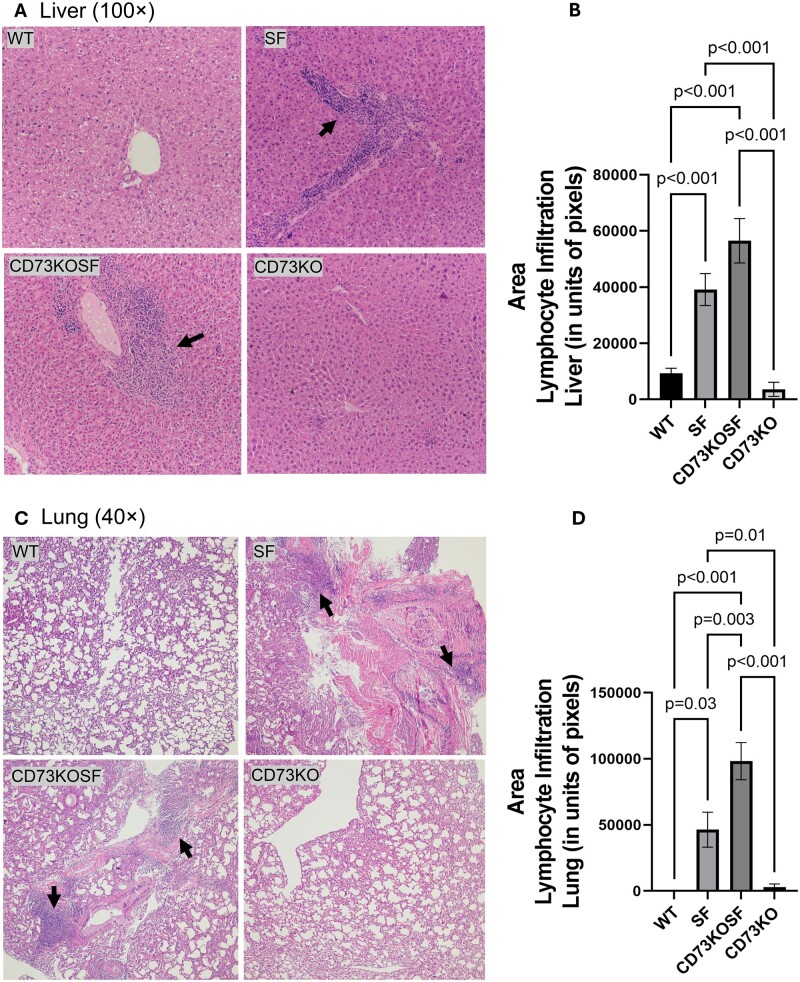
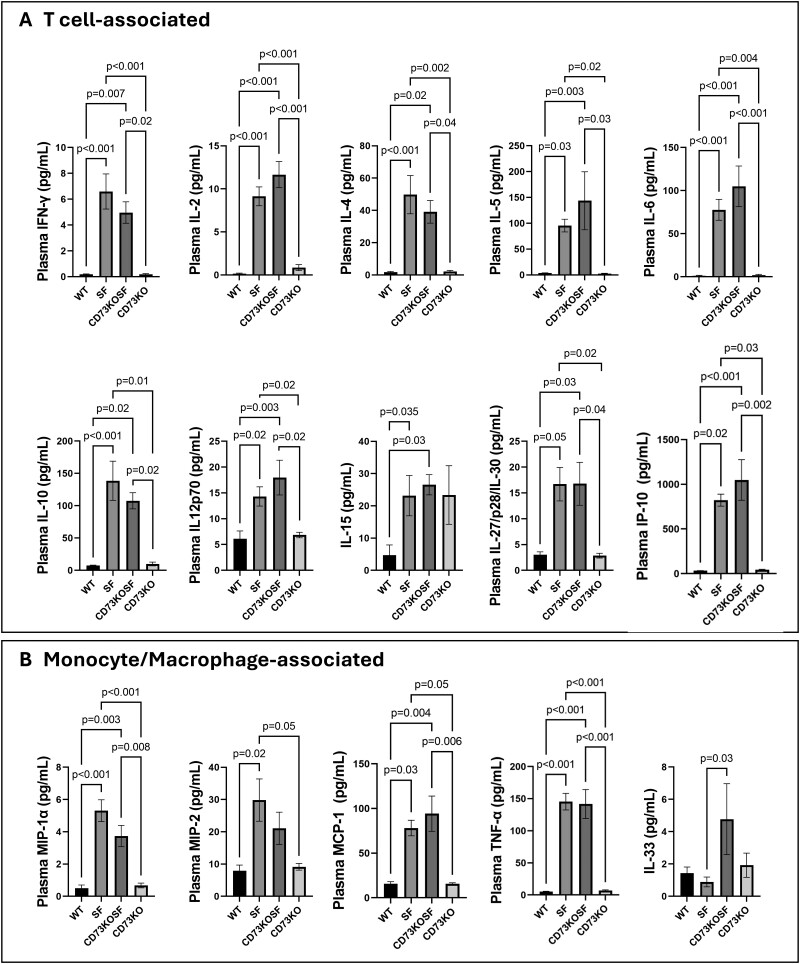
CD73 is ubiquitously expressed and regulates critical functions across multiple organ systems. The sequential actions of CD39 and CD73 accomplish the conversion of adenosine triphosphate to adenosine and shift the adenosine triphosphate-driven proinflammatory immune cell milieu toward an anti-inflammatory state. This immunological switch is a major mechanism by which regulatory T (Treg) cells control inflammation. Foxp3 engages in Treg development and function. Foxp3 mutations result in the scurfy (SF) mouse phenotype and a rapidly lethal lymphoproliferative syndrome. We generated double knockout (KO) mouse (CD73KOSF) by breeding heterozygous Foxp3sf/J females to CD73KO male mice to remove host CD73. We initially aimed to use these mice to identify a specific probiotic-CD73 effect, previously shown for Limosilactobacillus reuteri DSM 17938. We expected CD73 deletion to enhance the severity of autoimmunity in SF mice. However, we unexpectedly observed that KO of host CD73 in SF mice clinically reduced the severity of autoimmunity including reduced ear thickness, increased ear size, and less deformed ears, along with less dry and brittle skin. KO of CD73 in SF mice significantly reduced the numbers of CD4+ and CD8+T cells in spleen and blood. We identified that KO of CD73 in SF mice reduced the numbers of T cells in the thymus compared with those in SF mice, indicating that the milder clinical phenotype may be due to reduced central and peripheral lymphoproliferation. These new findings suggest targeting CD73 could improve T cell-mediated dermatitis, one of the most common symptoms in Treg deficiency-associated primary immune deficiencies.

Keywords: IPEX syndrome; dermatitis; primary immune deficiency; regulatory T cell; scurfy; thymocytes.


Conflict of interest statement

All authors have no financial conflict of interest to disclose.

Figures

Figure 1.
Figure 1.
Generation of CD73KOSF mice: core genotype and breeding scheme. Red arrows indicate the confirmed mouse genotype used for setting up breeding pairs and CD73KOSF mice for the experiments.
Figure 2.
Figure 2.
Evaluation of mouse clinical phenotype. (A) phenotypic observations of ears and tails of mice compared among the different genotype mouse groups including WT, SF, CD73KOSF, and CD73KO. (B) Area of ears measured by using ImageJ software based on each mouse photograph. Values represent mean ± SD, and 1-way analysis of variance multiple comparisons with Tukey’s post-test. (C) Incidence of mild SF tail, comparing CD73KOSF vs. SF; note that the definition of normal, mild, and severe has been described in the Materials and Methods. Fisher’s exact test was used to test the differences. (D) H&E staining histological observations of ears and tails of mice, 40×magnification; square areas show 200× magnification for CD73KOSF and SF, as indicated by arrows. (E) Tail epidermis + dermis thickness was measured by using ImageJ software based on H&E staining histology at 40× magnification. (F) Kaplan-Meier survival curves for each group of mice. (G) Accumulated number of mice divided by DOL ≥30 and DOL < 30; Fisher’s exact test was used. (H) Mouse weight (g) at d21 of age. Values represent mean ± SD, 1-way analysis of variance multiple comparisons with Tukey’s post-test. For d21 analysis, WT n = 8, SF n = 7, CD73KOSF n = 7, and CD73KO n = 9. For survival analysis, WT n = 10, SF n = 17, CD73KOSF n = 19, CD73KO n = 10. Significant P values (P < 0.05) are indicated in the graphs.
Figure 3.
Figure 3.
Flow cytometry analysis of CD4+T and CD8+T cells in the spleen and blood of mice. (A) Flow cytometry images showed the definition of CD4+ and CD8+T cells among lymphocytes, and CD73+, CD39+, and DP_CD39+CD73+ among CD4+T cells; the same analysis among CD8+T cells was performed (not shown). (B) % of CD4+ and CD8+T cells among lymphocytes in the splenocytes isolated from the mice. (C) the number of CD4+ and CD8+T cells (×106) per spleen. (D) % of CD4+ and CD8+T cells in the blood of mice. Values represent mean ± SD, 2-way analysis of variance for multiple comparisons with a Bonferroni test. Significant P values (P < 0.05) are indicated in the figures. FSC-A = forward scatter area; SSC-A = side scatter area.
Figure 4.
Figure 4.
The percentage of CD39+ and CD73+T cells in the spleen and blood analyzed by flow cytometry compared with the groups of mice. (A) % of CD73+in CD4+T cells and % of CD73+in CD8+T cells in the spleen (left) and in the blood (right). (B) % of CD39+in CD4+T cells and % of CD39+in CD8+T cells in the spleen (left) and in the blood (right). (C) % of DP_CD39+CD73+in CD4+T cells and % of DP_CD39+CD73+in CD8+T cells in the spleen (left) and in the blood (right). (D) Flow cytometry images showed the definition of Foxp3+Treg and Foxp3NonTreg among CD4+T cells of the splenocytes from WT (top) and SF (bottom) mice, and further identified the CD39+, CD73+, and DP_CD39+CD73+populations in Foxp3+Treg and Foxp3NonTreg, respectively (left), and bar graphs showed % of CD39+, CD73+ and DP_CD39+CD73+ among Foxp3+Treg and Foxp3NonTreg comparing between WT and SF mice (right). Values represent mean ± SD, and we used 2-way analysis of variance for multiple comparisons with a Bonferroni test. Significant P values (P < 0.05) are indicated in the figures.
Figure 5.
Figure 5.
T cells in the thymus. (A, B) Thymus histology images with H&E staining (40×magnification) (A) and anti-CD3 staining (100×magnification) (B) showing T cells in the outer cortex area and inner medulla area of the thymus of each mouse in different groups. (C) The number of CD3-positive T cells in the whole thymus in each group by flow cytometry analysis. (D) Flow cytometry images on defining CD3+ and CD3++T cells among lymphocytes in the thymus; we further defined DP CD4+CD8+T cells and single CD4+T cells among the CD3++T and CD3+T populations, respectively. (E) % of CD3++T cells among lymphocytes (left) and the number of CD3++T cells in the whole thymus (×106) (right) compared with the groups. (F) % of DP_CD4+CD8+T cells among the CD3++T cell population (left) and the number of DP_CD4+CD8+T cells in the whole thymus (×106) (right) in the groups; and G. % of single CD4+T cells among CD3++T cell population (left) and the number of CD4+T cells in the whole thymus (×106) (right) in the groups. Values represent mean ± SD. One-way analysis of variance multiple comparisons with Tukey’s post-test. Significant P values (P < 0.05) are indicated in the figures. FSC-A = forward scatter area; SSC-A = side scatter area.
Figure 6.
Figure 6.
Liver and lung histological evaluation. (A) Representative histological images with H&E staining of livers (100× magnification; the arrows indicate lymphocyte infiltration) from different mice. (B) Area of lymphocyte infiltration in the liver measured by using ImageJ software under 40× magnification. (C) Representative histological images with H&E staining of lungs (40× magnification; the arrows indicate lymphocyte infiltration) from different mice. (D) Area of lymphocyte infiltration in the lung was measured by using ImageJ software under 40× magnification. Values represent mean ± SD, and significance was assessed using 1-way analysis of variance with multiple comparisons and Tukey’s post-test. Significant P values (P < 0.05) are indicated in the figures.
Figure 7.
Figure 7.
Plasma levels of cytokines and chemokines in the different groups of mice. (A) T cell–associated cytokines and chemokines: IFN-γ, IL-2, IL-4, IL-5, IL-6, IL-10, IL12p70, IL-15, IL-27/p28/IL-30, and IP-10. (B) Monocyte/macrophage-associated cytokines and chemokines: MIP-1α, MIP-2, MCP-1, TNF-α, and IL-33. Values represent mean ± SD; 1-way analysis of variance with Tukey’s post-test for multiple comparisons. Significant P values (P < 0.05) are indicated in the figures.

Similar articles

References

    1. Dikiy S, Rudensky AY. Principles of regulatory T cell function. Immunity. 2023;56:240–255. - PubMed
    1. Trujillo-Ochoa JL, Kazemian M, Afzali B. The role of transcription factors in shaping regulatory T cell identity. Nat Rev Immunol. 2023;23:842–856. - PMC - PubMed
    1. Ben-Skowronek I. IPEX syndrome: genetics and treatment options. Genes (Basel). 2021;12:323. - PMC - PubMed
    1. Liu Y, Freeborn J, Armbrister SA, Tran DQ, Rhoads JM. Treg-associated monogenic autoimmune disorders and gut microbial dysbiosis. Pediatr Res. 2022;91:35–43. - PMC - PubMed
    1. Deaglio S et al. Adenosine generation catalyzed by CD39 and CD73 expressed on regulatory T cells mediates immune suppression. J Exp Med. 2007;204:1257–1265. - PMC - PubMed

Publication types