. 2025 Mar;14(7):e2403846.
doi: 10.1002/adhm.202403846. Epub 2025 Jan 23.

Synthetic Bilirubin-Based Nanomedicine Protects Against Renal Ischemia/Reperfusion Injury Through Antioxidant and Immune-Modulating Activity

Affiliations

Synthetic Bilirubin-Based Nanomedicine Protects Against Renal Ischemia/Reperfusion Injury Through Antioxidant and Immune-Modulating Activity

Ji-Jing Yan et al. Adv Healthc Mater. 2025 Mar.

Abstract

Renal ischemia/reperfusion injury (IRI) is a common form of acute kidney injury. The basic mechanism underlying renal IRI is acute inflammation, where oxidative stress plays an important role. Although bilirubin exhibits potent reactive oxygen species (ROS)-scavenging properties, its clinical application is hindered by problems associated with solubility, stability, and toxicity. In this study, BX-001N, a synthetic polyethylene glycol-conjugated bilirubin 3α nanoparticle is developed and assessed its renoprotective effects in renal IRI. Intravenous administration of BX-001N led to increase uptake in the kidneys with minimal migration to the brain after IRI. Peri-IRI BX-001N administration improves renal function and attenuates renal tissue injury and tubular apoptosis to a greater extent than free bilirubin on day 1 after IRI. BX-001N suppressed renal infiltration of inflammatory cells and reduced expression of TNF-α and MCP-1. Furthermore, BX-001N increases renal tubular regeneration on day 3 and suppresses renal fibrosis on day 28. BX-001N decreases the renal expressions of dihydroethidium, malondialdehyde, and nitrotyrosine after IRI. In conclusion, BX-001N, the first Good Manufacturing Practice-grade synthetic bilirubin-based nanomedicine attenuates acute renal injury and chronic fibrosis by suppressing ROS generation and inflammation after IRI. It shows adequate safety profiles and holds promise as a new therapy for renal IRI.

Keywords: bilirubin nanoparticle; immune modulation; ischemia/reperfusion injury; kidney; reactive oxygen species.


Conflict of interest statement

H.K., S. Jo, D.S., S.M.A., and M.L.K. are employees of Bilix Co., Ltd., which provided BX‐001N for this research. S. Jon is a cofounder and scientific advisory board member of Bilix Co., Ltd. J.Y. received a grant from Bilix Co., Ltd.

Figures
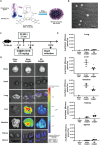
Figure 1
Figure 1
Structure and in vivo biodistribution of BX‐001N. A) BX‐001N is a self‐assembled PEGylated bilirubin 3α nanoparticle and consists of a synthetic bilirubin 3α molecule covalently bonded to 36 ethylene oxide moieties. B) The morphology of BX‐001N, as observed using transmission electron microscopy. Scale bars, 100 µm. C) Experimental scheme of BX‐001N biodistribution after IRI. D–E) Biodistribution images D) and average radiant efficiency E) of fluorescent dye Dil‐labeled BX‐001N (Dil@BX) in various organs after IRI. All samples in each group are displayed as individual dots, and lines and whiskers in dot plots indicate the mean and SEM, respectively. *p < 0.05, **p < 0.01 in comparison between the sham/Dil@BX‐001N and IRI/Dil@BX‐001N groups (Student's t‐test). Avg, average; B/L, bilateral; Dil, 1,1′‐Dioctadecyl‐3,3,3′,3′‐tetramethylindocarbocyanine; IRI, ischemia/reperfusion injury; MW, molecular weight; PBS, phosphate‐buffered saline; SEM, standard error of the mean.
Figure 2
Figure 2
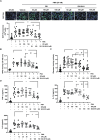
Beneficial effects of BX‐001N on neutrophil‐like cell‐mediated oxidative stress and inflammation. A) Intracellular levels of DCF‐DA in dHL‐60 cells. Green and blue indicate DCF‐DA and Hoechst, respectively. Fluorescent images at 40× magnification. B) MPO activity in dHL‐60 cells. C) Elastase activity in dHL‐60 cells. D) Protein expression levels of TNF‐α, IL‐1β, and IL‐8 in dHL‐60 cells. All samples in each group are displayed as individual dots, and lines and whiskers in dot plots indicate the mean and SEM, respectively. *p < 0.05, **p < 0.01 compared with the PMA control group (Student's t‐test or Mann–Whitney test). # p < 0.05, ## p < 0.01 in comparison between the BX‐001N and BR groups (Student's t‐test or Mann–Whitney test). BR, free bilirubin group; DCF‐DA, 2′,7′‐dichlorodihydrofluorescein diacetate; dHL‐60, differentiated HL‐60; IL‐1, interleukin‐1; IL‐8, interleukin‐8; MPO, myeloperoxidase; PMA, phorbol 12‐myristate 13‐acetate; SEM, standard error of the mean; TNF‐α, tumor necrosis factor‐ α.
Figure 3
Figure 3
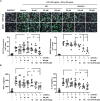
Beneficial effects of BX‐001N on macrophage‐mediated oxidative stress and inflammation. A) Intracellular levels of DCF‐DA and iNOS in RAW264.7 cells. Green and blue indicate DCF‐DA/iNOS and Hoechst, respectively. Fluorescent images at 40× magnification. B) Protein expression levels of TNF‐α and IL‐1β in RAW264.7 cells. All samples in each group are displayed as individual dots, and lines and whiskers in dot plots indicate the mean and SEM, respectively. *p < 0.05, **p < 0.01 compared with the LPS/IFN‐γ control group (Student's t‐test). # p < 0.05, ## p < 0.01 in comparison between the BX‐001N and BR groups (Student's t‐test). BR, free bilirubin group; DCF‐DA, 2′,7′‐dichlorodihydrofluorescein diacetate; IL‐1, interleukin‐1; INF‐γ, interferone‐gamma; iNOS, inducible nitric oxide synthase; LPS, lipopolysaccharide; SEM, standard error of the mean; TNF‐α, tumor necrosis factor‐1.
Figure 4
Figure 4
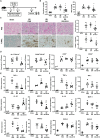
BX‐001N attenuated renal injury at acute phase after IRI. A) BX‐001N, BR, or PBS was administered to mice 1 h before and 1.5 h following renal IRI. The kidneys, along with blood samples were procured on day 1 after IRI. B) Blood levels of creatinine and BUN. C) Renal tissue injury scores (based on PAS staining) and renal tubular apoptosis (based on TUNEL staining). Scale bars, 100 µm. Magnification, 200×. D) Absolute number of renal Gr‐1+CD11b+ neutrophils, F4/80+CD11b+ macrophages, CD3+ T cells, and CD19+ B cells. E) Renal mRNA expression levels of Tnfa, Ifng, Il10, Mcp1, Cxcl1, and Cxcl2 normalized to Gapdh expression levels. F) Protein expression levels of TNF‐α, INF‐γ, IL‐10, MCP‐1, CXCL1, and CXCL2. All samples in each group are displayed as individual dots, and lines and whiskers in dot plots indicate the mean and SEM, respectively. *p < 0.05, **p < 0.01 compared to the PBS group (Student's t‐test or Mann–Whitney test). # p < 0.05, ## p < 0.01 in comparison between the BX‐001N and BR groups (Student's t‐test). BR, free bilirubin group; BUN, blood urea nitrogen; CXCL, CXC motif chemokine ligand; Gapdh, glyceraldehyde 3‐phosphate dehydrogenase; HPF, high‐power field; INF‐γ, interferon‐γ; IL, interleukin; IRI, ischemia/reperfusion injury; MCP‐1, monocyte chemoattractant protein‐1; PAS, periodic acid–Schiff; PBS, phosphate‐buffered saline; SEM, standard error of the mean; TNF‐α, tumor necrosis factor‐α; TUNEL, terminal deoxynucleotidyl transferase dUTP nick‐end labeling.
Figure 5
Figure 5
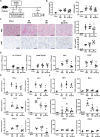
BX‐001N facilitated renal recovery at the subacute phase after IRI. A) BX‐001N, BR, or PBS was administered to mice 1 h prior to and 1.5 h following renal IRI. The kidneys along with blood samples were procured on day 3 after IRI. B) Blood levels of creatinine and BUN. C) Renal tissue injury scores (based on PAS staining) and renal tubular regeneration (Ki67 staining). Scale bars, 100 µm. Magnification, 200×. D) Absolute number of renal Gr‐1+CD11b+ neutrophils, F4/80+CD11b+ macrophages, CD3+ T cells, and CD19+ B cells. E) Renal mRNA expression levels of Tnfa, Ifng, Il10, Mcp1, Cxcl1, and Cxcl2 normalized to Gapdh expression levels. F) Protein expression levels of TNF‐α, INF‐γ, IL‐10, MCP‐1, CXCL1, and CXCL2. All samples in each group are displayed as individual dots, and lines and whiskers in dot plots indicate the mean and SEM, respectively. *p < 0.05, **p < 0.01 compared to the PBS group (Student's t‐test). # p < 0.05, ## p < 0.01 in comparison between the BX‐001N and BR groups (Student's t‐test or Mann–Whitney test). BR, free bilirubin group; BUN, blood urea nitrogen; CXCL, CXC motif chemokine ligand; Gapdh, glyceraldehyde 3‐phosphate dehydrogenase; HPF, high‐power field; INF‐γ, interferon‐γ; IL, interleukin; IRI, ischemia/reperfusion injury; MCP‐1, monocyte chemoattractant protein‐1; PAS, periodic acid–Schiff; PBS, phosphate‐buffered saline; SEM, standard error of the mean; TNF‐α, tumor necrosis factor‐α.
Figure 6
Figure 6
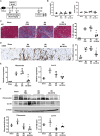
BX‐001N suppressed renal fibrosis at chronic phase after IRI. A) BX‐001N, BR, or PBS was administered to mice 1 h prior to and 1.5 h following renal IRI. Kidneys along with blood samples were procured on day 28 after IRI. B) Blood levels of creatinine and BUN. C) Renal fibrosis based on MT staining. Scale bars, 200 µm. Magnification, 100×. D) Immunohistochemical staining images for αSMA. Scale bars, 100 µm. Magnification, 200×. E) Renal mRNA expression level of fibronectin (Fn1) and Col‐IV (Col4a1) normalized to Gapdh expression level. F) Protein expression levels of fibronectin, Col‐IV, and β‐actin. All samples in each group are displayed as individual dots, and lines and whiskers in dot plots indicate the mean and SEM, respectively. *p < 0.05, **p < 0.01 compared to the PBS group (Student's t‐test). ## p < 0.01 in comparison between the BX‐001N and BR groups (Student's t‐test). αSMA, α‐smooth muscle actin; BR, free bilirubin group; BUN, blood urea nitrogen; Col‐IV, type IV collagen; Gapdh, glyceraldehyde 3‐phosphate dehydrogenase; HPF, high‐power field; IRI, ischemia/reperfusion injury; MT, Masson's trichrome; PBS, phosphate‐buffered saline; SEM, standard error of the mean.
Figure 7
Figure 7
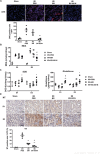
BX‐001N attenuated IRI‐induced oxidative stress in kidney tissues. A) Confocal images for DHE (red) and DAPI (blue) on day 1. Scale bars, 50 µm. Magnification, 400×. B) MDA levels in kidney tissues. C) SOD activities and glutathione levels in kidney tissues on days 1 and 3. D) Immunohistochemical staining images for nitrotyrosine in kidney tissues on days 1 and 3. Scale bars, 100 µm. Magnification, ×200. All samples in each group are displayed as individual dots, and lines and whiskers in dot plots indicate the mean and SEM, respectively. *p < 0.05, **p < 0.01 compared with the PBS group (Student's t‐test). # p < 0.05, ## p < 0.01 in comparison between the BX‐001N and BR groups (Student's t‐test). BR, free bilirubin group; D1, day 1; D3, day 3; DAPI, 4′,6‐diamidino‐2‐phenylindole; DHE, dihydroethidium; HPF, high‐power field; IRI, ischemia/reperfusion injury; MDA, malondialdehyde; NT, nitrotyrosine; PBS, phosphate‐buffered saline; SEM, standard error of the mean; SOD, superoxide dismutase.
Figure 8
Figure 8
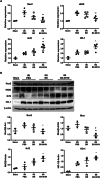
BX‐001N suppressed renal Nox2/iNOS expression and activated renal Nrf2/HO‐1 expression after IRI. A) Renal mRNA expression levels of Nox2, iNos, Nrf2, and HO‐1 normalized to Gapdh expression levels on day 1 after IRI. B) Western blot images for renal expression of Nox2, iNOS, Nrf2, HO‐1, and β‐actin on day 1 after IRI. All samples in each group are displayed as individual dots, and lines and whiskers in dot plots indicate the mean and SEM, respectively. *p < 0.05, **p < 0.01 compared with the PBS group (Student's t‐test). # p < 0.05, ## p < 0.01 in comparison between the BX‐001N and BR groups (Student's t‐test). BR, free bilirubin group; HO‐1, heme oxygenase‐1; iNOS, inducible nitric oxide synthase; IRI, ischemia/reperfusion injury; Nrf2, nuclear factor erythroid‐2‐related factor 2; Nox, nicotinamide adenine dinucleotide phosphate oxidase; PBS, phosphate‐buffered saline; SEM, standard error of the mean.

References

    1. Liu J., Kumar S., Dolzhenko E., Alvarado G. F., Guo J., Lu C., Chen Y., Li M., Dessing M. C., Parvez R. K., Cippa P. E., Krautzberger A. M., Saribekyan G., Smith A. D., McMahon A. P., JCI Insight 2017, 2, e94716. - PMC - PubMed
    1. Liu B. C., Tang T. T., Lv L. L., Lan H. Y., Kidney Int. 2018, 93, 568. - PubMed
    1. Strausser S. A., Nakano D., Souma T., Curr. Opin. Nephrol. Hypertens. 2018, 27, 314. - PubMed
    1. Guzzi F., Cirillo L., Roperto R. M., Romagnani P., Lazzeri E., Int. J. Mol. Sci. 2019, 20, 4941. - PMC - PubMed
    1. Jang H. R., Rabb H., Nat. Rev. Nephrol. 2015, 11, 88. - PubMed

MeSH terms