. 2025 Mar 15;40(3):413-427.
doi: 10.1093/jbmr/zjaf008.

Early and multiple doses of zoledronate mitigates rebound bone loss following withdrawal of receptor activator of nuclear factor kappa-B ligand inhibition

Affiliations

Early and multiple doses of zoledronate mitigates rebound bone loss following withdrawal of receptor activator of nuclear factor kappa-B ligand inhibition

Albert S Kim et al. J Bone Miner Res. .

Abstract

Rebound bone loss following denosumab discontinuation is an important barrier in the effective long-term treatment of skeletal disorders. This is driven by increased osteoclastic bone resorption following the offset of RANKL inhibition, and sequential osteoclast-directed therapy has been utilized to mitigate this. However, current sequential treatment strategies intervene following the offset of RANKL inhibition and this approach fails to consistently prevent bone loss. Our previous work, using a mouse model of denosumab discontinuation, has shown that the processes that drive the rebound phenomenon occur earlier than when bone loss is detected, namely a rise and overshoot in serum tartrate-resistant acid phosphatase (TRAP). We identified that these changes in serum TRAP may provide an earlier window of opportunity to intervene with sequential therapy following RANKL inhibition withdrawal. Here, we show that early treatment with zoledronate (10 mg/kg, 3 wk following the last dose of OPG:Fc), preceding the rise and overshoot in serum TRAP, effectively mitigates rebound bone density loss through preventing the overshoot in serum TRAP. Further, we show that multiple doses of zoledronate (early treatment and during anticipated BMD loss) is superior in consolidating bone density gains made with RANKL inhibition and preventing rebound BMD loss as measured by DXA. Importantly, we demonstrate the efficacy of early and multi-dose zoledronate strategy in preventing bone loss in both growing and skeletally mature mice. MicroCT analysis showed improved trabecular bone structure in both the femur and lumbar vertebrae with zoledronate treatment compared with control. These increases in bone mass translated to increased fracture resistance in skeletally mature mice. This work provides a novel approach of early and multi-dose sequential treatment strategy following withdrawal of RANKL inhibition, contributing valuable insight into the clinical management of patients who discontinue denosumab therapy.

Keywords: denosumab; denosumab discontinuation; osteoporosis; sequential therapy; zoledronate.

Plain language summary

Stopping denosumab leads to loss of bone gained during treatment, due to increased bone resorption when denosumab wears off. Current strategies often fail to prevent this as they cannot stop osteoclasts resorbing bone. Our work using a mouse model has shown that processes that lead to bone loss start earlier than we can detect in the clinic. We show that early and multi-dose zoledronate treatment, another medication used to block osteoclasts, to target these earlier processes can prevent bone loss after stopping denosumab. This approach offers a new strategy for managing bone health in patients stopping denosumab.


Conflict of interest statement

M.M.M. has received honoraria for speaking from Amgen Inc.

Figures

Figure 1
Figure 1
Pro-osteoclastogenic environment develops before a rise in CTX or BMD loss is detected following withdrawal of RANKL inhibition. Schematic summarizing our model of denosumab discontinuation utilizing OPG:Fc in growing mice showing the rebound phenomenon following withdrawal of RANKL inhibition. BMD and serum RANKL rise with OPG:Fc treatment, while serum TRAP and CTX are suppressed. As there is offset of RANKL inhibition, serum TRAP rises as BMD falls with a rise in CTX following this. Current sequential therapy strategies intervene at a time of CTX rise and/or BMD decline, at or later than 6 mo following the last denosumab dose, despite increased markers of osteoclast formation and activity preceding this. A rise in serum RANKL and TRAP may provide an earlier intervention window to prevent BMD loss analogous to within 6 mo of the last denosumab dose. Created in Biorender.com.
Figure 2
Figure 2
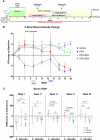
Sequential zoledronate at the time of CTX rise does not prevent bone loss. (A) Schematic of the experimental design to assess the effect of sequential zoledronate following OPG:Fc treatment in growing mice. Expected timing of a rise in serum TRAP, P1NP, CTX, and rebound bone loss highlighted. (B) BMD changes following OPG:Fc treatment and sequential treatment at week 12, at a time of expected CTX rise. BMD shown as percentage change from baseline levels following treatment with OPG:Fc or saline followed by zoledronate or saline at week 12 (n = 6 in vehicle, n = 7 per intervention group). Timing of zoledronate is denoted by a vertical dotted line at week 12. The vertical lines at weeks 8, 10, 12, and 14 denote time of CTX and TRAP analysis. Data are represented as mean ± SD. The asterisks indicate p-values <.05 (*p < .05, **p < .01, ****p < .0001). (C) Serum CTX measured by ELISA at (i) week 12 and (ii) week 14. Data are represented as mean ± SD. (D) Serum TRAP measured by ELISA at (i) week 8, (ii) 10, (iii) 12, and (iv) 14. Data are represented as mean ± SD.
Figure 3
Figure 3
Early and multiple doses of sequential zoledronate prevents rebound BMD loss and the rise and overshoot in serum TRAP in growing mice. (A) Schematic of the experimental design to assess the effect of sequential zoledronate following OPG:Fc treatment in growing mice. Expected timing of a rise in serum TRAP, P1NP, CTX, and rebound bone loss is highlighted. (B) BMD changes following OPG:FC treatment and sequential zoledronate as early single dose at week 5 or multiple doses at weeks 5 and 12. BMD shown as a percentage change from baseline levels following treatment with OPG:Fc or saline followed by zoledronate or saline at weeks 5 and 12 (n = 8 per group). Data are represented as mean ± SD. The asterisks indicate p-values <.05 (*p < .05, **p < .01, ***p < .001, ****p < .0001). (C) Longitudinal serum TRAP measured by ELISA at baseline and following 2 wk treatment with OPG:Fc or saline followed by zoledronate or saline at weeks 5 and 12. Data are represented as mean ± SD. The asterisks indicate p-values <.05 (*p < .05, **p < .01, ***p < .001, ****p < .0001).
Figure 4
Figure 4
Early and multiple doses of sequential zoledronate prevents rebound BMD loss and the rise and overshoot in serum TRAP in skeletally mature mice. (A) Schematic of the experimental design to assess the effect of sequential zoledronate following OPG:Fc treatment in skeletally mature mice. Expected timing of a rise in serum TRAP, P1NP, CTX, and rebound bone loss is highlighted. (B) BMD changes following OPG:Fc treatment and sequential treatment at weeks 7 and 13. BMD is shown as a percentage change from baseline levels following treatment with OPG:Fc or saline followed by zoledronate or saline at weeks 7 and 13 (n = 10 per group). Data are represented as mean ± SD. The asterisks indicate p-values <.05 (*p < .05, **p < .01, ****p < .0001). (C) Serum TRAP measured by ELISA in mice treated with OPG:Fc and sequential treatment at each timepoint compared with vehicle (n = 7-10 per group), expressed as a percentage difference compared with the vehicle mean. The boxplots represent mean ± SD. The displayed p-values indicate statistical significance between treatment groups at each timepoint.
Figure 5
Figure 5
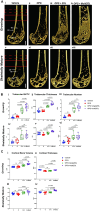
Changes in bone microarchitecture in the femur following OPG:Fc treatment and sequential zoledronate therapy. (A) Representative 3D images of harvested femora showing differences in bone microarchitecture between mice treated with saline and OPG:Fc followed by zoledronate or saline in (i-iv) growing and (v-viii) skeletally mature mice. The dashed red box denotes an ROI examined at a 0.5 mm section located 3 mm above the growth plate (GP) where the cortical parameters are calculated. The solid red box denotes ROI examined at a 1 mm section located 2 mm above the growth plate where the trabecular parameters are calculated. (B) Differences in trabecular volume (i, iv), thickness (ii, v), and number (iii, vi) between growing mice or skeletally mature mice treated with saline (vehicle) or OPG:Fc followed by sequential zoledronate. The boxplots represent mean ± SD. (C) Differences in cortical volume (i, iii) and thickness (ii, iv) between growing mice or skeletally mature mice treated with saline (vehicle) or OPG:Fc followed by sequential zoledronate. The boxplots represent mean ± SD. Abbreviations: CB, cortical bone, TB, trabecular bone.
Figure 6
Figure 6
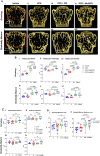
Sequential zoledronate following OPG:Fc prevented trabecular bone loss and improved fracture resistance in skeletally mature mice, but not in growing mice. (A) Representative 3D images of harvested L4 vertebrae showing differences in bone microarchitecture between mice treated with saline and OPG:Fc followed by zoledronate or saline in (i-iv) growing and (v-viii) skeletally mature mice. The solid red box denotes ROI examined at a distance between 0.2 mm offset from the point of 50% spongiosa and trabecular bone on both ends of the vertebrae. (B) Differences in trabecular volume (i, iv), thickness (ii, v), and number (iii, vi) between growing mice or skeletally mature mice treated with saline (vehicle) or OPG:Fc followed by sequential zoledronate. The boxplots represent mean ± SD. (C) Differences in cortical volume (i, iii) and thickness (ii, iv) between growing mice or skeletally mature mice treated with saline (vehicle) or OPG:Fc followed by sequential zoledronate. The boxplots represent mean ± SD. (D) Maximum load to failure (N) of L4 vertebrae from each treatment group in growing mice (i) and skeletally mature mice (ii). Boxplots represent mean ± SD. Abbreviations: CB, cortical bone, TB, trabecular bone.
Figure 7
Figure 7
Differences in osteoclast number following OPG:Fc treatment and sequential zoledronate. (A) Representative histological images of femora stained with TRAP (red) harvested following treatment with saline or OPG:Fc. Analysis of osteoclast parameters on trabecular bone was performed within the ROI defined by the dotted line (scale bar 900 μm at 2.2x magnification). Representative high magnification images are shown in the top left corner and their corresponding ROIs are shown in the black box (scale bar 300 μm at 9.8x magnification). The red box denotes osteoclasts observed on trabecular bone surfaces as shown in magnified images in Figure 7C. (B) Quantification of number of osteoclasts (i, iii) and osteoclast surface (ii, iv) per trabecular bone surfaces in growing and skeletally mature mice. The boxplots represent mean ± SD. (C) Representative images of osteoclasts observed on trabecular bone surfaces throughout the study in the ROI marked by the red box in Figure 7A (scale bar 300 μm at 7x magnification).

Similar articles

Cited by

References

    1. Cummings SR, Martin JS, McClung MR, et al. Denosumab for prevention of fractures in postmenopausal women with osteoporosis. N Engl J Med. 2009;361(8):756–765. 10.1056/NEJMoa0809493 - DOI - PubMed
    1. Bone HG, Wagman RB, Brandi ML, et al. 10 years of denosumab treatment in postmenopausal women with osteoporosis: results from the phase 3 randomised FREEDOM trial and open-label extension. Lancet Diabetes Endocrinol. 2017;5(7):513–523. 10.1016/S2213-8587(17)30138-9 - DOI - PubMed
    1. Freemantle N, Satram-Hoang S, Tang E-T, et al. Final results of the DAPS (denosumab adherence preference satisfaction) study: a 24-month, randomized, crossover comparison with alendronate in postmenopausal women. Osteoporos Int. 2012;23(1):317–326. 10.1007/s00198-011-1780-1 - DOI - PMC - PubMed
    1. Wang M, Wu YF, Girgis CM. Bisphosphonate drug holidays: evidence from clinical trials and real world studies. JBMR Plus. 2022;6(6):e10629. 10.1002/jbm4.10629 - DOI - PMC - PubMed
    1. Black DM, Geiger EJ, Eastell R, et al. Atypical femur fracture risk versus fragility fracture prevention with bisphosphonates. N Engl J Med. 2020;383(8):743–753. 10.1056/NEJMoa1916525 - DOI - PMC - PubMed

MeSH terms