. 2025 Mar 3;224(3):e202406061.
doi: 10.1083/jcb.202406061. Epub 2025 Jan 23.

Centriolar cap proteins CP110 and CPAP control slow elongation of microtubule plus ends

Affiliations

Centriolar cap proteins CP110 and CPAP control slow elongation of microtubule plus ends

Saishree S Iyer et al. J Cell Biol. .

Abstract

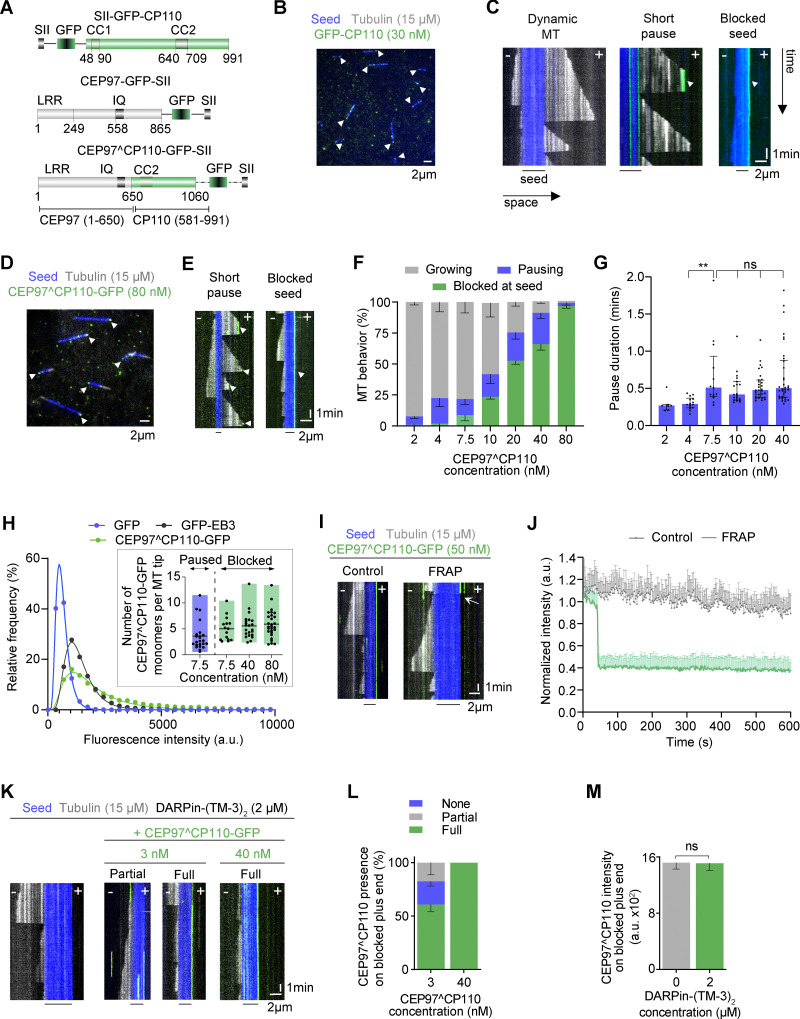
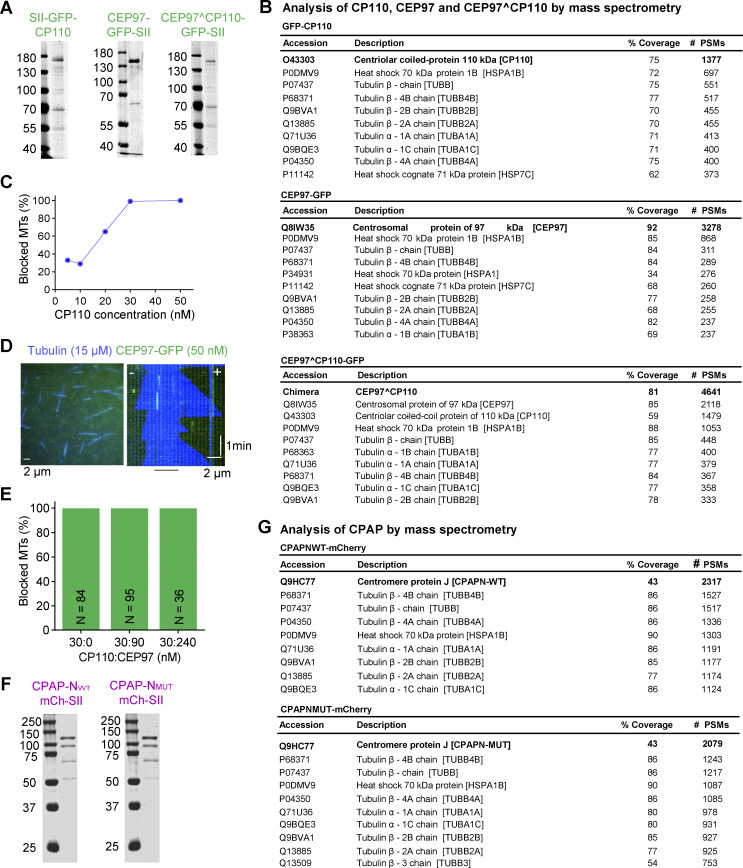
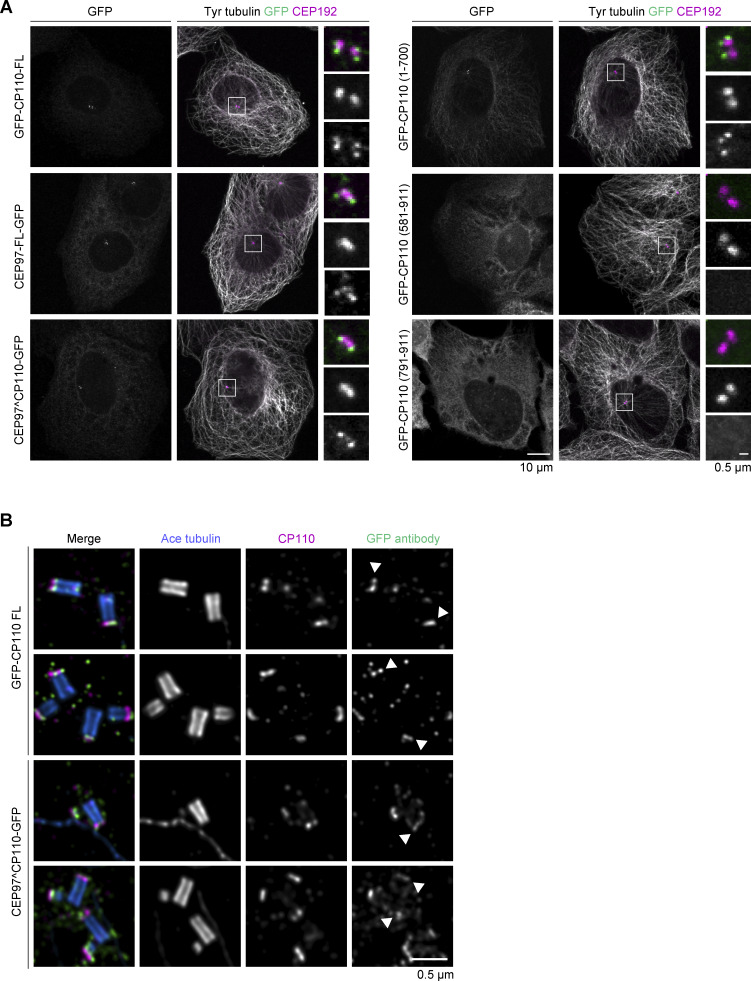
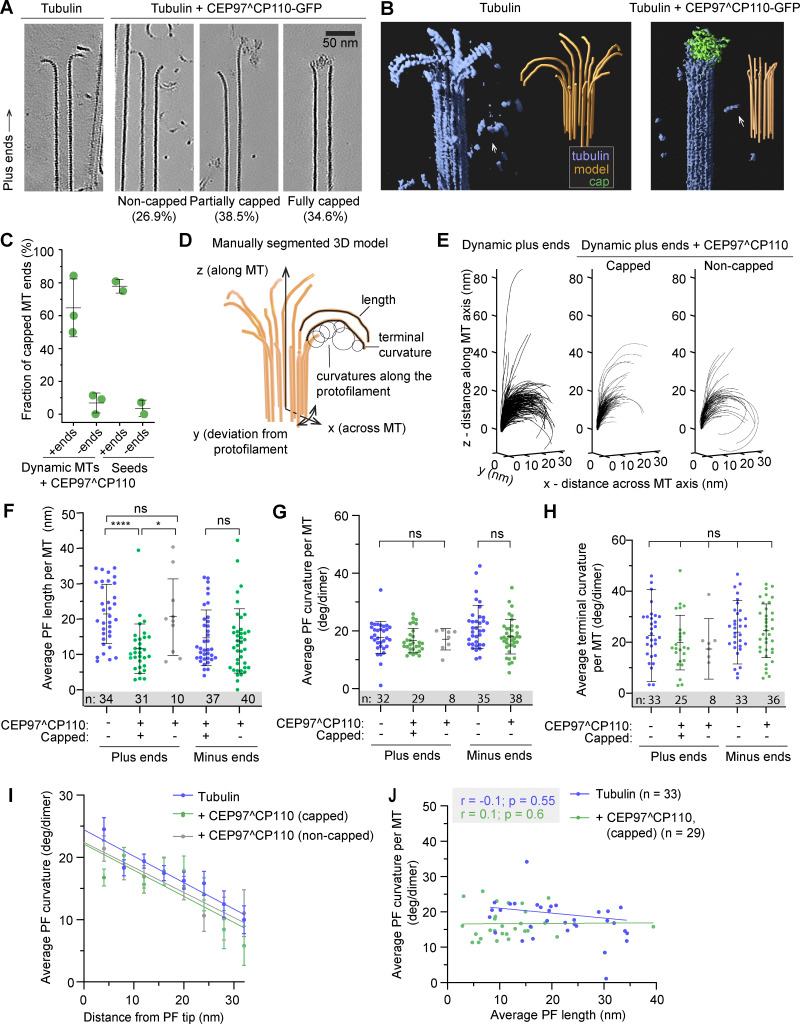
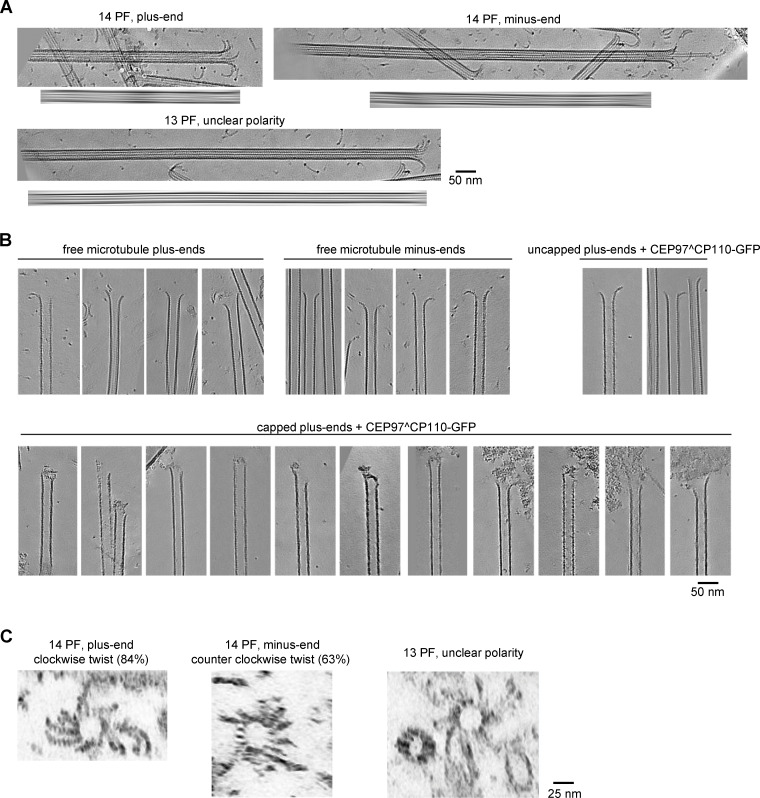
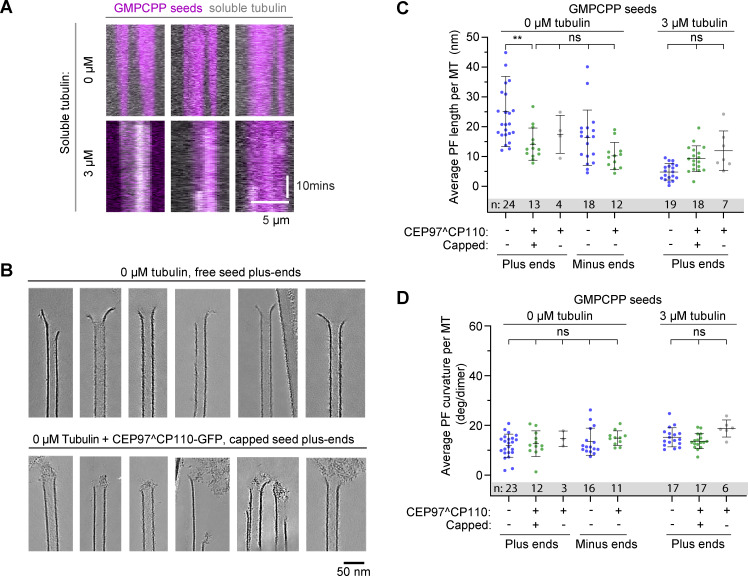
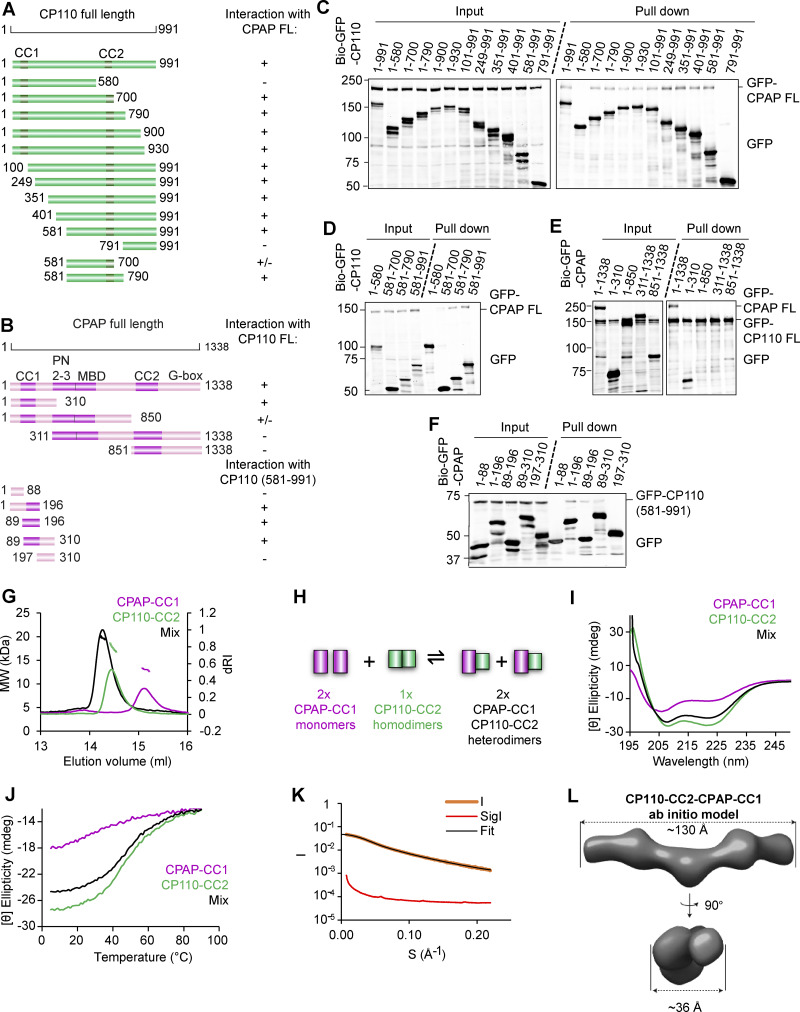
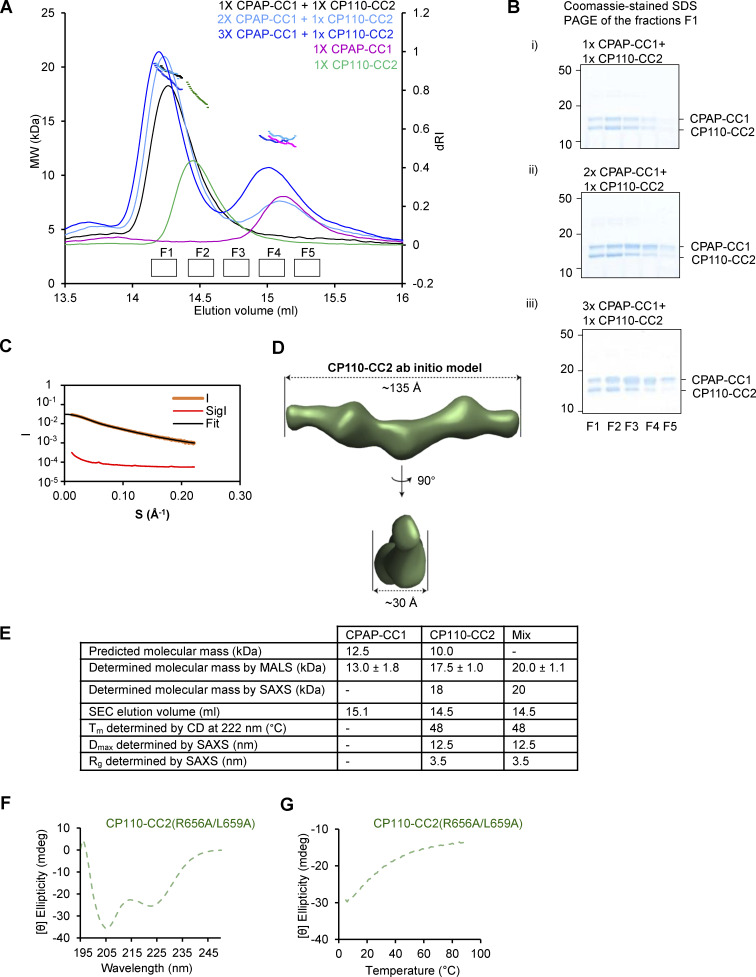
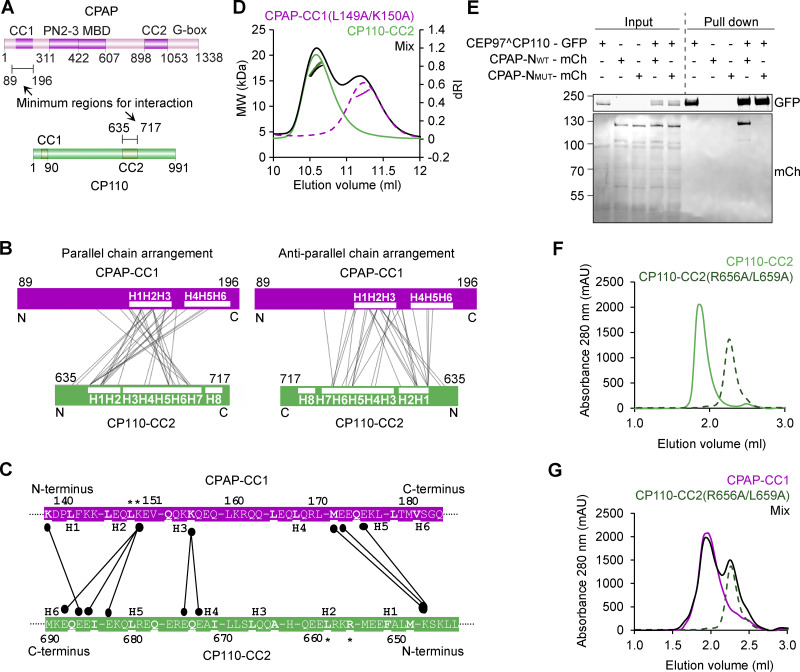
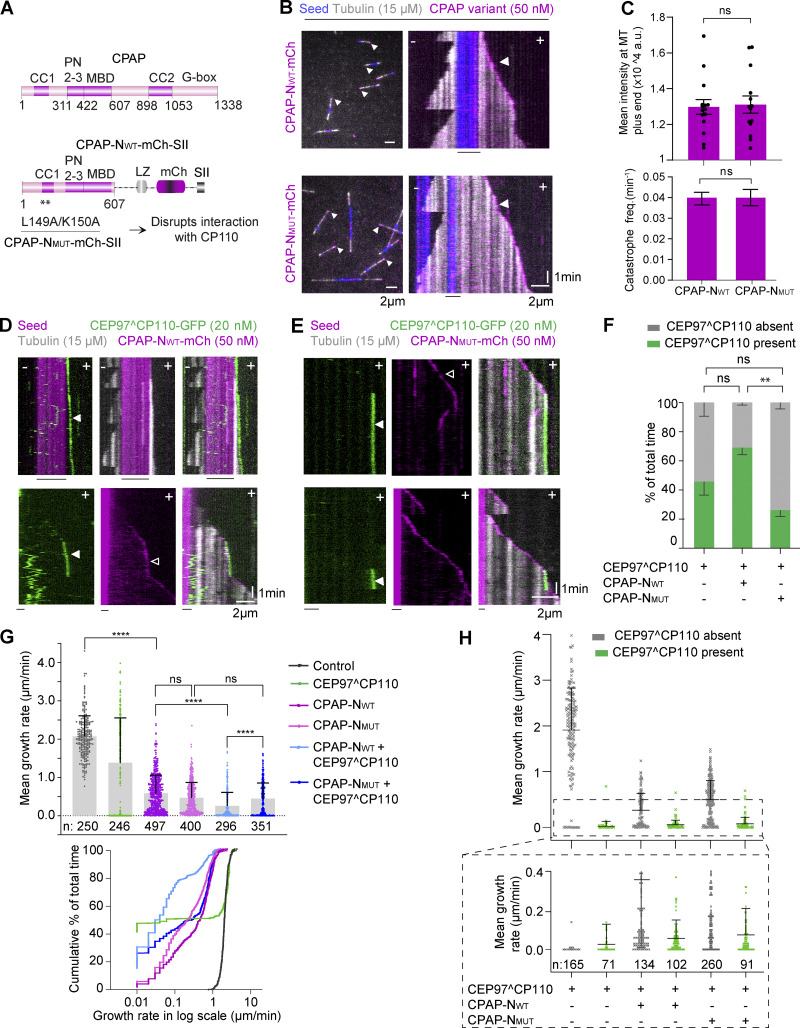
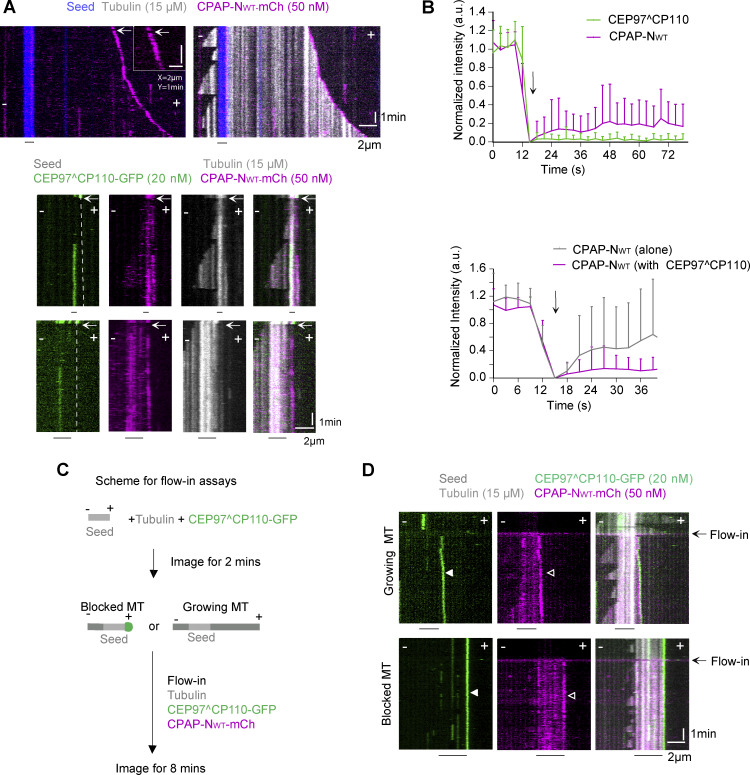
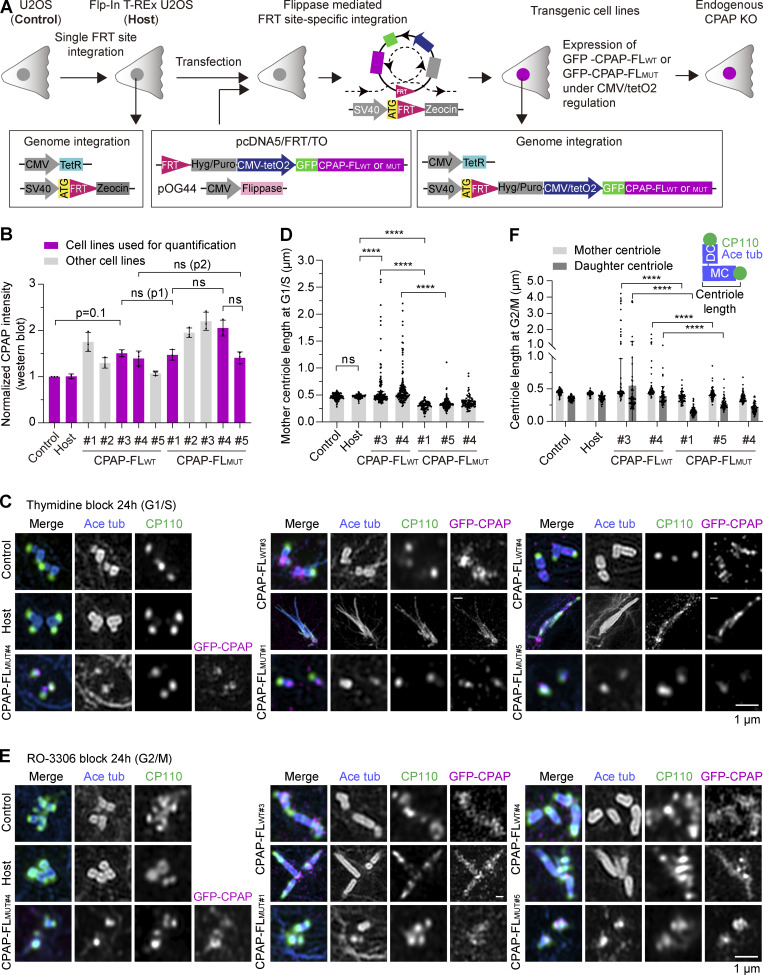
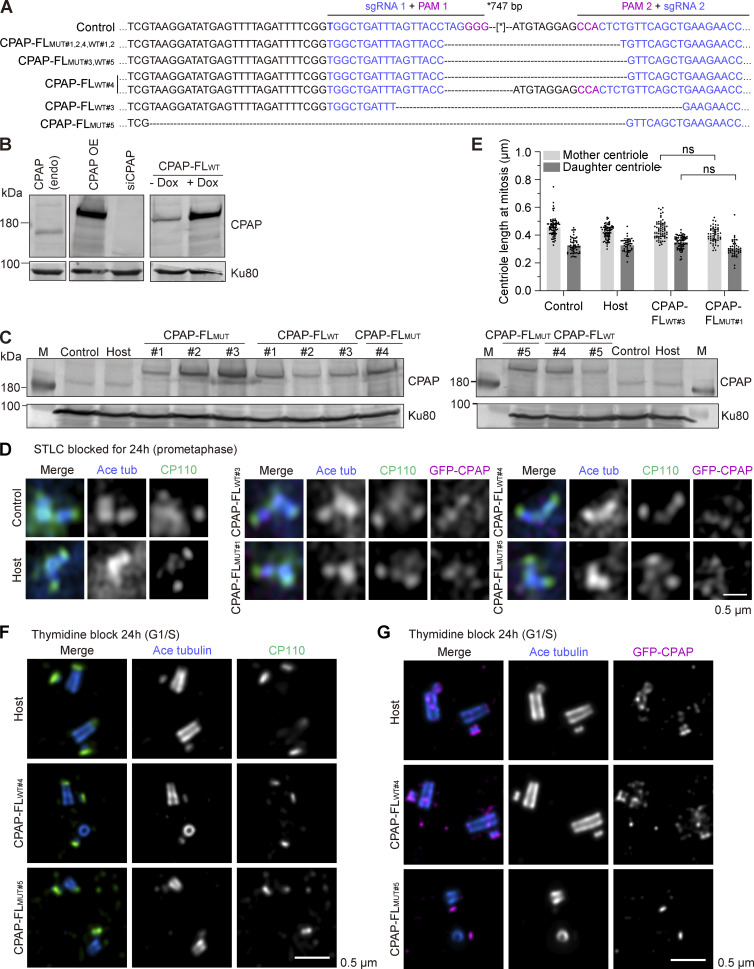
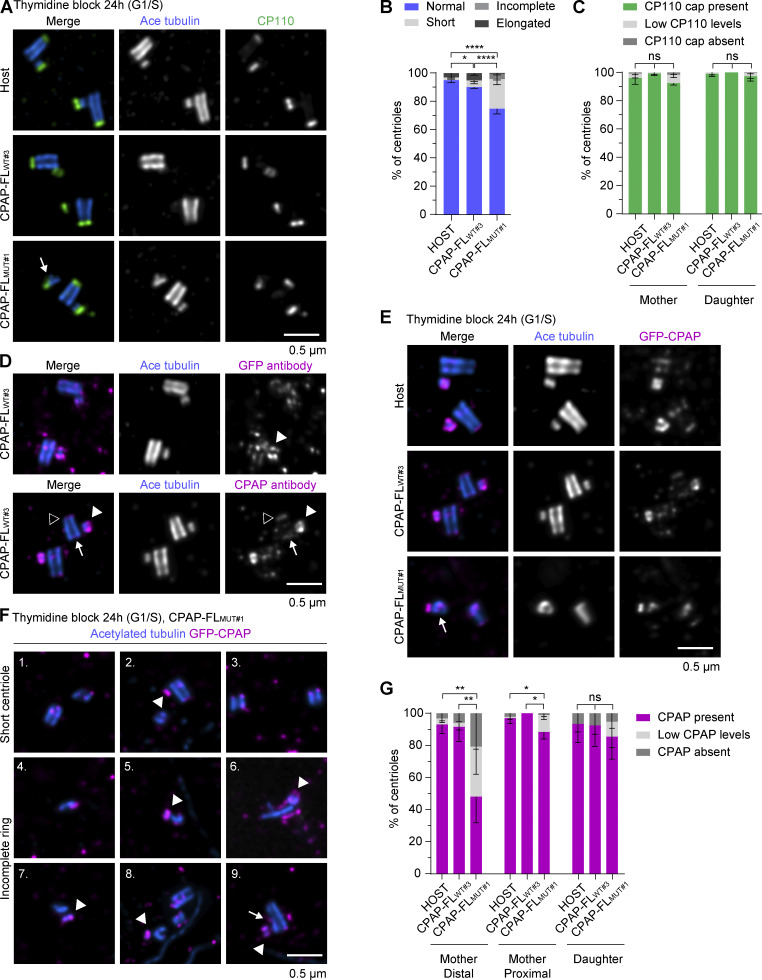
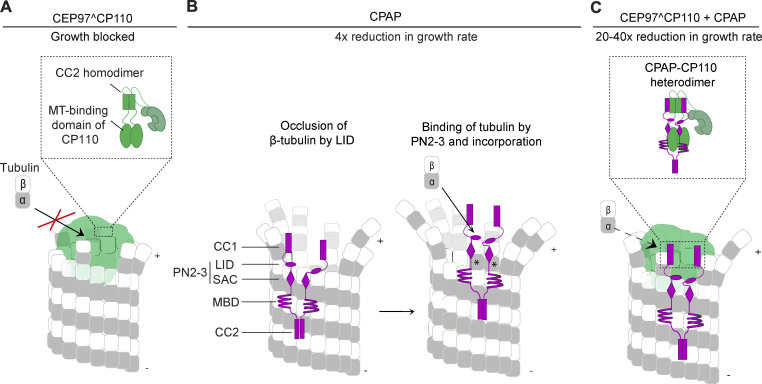
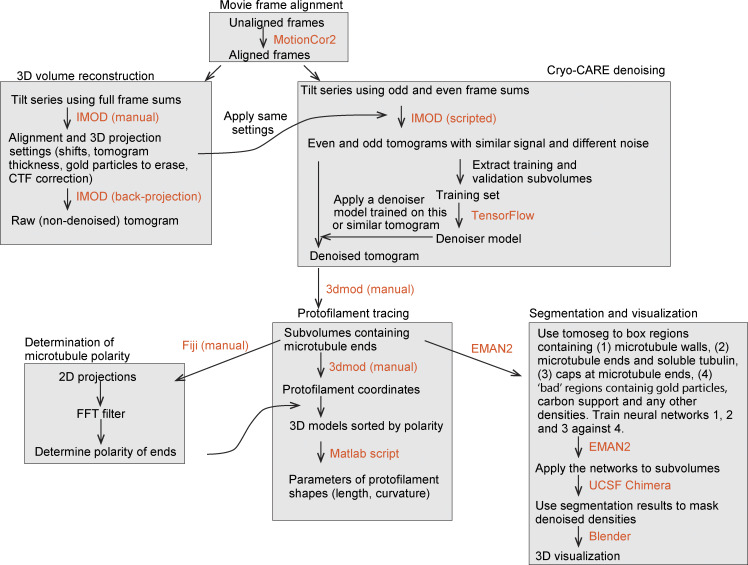
Centrioles are microtubule-based organelles required for the formation of centrosomes and cilia. Centriolar microtubules, unlike their cytosolic counterparts, are stable and grow very slowly, but the underlying mechanisms are poorly understood. Here, we reconstituted in vitro the interplay between the proteins that cap distal centriole ends and control their elongation: CP110, CEP97, and CPAP/SAS-4. We found that whereas CEP97 does not bind to microtubules directly, CP110 autonomously binds microtubule plus ends, blocks their growth, and inhibits depolymerization. Cryo-electron tomography revealed that CP110 associates with the luminal side of microtubule plus ends and suppresses protofilament flaring. CP110 directly interacts with CPAP, which acts as a microtubule polymerase that overcomes CP110-induced growth inhibition. Together, the two proteins impose extremely slow processive microtubule growth. Disruption of CP110-CPAP interaction in cells inhibits centriole elongation and increases incidence of centriole defects. Our findings reveal how two centriolar cap proteins with opposing activities regulate microtubule plus-end elongation and explain their antagonistic relationship during centriole formation.


Conflict of interest statement

Disclosures: The authors declare no competing interests exist.

Figures

Figure 1.
Figure 1.
CP110 binds to MT plus ends and blocks their growth. (A) Scheme illustrating the domain organization of GFP-tagged human CEP97, CP110, and CEP97^CP110 chimeric constructs. Domain nomenclature: LRR, leucine-rich region; CC, coiled coil; IQ is the calmodulin-binding domain; GFP, green fluorescent protein; and SII, twin-Strep-tag. (B and D) Representative fields of view from time-lapse movies of in vitro reconstitution of MT growth from GMPCPP-stabilized seeds (blue) in presence of 15 μM tubulin (gray) and 30 nM GFP-CP110 (green) (B) or 80 nM CEP97^CP110-GFP (green) (D); blocked plus ends are indicated with arrowheads. (C and E) Kymographs illustrating a dynamic MT without CP110 or CEP97^CP110 binding, transient pausing, or plus end blocking by CP110 (C) or CEP97^CP110 (E); growth, pauses, or blocking events are indicated by white arrows. The plus and minus ends of the MTs are indicated by “+” and “−,” respectively, and lines below kymographs indicate the position of the GMPCPP-stabilized seed. (F and G) Percentage of MTs displaying no pauses, occasional pauses, or fully blocked seeds (F) and pause duration (G), observed over 10 min with increasing concentrations of CEP97^CP110. Plots show percentage mean-SEM (F) and median ± interquartile range (IQR) of pause duration (G) at different CEP97^CP110 concentrations, with data points showing individual MT plus ends. Nonsignificant (ns), P > 0.05; **P = 0.0036 with Kruskal–Wallis ANOVA with Dunn’s test for multiple comparisons. n = 7, 14, 13, 20, 30, and 34 MT plus ends for 2, 4, 7.5, 10, 20, and 40 nM of CEP97^CP110, respectively. Number of independent assays was 3, 3, 4, 3, 3, 3, 4 for 2, 4, 7.5, 10, 20, 40, and 80 nM CEP97^CP110. (H) Histograms of fluorescence intensities of single molecules of GFP (n = 6,865), GFP-EB3 (n = 14,082), and CEP97^CP110-GFP (n = 6,942) immobilized on coverslips (symbols) and the corresponding fits with lognormal distributions (lines). The inset shows the number of CEP97^CP110-GFP molecules present at a paused or blocked MT plus end. The values were obtained by comparing the fitted mean intensity of CEP97^CP110-GFP at MT tips with the fitted mean intensity of single GFP molecules in parallel chambers. Floating bars represent maximum to minimum intensities of CEP97^CP110-GFP molecules relative to GFP per condition, with the line showing the mean value (n = 23 MTs for paused MTs at 7.5 nM, for blocked MTs n = 15 at 7.5 nM, n = 22 at 40 nM, and n = 28 at 80 nM). (I) Kymographs showing unbleached control and bleached CEP97^CP110-GFP at a blocked MT plus end. White arrow shows the moment of bleaching. (J) Mean + SD of the normalized intensity of CEP97^CP110-GFP at the MT plus end with (n = 28 MTs) and without bleaching (n = 12 MTs) from three independent assays. Frames were acquired at 2 s time interval. (K) Kymographs showing MT plus ends blocked with 2 µM unlabeled DARPin-(TM-3)2 alone (right) or in combination with 3 nM (middle) or 40 nM (right) CEP97^CP110-GFP (green). CEP97^CP110-GFP was bound for a part of the observation time (partial) or for the whole 10 min duration of the movie (full). (L) Percentage of MT plus ends blocked by DARPin-(TM-3)2 that also have CEP97^CP110 bound to them at 3 nM (n = 91 MTs) and 40 nM (n = 110 MTs) in two and four independent assays, respectively. (M) Mean-SEM of fluorescence intensity of CEP97^CP110-GFP on MT plus ends in presence (n = 83 MTs) and absence (n = 76 MTs) of DARPin-(TM-3)2 in two and four independent assays, respectively. Nonsignificant (ns), P = 0.626 with a two tailed Mann–Whitney U test.
Figure S1.
Figure S1.
Characterization of purified proteins used in this study. (A) SDS-PAGE gel of GFP-CP110, CEP97-GFP, and CEP97^CP110-GFP, purified from HEK293T cells. Gels were stained with Coomassie brilliant blue R250. (B) Analysis of purified GFP-CP110, CEP97-GFP, and CEP97^CP110-GFP by mass spectrometry. (C) The proportion of fully blocked MTs with increasing concentrations of GFP-CP110 in in vitro reconstitution assays. n = 91, 28, 142, 105, and 140 MT plus ends for 5, 10, 20, 30, and 50 nM GFP-CP110. (D) A still image and a kymograph representing dynamic MT (blue) behavior in the presence of 50 nM CEP97-GFP (green, no binding). (E) Bar plot showing that CEP97-GFP does not affect the plus end blocking of dynamic MTs in vitro by GFP-CP110. The numbers of analyzed MTs are indicated on the bar plots. (F) SDS-PAGE of CPAP-NWT-mCh and CPAP-NMUT-mCh, purified from HEK293T cells. Gels were stained with Coomassie brilliant blue R250. (G) Analysis of purified CPAP-NWT-mCh and CPAP-NMUT-mCh by mass spectrometry. Source data are available for this figure: SourceData FS1.
Figure S2.
Figure S2.
Subcellular localization of GFP-tagged CP110 and its fragments, CEP97, and CEP97^CP110 chimera. (A) U2OS transiently transfected with the indicated GFP-tagged constructs were fixed and stained with antibodies against CEP192 (magenta), GFP (green), and tyrosinated tubulin (gray). White box highlights region with centrioles, which are enlarged in zoom. (B) U-ExM images of centrioles from U2OS cells overexpressing the indicated constructs and stained for acetylated tubulin (blue), CP110 (magenta), and GFP (green). CP110 full-length and CEP97^CP110 both localize to the distal cap of the mother centriole (white arrowhead) and distal cap of the daughter centriole.
Figure 2.
Figure 2.
CEP97^CP110 forms caps at the plus ends of dynamic MT and straightens their PFs. (A) Slices through denoised tomograms containing MT plus ends in the absence or presence of 80 nM CEP97^CP110-GFP and 15 µM tubulin. (B) Segmented and 3D rendered volumes containing MT plus ends (blue), capping density (green), and manually segmented 3D models of traced PF shapes (orange). Arrows point to soluble tubulin oligomers. (C) Fraction of MT ends associated with a capping density. Data points show individual grids, line shows mean ± SD. (D) Scheme showing the parameters extracted from manual segmentations of terminal PFs. (E) All PF traces obtained from plus ends, aligned at their origin, in presence of 15 µM tubulin alone (right), with CEP97^CP110-GFP cap (middle) and uncapped in presence of CEP97^CP110 (right). (F–H) Average PF lengths (F), average curvatures (G), and average terminal curvatures (H) of PFs with nonzero length for samples imaged in the presence of 15 µM soluble tubulin. Shown are average values within each MT (dots), their mean and SD (error bars); ****P < 0.0001, *P < 0.05; ns—nonsignificant with one-way ANOVA followed by Tukey’s multiple comparison test; n is the number of MTs analyzed for each data set. Data distribution was assumed to be normal, but this was not formally tested. (I) Mean ± SEM of the curvature of PFs, aligned at their distal tips. The straight lines show the results of linear fitting. (J) Correlation between average curvature and average PF length per MT plus end. r, Pearson correlation coefficient; p, probability that the slope of the correlation is different from zero; and n showing number of MTs is mentioned in the figure.
Figure S3.
Figure S3.
Characterization of MT ends by cryo-ET. (A) Determination of MT polarity. For each MT: sum of slices containing the MT (top) and the same image Fourier filtered at origin (bottom). (B) Gallery of MT ends—plus and minus, capped by CEP97^CP110-GFP and uncapped, in the presence of 15 µM tubulin. Scale bar: 50 nm. (C) Sum of slices obtained from the tomograms rotated 90° to illustrate the end-on view of PF flares. Plus ends typically show clockwise twist pattern, while minus ends typically show counterclockwise pattern. The twist pattern is also observed for 13-PF MT ends.
Figure 3.
Figure 3.
CEP97^CP110 forms caps at the plus ends of GMPCPP-stabilized MTs. (A) Kymographs showing GMPCPP-stabilized seeds (magenta) in absence (top row) or presence (bottom row) of 3 µM soluble tubulin labelled with TMR-tubulin (gray). (B) Slices through denoised tomograms containing plus ends of MT seeds in the absence or presence of 80 nM CEP97^CP110-GFP in the absence of free tubulin. (C and D) Average PF lengths (C) and average curvatures (D) of PFs with nonzero length for GMPCPP seeds imaged in the presence of 0 or 3 µM soluble tubulin. Shown are average values for each GMPCPP seed (dots), their mean and SD (error bars); **P < 0.01; ns—nonsignificant with one-way ANOVA followed by Tukey’s multiple comparison test; and n is the number of GMPCPP seeds analyzed for each data set. Data distribution was assumed to be normal, but this was not formally tested.
Figure 4.
Figure 4.
Characterization of the CPAP–CP110 interaction. (A and B) Schemes of CP110 and CPAP illustrating the deletion mutants used in this study. “+,” interaction between CPAP and CP110; “−,” no interaction between CPAP and CP110, and “+/−,” weak interaction between CPAP and CP110. For CP110, CC1, and CC2 are the coiled-coil domains. For CPAP, CC1, and CC2 are coiled-coil domains; PN2–3, the tubulin-binding domain (Cormier et al., 2009); MBD, the MT-binding domain; and G-box, glycine-rich C-terminal domain forming an antiparallel β-sheet (Hatzopoulos et al., 2013). (C and D) Streptavidin pull-down assays with BioGFP-CP110 truncations as bait and full-length GFP-CPAP as prey. (E and F) Streptavidin pull-down assays with BioGFP-CPAP truncations as bait and full-length GFP-CP110 (E) or GFP-CP110 (581–991) (F) as prey. The assays in C–F were performed with extracts of HEK293T cells co-expressing the indicated constructs and BirA and analyzed by western blotting with anti-GFP antibodies. (G) SEC-MALS analysis of CPAP-CC1 (magenta line), CP110-CC2 (green line), and an equimolar mixture of CPAP-CC1 and CP110-CC2 (black line). (H) Scheme illustrating the mechanism for CPAP-CC1 and CP110-CC2 association. (I and J) CD spectra (I) recorded at 15°C and thermal-unfolding profiles (J) recorded by CD at 222 nm. Proteins and colors as in G. (K and L) SAXS analysis of the CPAP-CC1/CP110-CC2 heterodimer. (K) Solution X-ray scattering intensity over scattering angle from a 1:1 mixture (monomer equivalents) of CPAP-CC1 and CP110-CC2. The fit to the data yielding the interatomic distance distribution is shown with a black line. (L) Surface representation of the X-ray scattering volume of CPAP-CC1/CP110-CC2, at 32 ± 3 Å estimated precision, derived from averaging 22 particle models calculated by ab initio fit to the scattering data. Source data are available for this figure: SourceData F4.
Figure S4.
Figure S4.
Biophysical characterization of CPAP-CC1, CP110-CC2, and CPAP-CC1/CP110-CC2 complex. (A) SEC-MALS analyses of CPAP-CC1 (magenta lines) and CP110-CC2 (green lines) alone, and mixtures of CPAP-CC1 with CP110-CC2 at molar ratios of 1:1 (black line), 2:1 (light blue line), and 3:1 (dark blue line). (B) Coomassie-stained SDS-PAGE of the fractions F1–F5 indicated in panel A and collected from SEC-MALS runs obtained with mixtures of CPAP-CC1 and CP110-CC2. SDS-PAGE analysis of the elution peak fractions centered at around 14.3 ml (corresponding to the molecular weight of CPAP-CC1/CP110-CC2 heterodimer) of the various mixtures revealed equally intense protein bands corresponding to CPAP-CC1 and CP110-CC2. (C and D) SAXS analysis of the CP110-CC2 homodimer. (C) Solution X-ray scattering intensity over scattering angle from CP110-CC2. The fit to the data yielding the interatomic distance distribution is shown with a black line. (D) Surface representation of the X-ray scattering volume of CP110-CC2, at 30 ± 2 Å estimated precision, derived from averaging 22 particle models calculated by ab initio fit to the scattering data. (E) Table summarizing biophysical parameters of CPAP-CC1, CP110-CC2, and an equimolar mixture of CPAP-CC1 and CP110-CC2 obtained by SEC-MALS, CD, and SAXS. (F and G) CD spectrum (F) recorded at 15°C and thermal-unfolding profiles (G) recorded by CD at 222 nm of CP110-CC2 R656A/L659A (light green dashed lines). Source data are available for this figure: SourceData FS4.
Figure 5.
Figure 5.
Characterization of the mutations disrupting CP110–CPAP interaction. (A) Schematic representation of the domain organization of full-length human CPAP and CP110. The minimal regions CPAP and CP110 that interact with each other are indicated. The domain nomenclature is as in Fig. 4, A and B. (B and C) Chemical crosslinking followed by mass spectrometry of CPAP-CC1/CP110-CC2. (B) Schematic representations of parallel (left) and antiparallel (right) arrangements of CPAP-CC1 and CP110-CC2 chains in the CPAP-CC1/CP110-CC2 heterodimer. Predicted heptad repeats or H are indicated in each chain. Observed inter-protein crosslinks between residues of CPAP-CC1 and CP110-CC2 are indicated by thin lines. (C) Normalized inter-protein crosslinks observed between CPAP-CC1 and CP110-CC2 in the CPAP-CC1/CP110-CC2 heterodimer. The heptad a and d position residues are shown in bold and are underlined. The CPAP-CC1 and CP110-CC2 residues that were mutated in this study are highlighted with asterisks. (D) SEC-MALS analysis of CPAP-CC1 L149A/K150A (magenta dashed lines), CP110-CC2 (green solid lines), and an equimolar mixture of CPAP-CC1 L149A/K150A and CP110-CC2 (black solid lines). (E) Co-immunoprecipitation of CEP97^CP110-GFP as bait and CPAP-N-mCh WT or mutant as prey from HEK293T cells using anti-GFP antibodies. (F and G) Analytical SEC analysis of CPAP-CC1 and CP110-CC2 variants. (F) Analytical SEC analysis of CP110-CC2 (green solid line) and CP110-CC2 R656A/L659A (dark green–dashed line). (G) Analytical SEC analysis of CPAP-CC1 (magenta line), CP110-CC2 R656A/L659A (dark green–dashed line), and an equimolar mixture of CPAP-CC1/CP110-CC2 R656A/L659A (black solid line). Source data are available for this figure: SourceData F5.
Figure 6.
Figure 6.
The interaction between CPAP and CP110 promotes extremely slow and processive MT growth in vitro. (A) Scheme illustrating the domains of full-length human CPAP and the shorter versions called CPAP-NWT-mCh and CPAP-NMUT-mCh. CPAP-NWT includes the first 607 amino acids of CPAP followed by a leucine zipper for dimerization and a mCherry (mCh) fluorescent tag. PN2–3, tubulin-binding domain; MBD, MT-binding domain. Two substitution mutations L149A and K150A in CPAP-NMUT disrupt the interaction with CP110. (B) Still images and kymographs illustrating MT dynamics in the presence of CPAP-NWT-mCh and CPAP-NMUT-mCh; arrowheads indicate CPAP on the plus ends of dynamic MTs (gray). (C) Top plot: Mean ± SEM of intensity of the CPAP-NWT-mCh (n = 15 MTs) and CPAP-NMUT-mCh (n = 14 MTs) present on the MT plus end. Bottom plot: Catastrophe frequencies for CPAP-NWT-mCh (n = 151 MTs) and CPAP-NMUT-mCh (n = 129 MTs); nonsignificant (ns); P > 0.05, Mann–Whitney U test. (D) Kymographs showing slow and processive growth of MT plus end (gray) in presence of both CPAP-NWT-mCh (magenta, white open arrowhead indicates plus end accumulation of CPAP-NWT-mCh) and CEP97^CP110-GFP (green, white arrowhead indicates plus end accumulation of CEP97^CP110-GFP). CPAP-NWT is not visible as it is in the same channel as the bright GMPCPP-stabilized seed (magenta). (E) Kymographs representing MTs (gray) growing from the GMPCPP seed (magenta) in presence of CPAP-NMUT-mCh (magenta, white open arrowhead shows plus end localization) and CEP97^CP110-GFP (green, binding event indicated by a white arrowhead). (F) Bar plot with mean-SEM of the percentage of total time that CEP97^CP110 is either bound (green bars) or unbound (gray bars) to the MT plus end with CEP97^CP110 alone (n = 3 independent assays) or in combination with CPAP-NWT-mCh (n = 4 independent assays) or CPAP-NMUT-mCh (n = 3 independent assays). Nonsignificant (ns), P = 0.073, 0.156; **P = 0.0051, one-way ANOVA with Holm–Šídák’s multiple comparisons test. Normality tested using Shapiro–Wilk test; P = 0.88. (G) MT plus-end growth rates in the indicated conditions. Upper panel, mean + SD; bottom panel, a cumulative histogram showing % of the total time spent by MT plus end growing at different growth rates, with X axis in a log scale. n, number of growth events analyzed, is indicated in the figure. Nonsignificant (ns), P = 0.108; ***P = 0.0004; ****P < 0.0001, Kruskal–Wallis ANOVA with Dunn’s test for multiple comparisons. (H) MT plus-end growth rates for the samples 20 nM CEP97^CP110 alone, or in combination with 50 nM CPAP-NWT or CPAP-NMUT, also shown in panel G, but with the values for the events where CEP97^CP110 is present at the tip shown in green and the events where it is absent in gray. The bottom part of the plot shows magnified view for the growth rate values between 0 and 0.4 µm/min; n, number of growth events analyzed, is indicated in the figure.
Figure 7.
Figure 7.
Dynamics of CEP97^CP110 and CPAP on slowly growing MT plus ends. (A) Upper panel: Kymographs representing bleaching of CPAP-NWT-mCh (magenta) with a 561-nm laser and its quick recovery. Inset shows the bleaching moment with a white arrow. Bottom panel: Kymographs showing bleaching of both CEP97^CP110-GFP (green) and CPAP-NWT-mCh (magenta) with a 488-nm laser (white arrow) illustrating that CEP97^CP110-GFP does not recover and CPAP-NWT-mCh recovers slowly. (B) Upper plot: Mean + SD of the normalized intensity of CEP97^CP110-GFP (green line, n = 30) and CPAP-NWT-mCh (magenta line, n = 36) over time on slowly growing MT plus ends. Bottom plot: Comparison of the recovery CPAP-NWT-mCh alone (n = 8) and in the presence of CEP97^CP110-GFP (the latter data are the same as in the lot above). Black arrow marks the time point of photobleaching. (C) Scheme of flow-in assays. (D) Top: Kymographs representing a MT that was dynamic before flow in and switched to slow growth after the flow in of CEP97^CP110-GFP (green, white arrowhead) and CPAP-NWT-mCh (magenta, white open arrowhead). Bottom: Kymographs showing a MT plus end blocked by CEP97^CP110-GFP (white arrowhead) before and after the flow in. The moment of flow in is indicated by a black arrow in both kymographs.
Figure 8.
Figure 8.
Characterization of the effects of disrupting CPAP–CP110 interaction on centriole length regulation at interphase. (A) Scheme showing the generation of the inducible transgenic cell lines expressing either GFP-tagged WT full-length CPAP (CPAP-FLWT) or full-length CPAP with L149A/K150A mutation (CPAP-FLMUT). U2OS cells (Control) were used to integrate with the Tet repressor, a single FRT site, and the lacZ-Zeocin fusion gene by lentivirus to generate the Flp-In T-REx U2OS host cell line (Host). pcDNA5/FRT/TO vectors for doxycycline-inducible expression of GFP-CPAP-FLWT or GFP-CPAP-FLMUT were co-transfected together with Flp recombinase-encoding pOG44 vector into the Flp-In T-REx U2OS host cell line to induce their integration into the FRT site of the host cell genome in a Flp recombinase-dependent manner. The expression of GFP-CPAP-FLWT or GFP-CPAP-FLMUT was controlled by the inducible hybrid human cytomegalovirus (CMV)/Tet operator 2 (TetO2) promoter. The endogenous CPAP gene was knocked out using a CRISPR/Cas9–based approach. (B) Mean ± SD of the normalized CPAP levels based on western blots shown in Fig. S5 C (n = 3 trials). Cell lines used for quantification are shown in magenta, where cell line pairs 1 and 2 (p1 and p2, respectively) are highlighted. Nonsignificant (ns), P > 0.05 calculated using an unpaired two-tailed Mann–Whitney U test. (C and E) Immunofluorescence images acquired using Airyscan 2 confocal microscope of centrioles at G1/S (C) and G2/M (E) and stained for acetylated tubulin (blue), CP110 (green), and GFP-CPAP (magenta). (D) Median ± IQR of mother centriole length at G1/S measured from proximal end of centriole (determined by acetylated tubulin) to distal end (determined by the geometric center of CP110 signal) (scheme in panel F). n, number of analyzed centrioles: control cell line, n = 113; host, n = 105; CPAP-FLWT#3, n = 132; CPAP-FLWT#4, n = 131; CPAP-FLMUT#1,n = 84; CPAP-FLMUT#5,n = 170; CPAP-FLMUT#4,n = 81; nonsignificant (ns); and ****P < 0.001 calculated using Kruskal–Wallis ANOVA test. (F) Median ± IQR of centriole length at G2/M measured as in D. n, number of analyzed mother centrioles (MC) and daughter centrioles (DC): control cells, n = 80 MC, 75 DC; host, n = 72 MC, 59 DC; CPAP-FLWT#3,n = 67 MC, 69 DC; CPAP-FLWT#4, n = 64 MC, 57 DC; CPAP-FLMUT#1, n = 71 MC, 80 DC; CPAP-FLMUT#5, n = 78 MC, 79 DC; CPAP-FLMUT#4, n = 79 MC, 77 DC; nonsignificant (ns); and ****P < 0.001 calculated using Kruskal–Wallis ANOVA test.
Figure S5.
Figure S5.
Generation and characterization of stable cell lines expressing WT or mutant GFP-CPAP. (A) Sequencing results of the genomic mutation using gel-purified PCR products. (B) Western blots illustrating that the Flp-In–induced protein expression system has a low level of leaky expression, where CPAP endogenous (endo) is compared with CPAP overexpression (OE). (C) Western blots illustrating the CPAP expression levels in control, host, and different GFP-CPAP-FLWT and GFP-CPAP-FLMUT cells lines without doxycycline induction. (D) Immunofluorescence images taken with Airyscan 2 confocal microscope of centrioles of cells blocked for 24 h in mitosis with S-trityl-L-cysteine (STLC) and stained for the acetylated tubulin (blue), CP110 (green), and GFP-CPAP (magenta). (E) Median ± IQR of centriole length in mitotically blocked cells by STLC, measured as in Fig. 8 F. Number of analyzed mother centrioles (MC) and daughter centrioles (DC): control cells, n = 74 MC, 53 DC; host, n = 71 MC, 44 DC; CPAP-FLWT#3, n = 66 MC, 69 DC, and CPAP-FLMUT#1, n = 50 MC, 40 DC; and nonsignificant (ns) calculated using Kruskal–Wallis ANOVA test. (F and G) U-ExM images of centrioles from host, CPAP-FLWT#4, and CPAP-FLMUT#5 cells blocked in G1/S and stained for acetylated tubulin (blue) combined with CP110 (green) in F and CPAP (magenta) in G. (F) Normal centrioles from host and CPAP-FLWT#4 and incomplete centriole from CPAP-FLMUT#5. (G) Normal centrioles from host and CPAP-FLWT#4 and incomplete centriole from CPAP-FLMUT#5. Scale bar is corrected for ∼4.5 expansion factor. Source data are available for this figure: SourceData FS5.
Figure 9.
Figure 9.
Characterization of morphological defects of centrioles in cells with perturbed CPAP–CP110 interaction using U-ExM. (A and D–F) U-ExM images of centrioles from host, CPAP-FLWT#3, and CPAP-FLMUT#1 blocked for 24 h in G1/S and stained for acetylated tubulin (blue) combined with CP110 (green) in (A), GFP (magenta) in (D) top image, or CPAP (magenta) in (D) bottom image and (E and F). (A) Normal centrioles from host and CPAP-FLWT#3 and incomplete centriole from CPAP-FLMUT#1 (white arrow). (B) Mean + SD of centriole morphology at G1/S categorized in normal, short, incomplete, and elongated. For host, n = 159, CPAP-FLWT#3, n = 171, and CPAP-FLMUT#1, n = 251 centrioles; nonsignificant (ns); and *P = 0.019 and ****P < 0.0001 calculated using ordinary one-way ANOVA test. Normality tested using Shapiro–Wilk test; P = 0.77. (C) Mean + SD of CP110 cap on mother and daughter centrioles at G1/S categorized visually as present (clear, bright signal), low levels of (barely visible, low signal), and absent (no signal) CP110. For host, n = 101, CPAP-FLWT#3, n = 114, and CPAP-FLMUT#1, n = 160 centrioles; nonsignificant (ns); and calculated using ordinary one-way ANOVA test. Normality tested using Shapiro–Wilk test; P = 0.83. (D) Comparison between antibody against GFP (top) or CPAP (bottom) to localize GFP-CPAP (magenta). CPAP is localized to daughter centriole (white arrowhead), inner, proximal (white arrow), and distal cap of mother centriole (black arrowhead). (E) Normal centrioles from host and CPAP-FLWT#3 and incomplete centriole from CPAP-FLMUT#1 (white arrow). (F) Gallery of short or incomplete centrioles from CPAP-FLMUT#1. CPAP population on daughter centriole was unchanged (white arrowhead), and example nine shows minor defect in centriole shaft (white arrow). (G) Mean + SD of CPAP localization on the distal and proximal ends of the mother and daughter centrioles at G1/S, categorized visually as present (clear, bright signal), low levels of (barely visible, low signal), and absent (no signal). For host, n = 140, CPAP-FLWT#3, n = 132, and CPAP-FLMUT#1, n = 179; nonsignificant (ns); and *P = 0.031 or 0.012 and**P = 0.008 calculated using ordinary one-way ANOVA test. Normality tested using Shapiro–Wilk test; P = 0.13. Scale bar is corrected for ∼4.5 expansion factor.
Figure 10.
Figure 10.
Model for the combined action of CP110 and CPAP at MT plus ends. A model illustrating the molecular mechanism of slow and processive MT growth observed with CEP97^CP110 and CPAP. (A) CEP97^CP110 (green) binds to the luminal side of the MT plus end (gray) through a MT-binding domain present at the C terminus of the CP110 moiety of CEP97^CP110. By doing so, it inhibits incorporation of new tubulin dimers into the MT plus end. (B) CPAP binds on the outside of the MT wall with its MT-binding domain (MBD); with the two parts of its tubulin-binding domain PN2–3, SAC, and LID, it binds to the side and longitudinal interface of tubulin at the PF tip, inhibits catastrophes, and leads to a 4× reduction in the plus-end growth rate. New tubulin dimers incorporated into the MT are shown with asterisks. (C) CEP97^CP110 and CPAP bind to each other through their coiled-coil domains (CPAP-CC1/CP110-CC2), and CPAP overcomes growth inhibition imposed by CP110. The complex of the two proteins leads to slow and processive growth of the MT plus end. Disruption of CP110 homodimerization by CPAP might contribute to alleviation of CP110-driven MT growth inhibition.
Figure S6.
Figure S6.
Schematic flowchart illustrating the pipeline for 3D reconstruction, denoising, segmentation, and visualization of tomographic volumes, related to Materials and methods.

References

    1. Ahmad, S., Pecqueur L., Dreier B., Hamdane D., Aumont-Nicaise M., Plückthun A., Knossow M., and Gigant B.. 2016. Destabilizing an interacting motif strengthens the association of a designed ankyrin repeat protein with tubulin. Sci. Rep. 6:28922. 10.1038/srep28922 - DOI - PMC - PubMed
    1. Atherton, J., Jiang K., Stangier M.M., Luo Y., Hua S., Houben K., van Hooff J.J.E., Joseph A.P., Scarabelli G., Grant B.J., et al. . 2017. A structural model for microtubule minus-end recognition and protection by CAMSAP proteins. Nat. Struct. Mol. Biol. 24:931–943. 10.1038/nsmb.3483 - DOI - PMC - PubMed
    1. Aydogan, M.G., Hankins L.E., Steinacker T.L., Mofatteh M., Saurya S., Wainman A., Wong S.S., Lu X., Zhou F.Y., and Raff J.W.. 2022. Centriole distal-end proteins CP110 and Cep97 influence centriole cartwheel growth at the proximal end. J. Cell Sci. 135:jcs260015. 10.1242/jcs.260015 - DOI - PMC - PubMed
    1. Aydogan, M.G., Wainman A., Saurya S., Steinacker T.L., Caballe A., Novak Z.A., Baumbach J., Muschalik N., and Raff J.W.. 2018. A homeostatic clock sets daughter centriole size in flies. J. Cell Biol. 217:1233–1248. 10.1083/jcb.201801014 - DOI - PMC - PubMed
    1. Azimzadeh, J., and Marshall W.F.. 2010. Building the centriole. Curr. Biol. 20:R816–R825. 10.1016/j.cub.2010.08.010 - DOI - PMC - PubMed

LinkOut - more resources