. 2025 Jan 2;66(1):51.
doi: 10.1167/iovs.66.1.51.

ROCK Inhibitor Enhances Resilience Against Metabolic Stress Through Increasing Bioenergetic Capacity in Corneal Endothelial Cells

Affiliations

ROCK Inhibitor Enhances Resilience Against Metabolic Stress Through Increasing Bioenergetic Capacity in Corneal Endothelial Cells

Wei-Ting Ho et al. Invest Ophthalmol Vis Sci. .

Abstract

Purpose: To investigate the effect of Rho-associated protein kinase (ROCK) inhibitor Y27632 on bioenergetic capacity and resilience of corneal endothelial cells (CECs) under metabolic stress.

Methods: Bovine CECs (BCECs) were treated with Y27632 and subjected to bioenergetic profiling using the Seahorse XFp Analyzer. The effects on adenosine triphosphate (ATP) production through oxidative phosphorylation and glycolysis were measured. BCECs were also challenged with monensin to induce metabolic stress. Cell viability, apoptosis, intracellular sodium levels, and hexokinase localization were assessed using calcein AM assay, flow cytometry, fluorescence imaging, and immunostaining, respectively.

Results: Y27632 increased maximal ATP production rates via both oxidative phosphorylation and glycolysis, thereby expanding the overall bioenergetic capacity in BCECs. Under monensin-induced metabolic stress, ROCK inhibitor pretreatment significantly enhanced glycolytic ATP production and reduced apoptosis compared with untreated cells. Y27632 also facilitated sodium export by increasing Na/K-ATPase activity, as evidenced by lower intracellular sodium levels. Additionally, Y27632 promoted the translocation of hexokinase 2 to mitochondria under stress conditions, thereby enhancing glycolytic capacity. The effect of Y27632 on cell viability and sodium export was abrogated when cells were forced to rely on oxidative phosphorylation in galactose media, indicating that the protective effects of Y27632 are dependent on glycolytic ATP production under monensin stress.

Conclusions: ROCK inhibitor Y27632 enhances the bioenergetic capacity of BCECs, allowing the cells to better withstand metabolic stress by rapidly generating ATP to meet increased energy demands, maintaining ion homeostasis and reducing apoptosis.


Conflict of interest statement

Disclosure: W.-T. Ho, None; J.-S. Chang, None; C.-J. Lei, None; T.-C. Chen, None; J.-K. Wang, None; S.-W. Chang, None; M.-H. Yang, None; T.-S. Jou, None; I.-J. Wang, None

Figures

Figure 1.
Figure 1.
ROCK inhibition altered the bioenergetic capacity of BCECs. (A and B) Basal and maximal ATP production rate by mitochondrial OXPHOS (A, mitoATP) and glycolysis (B, glycoATP) in control cells or cells incubated with different concentrations of Y27632. (C) Bioenergetic capacity plot for BCECs generated as in (A and B). The shaded rectangle regions indicate maximum bioenergetic scope. Symbols indicate basal and maximal ATP production rates, separately. n = 5 in each group. Data are shown as mean ± SD. *P < 0.05, **P < 0.01, ***P < 0.001. ns, nonsignificant by analysis of variance with Tukey post hoc test. Data are representative of two independent experiments.
Figure 2.
Figure 2.
Monensin shifted the bioenergetics of BCECs towards using glycolysis as the major ATP production resource and ROCK inhibition further increased this trend. (A and B) ATP production rates by mitochondrial OXPHOS (A) and glycolysis (B) in control cells or cells incubated with 1 µM Y27632 that were further challenged with vehicle control or 10 µM monensin for 24 hours. n = 5 in each condition. (C) Total ATP production rates generated from (A) and (B). Data are shown as mean ± SD. *P < 0.05, **P < 0.01, ***P < 0.001. ns, nonsignificant by analysis of variance with Tukey post hoc test. Data are representative of two independent experiments.
Figure 3.
Figure 3.
ROCK inhibition mitigated monensin-induced BCEC apoptosis. (A) Representative phase-contrast images of control BCECs or cells incubated with 1 µM Y27632 that were further challenged with vehicle control or 10 µM monensin for 24 hours. Scale bar, 200 µm. (B) Cell viability relative to control group determined by calcein AM staining followed by measuring the fluorescence intensity. n = 4 in each condition. (C) The percentage of apoptotic cells determined by annexin V/PI staining followed by flow cytometry analysis. n = 5 in each condition. (D) Representative Western blotting results using cellular lysates prepared from the cells that were undergoing the same experiments as described in (A and B) by the indicated antibodies. (E and F) Relative levels of cleaved caspase 3 and PARP normalized by GAPDH. n = 5 independent experiments per condition. Data are shown as mean ± SD. *P < 0.05, **P < 0.01, ***P < 0.001. ns, nonsignificant by analysis of variance with Tukey post hoc test.
Figure 4.
Figure 4.
ROCK inhibition counteracted the effect of monensin on the accumulation of intracellular sodium. (A) Representative time-series fluorescence images of control or Y27632 (1 µM) pretreated BCECs with or without additional monensin stress (10 µM) stained with ION NaTRIUM Green. Scale bar, 100 µm. (B and C) Quantification of fluorescence intensity over time (B) and at the last time point (C). n = 3 in each condition. Data are shown as mean ± SD. **P < 0.01, ***P < 0.001, ns, nonsignificant by analysis of variance with Tukey post hoc test. Data are representative of three independent experiments.
Figure 5.
Figure 5.
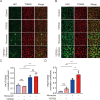
ROCK inhibitor enhanced the presence of HKs at the mitochondria. (A and B) BCECs pretreated with or without 1 µM Y27632 that were further treated with vehicle control or 10 µM monensin were subjected to double immunostaining with the anti-TOM20 and anti-HK1 (A) or anti-HK2 (B) antibodies. Scale bars, 50 µm. (C and D) Quantification of the extent of colocalization of HK1 (C) and HK2 (D) with TOM20 by Pearson's correlation coefficient. n = 4 in each condition. Data are shown as mean ± SD. **P < 0.01, ***P < 0.001. ns, nonsignificant by analysis of variance with Tukey post hoc test. Data are representative of two independent experiments.
Figure 6.
Figure 6.
Enhanced glycolysis is crucial for ROCK inhibitor to facilitate export of intracellular sodium and preserve BCEC viability under monensin stress. (A and B) BCECs pretreated with or without 1 µM Y27632 were further treated with vehicle control or 10 µM monensin in glucose (A) or galactose (B) media. Cells were stained with ION NaTRIUM Green and were subjected to time lapse imaging. The images taken at the last time point (16th hour) were shown. Scale bar, 100 µm. (C and D) Quantification of the fluorescent intensities of the images shown in (A) and (B). (E and F) Cell viability relative to control group as determined by calcein AM staining of BCECs under monensin stress in glucose (E) or galactose (F) media. n = 4 in each condition. Data are shown as mean ± SD. *P < 0.05, **P < 0.01, ***P < 0.001. ns, nonsignificant by analysis of variance with Tukey post hoc test. Data are representative of two independent experiments.
Figure 7.
Figure 7.
Schematic presentation of increased bioenergetic capacity stimulated by ROCK inhibitor in BCECs. The enhanced ATP production from both OXPHOS and glycolysis in BCECs enables the cells to better withstand monensin-induced stress by facilitating sodium ion export, thereby reducing apoptosis and promoting cell survival. ADP, adenosine diphosphate.

Similar articles

Cited by

  • Rock inhibitors in Alzheimer's disease.
    Zheng C, Xia W, Zhang J. Zheng C, et al. Front Aging. 2025 Mar 20;6:1547883. doi: 10.3389/fragi.2025.1547883. eCollection 2025. Front Aging. 2025. PMID: 40182055 Free PMC article. Review.

References

    1. Bonanno JA. Molecular mechanisms underlying the corneal endothelial pump. Exp Eye Res. 2012; 95: 2–7. - PMC - PubMed
    1. Joyce NC. Proliferative capacity of corneal endothelial cells. Exp Eye Res. 2012; 95: 16–23. - PMC - PubMed
    1. Huang B, Blanco G, Mercer RW, Fleming T, Pepose JS.. Human corneal endothelial cell expression of Na+, K+-adenosine triphosphatase isoforms. Arch Ophthalmol. 2003; 121: 840–845. - PubMed
    1. Edelhauser HF. The balance between corneal transparency and edema: the Proctor lecture. Invest Ophthalmol Vis Sci. 2006; 47: 1755–1767. - PubMed
    1. Methot SJ, Proulx S, Brunette I, Rochette PJ.. Chronology of cellular events related to mitochondrial burnout leading to cell death in Fuchs endothelial corneal dystrophy. Sci Rep. 2020; 10: 5811. - PMC - PubMed

LinkOut - more resources