. 2025 Jan 23;10(4):e180867.
doi: 10.1172/jci.insight.180867.

Aging and inflammation limit the induction of SARS-CoV-2-specific CD8+ T cell responses in severe COVID-19

Affiliations

Aging and inflammation limit the induction of SARS-CoV-2-specific CD8+ T cell responses in severe COVID-19

Gaëlle Autaa et al. JCI Insight. .

Abstract

CD8+ T cells are critical for immune protection against severe COVID-19 during acute infection with SARS-CoV-2. However, the induction of antiviral CD8+ T cell responses varies substantially among infected people, and a better understanding of the mechanisms that underlie such immune heterogeneity is required for pandemic preparedness and risk stratification. In this study, we analyzed SARS-CoV-2-specific CD4+ and CD8+ T cell responses in relation to age, clinical status, and inflammation among patients infected primarily during the initial wave of the pandemic in France or Japan. We found that age-related contraction of the naive lymphocyte pool and systemic inflammation were associated with suboptimal SARS-CoV-2-specific CD4+ and, even more evidently, CD8+ T cell immunity in patients with acute COVID-19. No such differences were observed for humoral immune responses targeting the spike protein of SARS-CoV-2. We also found that the proinflammatory cytokine IL-18, concentrations of which were significantly elevated among patients with severe disease, suppressed the de novo induction and memory recall of antigen-specific CD8+ T cells, including those directed against SARS-CoV-2. These results potentially explain the vulnerability of older adults to infections that elicit a profound inflammatory response, exemplified by acute COVID-19.

Keywords: Aging; COVID-19; Cellular immune response; Immunology; T cells.


Figures
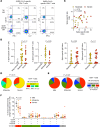
Figure 1
Figure 1. Characterization of SARS-CoV-2–specific CD4+ and CD8+ T cells and humoral immunity in patients with acute COVID-19.
(A) Representative flow cytometry plots showing the identification of SARS-CoV-2–specific CD4+ and CD8+ T cells after stimulation of PBMCs with overlapping spike peptides on day 4 after hospitalization. Plots are gated on CD4+ (left and center) or CD8+ T cells (right). (B) Frequencies of spike-specific CD4+ (CD154+) or CD8+ T cells (IFN-γ+) among uninfected controls and patients in the primary cohort grouped according to disease severity. Each dot represents 1 donor. Bars indicate median values. Significance was assessed using the Mann-Whitney U test. (C) Top: Correlation between SARS-CoV-2–specific IgM and IgG titers among patients in the primary cohort with moderate or severe disease. Each dot represents 1 donor. Significance was assessed using Spearman’s rank test. Bottom: SARS-CoV-2–specific IgM (left) and IgG titers (right) among patients in the primary cohort grouped according to disease severity. Each dot represents 1 donor. Bars indicate median values. Significance was assessed using the Mann-Whitney U test. (D) Functional profiles of spike-specific CD4+ T cells among patients in the primary cohort grouped according to disease severity (moderate disease, n = 23; severe disease, n = 14). Pie chart segments indicate the numbers of expressed functions color-matched to the key. Significance was assessed using a permutation test. (E) Functional profiles of spike-specific CD8+ T cells among patients in the secondary cohort grouped according to disease severity (mild disease, n = 9; moderate disease, n = 9; severe disease, n = 6). Pie chart segments indicate the numbers of expressed functions color-matched to the key. Significance was assessed using a permutation test. (F) Combinatorial analysis of spike-specific CD8+ T cell functionality among patients in the secondary cohort grouped according to disease severity. Each dot represents 1 donor. Bars indicate median values, and boxes indicate upper and lower quartile values. Significance was assessed using the Mann-Whitney U test.
Figure 2
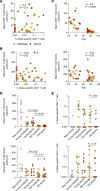
Figure 2. Impact of age and disease severity on SARS-CoV-2–specific CD4+ and CD8+ T cells in patients with acute COVID-19.
(A) Correlation between the absolute counts of naive CD8+ T cells and the frequencies of spike-specific CD8+ T cells among patients in the primary cohort with moderate or severe disease. Each dot represents 1 donor. Significance was assessed using Spearman’s rank test. (B) Correlation between the absolute counts of naive CD4+ T cells and the frequencies of spike-specific CD4+ T cells among patients in the primary cohort with moderate or severe disease. Each dot represents 1 donor. Significance was assessed using Spearman’s rank test. (C) Correlations between the absolute counts of naive CD8+ (top) or CD4+ T cells (bottom) and age among patients in the primary cohort with moderate or severe disease. Each dot represents 1 donor. Significance was assessed using Spearman’s rank test. (D) Absolute counts of naive CD8+ (top) or CD4+ T cells (bottom) among patients in the primary cohort grouped according to age and disease severity. Each dot represents 1 donor. Bars indicate median values. Significance was assessed using the Mann-Whitney U test. (E) Frequencies of spike-specific CD8+ (top) or CD4+ T cells (bottom) among patients in the primary cohort grouped according to age and disease severity. Each dot represents 1 donor. Bars indicate median values. Significance was assessed using the Mann-Whitney U test.
Figure 3
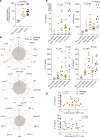
Figure 3. Cytokine profiles in patients with acute COVID-19.
(A) Effect of serum from uninfected controls or patients in the primary cohort with moderate or severe disease on the expansion of GIL-specific CD8+ T cells in vitro. Relative inhibition was calculated as the ratio of GIL/HLA-A*02:01 tetramer+ CD8+ T cell frequencies on day 12 after peptide stimulation of PBMCs from healthy HLA-A2+ donors in the absence/presence of serum. Each dot represents 1 experiment. Bars indicate median values. Significance was assessed using Wilcoxon’s signed-rank test. (B) Radar plots showing the mean plasma concentrations of proinflammatory cytokines (top), homeostatic cytokines (middle), and various chemokines (bottom) among patients in the primary cohort with moderate (n = 25) or severe disease (n = 20). Results are expressed relative to the corresponding values among uninfected controls (n = 10). *P < 0.01 by Mann-Whitney U test. (C) Plasma concentrations of IL-6, HGF, IP-10, and IL-18 among patients in the primary cohort grouped according to age and disease severity. Each dot represents 1 donor. Bars indicate median values. Significance was assessed using the Mann-Whitney U test. (D) Correlations between the frequencies of spike-specific CD8+ (top) or CD4+ T cells (bottom) and plasma concentrations of IL-18 among patients in the primary cohort with moderate or severe disease. Each dot represents 1 donor. Significance was assessed using Spearman’s rank test.
Figure 4
Figure 4. Impact of IL-18 on recall CD8+ T cell responses in vitro.
(A) Top: Representative flow cytometry plots showing the identification of GIL/HLA-A*02:01 tetramer+ CD8+ T cells on day 12 after peptide stimulation of PBMCs from healthy HLA-A2+ donors in the absence (left) or presence of IL-18 (right). Plots are gated on viable lymphocytes. Middle and bottom: Intracellular expression of granzyme B (middle) or perforin (bottom) among GIL/HLA-A*02:01 tetramer+ CD8+ T cells expanded in the absence (left) or presence of IL-18 (right). Plots are gated on CD8+ T cells. (B) Top: Frequencies of GIL-specific CD8+ T cells expanded in the absence or presence of IL-18, IL-6, IP-10, or HGF. Middle and bottom: Intracellular expression of granzyme B (middle) or perforin (bottom) among GIL/HLA-A*02:01 tetramer+ CD8+ T cells expanded in the absence or presence of IL-18, IL-6, IP-10, or HGF. Details as in A. Unstimulated controls are shown for reference. Each dot represents 1 donor. Bars indicate median values. Significance was assessed using Wilcoxon’s signed-rank test. (C) Top and middle: Representative flow cytometry plots showing the identification of YLQ/HLA-A*02:01 tetramer+ CD8+ T cells on day 12 after peptide stimulation of PBMCs from healthy HLA-A2+ donors in the absence (top) or presence of IL-18 (middle). Plots are gated on viable lymphocytes. Bottom: Frequencies of YLQ-specific CD8+ T cells expanded in the absence or presence of IL-18. Unstimulated controls are shown for reference. Each dot represents 1 donor. Significance was assessed using Wilcoxon’s signed-rank test.
Figure 5
Figure 5. Impact of IL-18 on de novo CD8+ T cell responses in vitro.
(A) Top: Representative flow cytometry plots showing the identification of ELA/HLA-A*02:01 tetramer+ CD8+ T cells on day 12 after peptide stimulation of PBMCs from healthy HLA-A2+ donors in the absence (left) or presence of IL-18 (right). Plots are gated on viable lymphocytes. Middle and bottom: Intracellular expression of granzyme B (middle) or perforin (bottom) among ELA/HLA-A*02:01 tetramer+ CD8+ T cells expanded in the absence (left) or presence of IL-18 (right). Plots are gated on CD8+ T cells. (B) Top: Frequencies of ELA-specific CD8+ T cells expanded in the absence or presence of IL-18, IL-6, IP-10, or HGF. Middle and bottom: Intracellular expression of granzyme B (middle) or perforin (bottom) among ELA/HLA-A*02:01 tetramer+ CD8+ T cells expanded in the absence or presence of IL-18, IL-6, IP-10, or HGF. Details as in A. Unstimulated controls are shown for reference. Each dot represents 1 donor. Bars indicate median values. Significance was assessed using Wilcoxon’s signed-rank test. (C) Replicate experiments performed in the presence of single-stranded RNA. Other details as in B.

References

    1. Buitrago-Garcia D, et al. Occurrence and transmission potential of asymptomatic and presymptomatic SARS-CoV-2 infections: a living systematic review and meta-analysis. PLoS Med. 2020;17(9):e1003346. doi: 10.1371/journal.pmed.1003346. - DOI - PMC - PubMed
    1. O’Driscoll M, et al. Age-specific mortality and immunity patterns of SARS-CoV-2. Nature. 2021;590(7844):140–145. doi: 10.1038/s41586-020-2918-0. - DOI - PubMed
    1. Ruan Q, et al. Clinical predictors of mortality due to COVID-19 based on an analysis of data of 150 patients from Wuhan, China. Intensive Care Med. 2020;46(5):846–848. doi: 10.1007/s00134-020-05991-x. - DOI - PMC - PubMed
    1. Ragab D, et al. The COVID-19 cytokine storm; what we know so far. Front Immunol. 2020;11:1446. doi: 10.3389/fimmu.2020.01446. - DOI - PMC - PubMed
    1. Liu Y, et al. Viral dynamics in mild and severe cases of COVID-19. Lancet Infect Dis. 2020;20(6):656–657. doi: 10.1016/S1473-3099(20)30232-2. - DOI - PMC - PubMed