. 2025 May 2;23(5):391-404.
doi: 10.1158/1541-7786.MCR-24-0309.

Exploiting YES1-Driven EGFR Expression Improves the Efficacy of EGFR Inhibitors

Affiliations

Exploiting YES1-Driven EGFR Expression Improves the Efficacy of EGFR Inhibitors

Leslie Cuellar-Vite et al. Mol Cancer Res. .

Abstract

EGFR is a highly expressed driver of many cancers, yet the utility of EGFR inhibitors (EGFRi) is limited to cancers that harbor sensitizing mutations in the EGFR gene because of dose-limiting toxicities. Rather than conventionally blocking the kinase activity of EGFR, we sought to reduce its transcription as an alternative approach to broaden the therapeutic window for EGFR inhibitors targeting wild-type (WT) or mutant EGFR. We found that YES1 is highly expressed in triple-negative breast cancer (TNBC) and drives cell growth by elevating EGFR levels. Mechanistically, YES1 stimulates EGFR expression by signaling to JNK and stabilizing the AP-1 transcription factor c-Jun. This effect extends beyond TNBC as YES1 also sustains EGFR expression in non-small cell lung cancer cells, including those that harbor the EGFR gatekeeper mutation T790M. The novel ability of YES1 to regulate the expression of WT and mutant EGFR mRNA and protein provides a potential therapeutic opportunity of utilizing YES1 blockade to broadly increase the efficacy of EGFR inhibitors. Indeed, we observed synergy within in vitro and in vivo models of TNBC and non-small cell lung cancer, even in the absence of EGFR-activating mutations. Together, these data provide a rationale for blocking YES1 activity as an approach for improving the efficacy of EGFR-targeting drugs in cancers that have generally been refractory to such inhibitors. Implications: YES1 sustains EGFR expression, revealing a therapeutic vulnerability for increasing the efficacy of EGFR inhibitors by lowering the threshold for efficacy in tumors driven by the WT or mutant receptor.


Conflict of interest statement

Conflict of Interest: The authors declare no potential conflicts of interest.

Figures

Figure 1:
Figure 1:
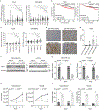
YES1 is upregulated in basal-like breast cancers and is essential for TNBC cell viability A. Gene expression of SFKs in basal-like breast cancers using The Cancer Genome Atlas (TCGA) PanCancer Atlas (n=171) and METABRIC (n=199) patient datasets. Dashed line indicates median expression. Significance of differences was calculated by comparing to YES1 mRNA expression. B. Kaplan-Meier plots for overall survival of patients with basal-like breast cancer (n=309) that have high or low expression of YES1 or LYN (n=number of patients in low and high cutoffs). Significance of differences between survival curves was calculated by the log-rank test. C. YES1 mRNA expression in each of the PAM50 breast cancer subtypes from the TCGA PanCancer Atlas (left) and METABRIC (right) datasets. Significance of differences was calculated by comparing to Basal-Like or Basal subtypes, respectively. D. Representative images (10x) of a cohort of 55 primary breast cancers grouped by receptor subtype that were immuno-stained for YES1 protein. ER, estrogen receptor; PR, progesterone receptor; HER2, human epidermal growth factor receptor. E. H-score of YES1 staining from samples in D. Each symbol represents a different sample. F. Western blots of YES1 and vinculin (control), following 3 and 5 days post-transient transfection with siYES1 or siNT (non-targeting). Molecular weight (kDa) markers are indicated. G. Quantitation of YES1 normalized to total protein from F. Each symbol is a technical replicate reflecting 3 biological replicates, each with technical duplicates. Bars represent averages of all technical replicates ± SD. H. Cell number determined by trypan blue-exclusion assay completed 1, 3, and 5 days after siRNA transfection. Symbols represent the average of 3 biological replicates ± SEM. I. 3 and 5 days after transfection, cells were stained with Hoechst and pyknotic nuclei quantified. Each symbol represents a biological replicate ± SEM. *, p <0.05.
Figure 2:
Figure 2:
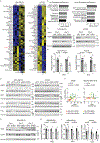
YES1 sustains EGFR expression in TNBC. A. Heat map of RPPA data showing altered proteins/phosphoproteins 3 days after transfection with non-targeting siRNA (siNT) or YES1 targeting siRNA (siYES1) in MDA-MB-231 and HCC38 cells. Colors indicate direction of protein expression followingYES1 silencing: yellow: up-regulated; blue: down-regulated. Red arrow indicates EGFR. B. WikiPathway enrichment analysis of proteins/phosphoproteins that were up- or down-regulated following YES1 silencing. C. Western blots of YES1, EGFR, and vinculin (control), 3- and 5-days post-transfection with siNT and siYES1. Select molecular weights (kDa) are shown. D. Quantitation of EGFR normalized to total protein in C. Each symbol represents a technical replicate; error bars are SD. E. Western blots of EGFR, YES1, SRC, LYN, FYN, and vinculin following transient transfection for 3 days with siNT, or siRNAs targeting SRC (siSRC), LYN (siLYN), FYN (siFYN), or YES1 (siYES1). Numbers below EGFR bands were calculated with EGFR normalized to total protein and then to siNT. F. Scatterplot comparing EGFR protein expression to YES1 mRNA levels in breast cancer cell lines using multiple datasets. Each dot represents a different cell line. Colors correspond to receptor-based breast cancer subtypes. G. Western blots of YES1, EGFR, and vinculin, 1-, 2-, and 3-days post-transfection with siNT or siYES1. H. Quantitation of EGFR normalized to total protein in G. I. qPCR analysis of EGFR, 1-, 2-, and 3-days post-transfection with siNT and siYES1. Each symbol is a technical replicate ± SD; Experiments were conducted as three biological replicates with technical duplicates. *, p <0.05.
Figure 3:
Figure 3:
YES1 regulates EGFR through JNK and c-Jun. A. Western blots of c-Jun and vinculin (control) 3 days after transient transfection with non-targeting (siNT) or YES1-targeting (siYES1) siRNAs. Select molecular weights (kDa) are indicated. B. Quantitation of c-Jun normalized to total protein in A. Each symbol is a technical replicate ± SD. Three biological replicates were performed, each with technical duplicates. C. Western blots of c-Jun, EGFR, and vinculin following 3 days of transfection with siNT or JUN-targeting siRNA (siJUN). D. Quantitation of EGFR normalized to total protein in C. E. EGFR mRNA expression, 3 days after transient transfection with siNT or siJUN. F. Western blots of EGFR, c-Jun, and YES1 following transient transfection with siNT or siYES1 in conjunction with expression vectors containing empty vector (EV) or c-Jun (c-Jun). G. Quantitation of EGFR normalized to total protein in F. Significance of differences was calculated by comparing to c-Jun siYES1 group. H. EGFR mRNA expression following conditions as in F. I. Relative growth was quantified using Incucyte measurements of cell confluency following conditions as in F. J. JUN mRNA expression 3 days after transient transfection with siNT or siYES1. K. Western blots of YES1, c-Jun, and vinculin in cells treated with or without MG-132 (5μM) for 6 hr on the third day after transient transfection with siNT or siYES1. L. Quantitation of c-Jun normalized to total protein in K. Significance of differences was calculated by comparing to to siYES1 + MG-132 treatment. M. Western blots of total and phosphorylated (S63) c-Jun, total and phosphorylated JNK (T183, Y185), and vinculin control. N. Quantitation of phosphorylated JNK normalized to total JNK1 in M. Significance of differences was assessed using a two-tailed Student’s t-test. *, p <0.05.
Figure 4:
Figure 4:
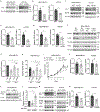
EGFR transcription is dependent on the YES1/JNK/c-Jun pathway in non-small cell lung cancer. A. Western blots for YES1, EGFR, c-Jun, and vinculin (control) following 3 days of transient transfection with non-targeting siRNA (siNT) or siYES1 in A549 or H-1975 cells. Select molecular weights (kDa) are shown. B. Quantitation of EGFR normalized to total protein from A. Each symbol is a technical replicate ± SD; three biological replicates with technical duplicates were performed. C. Quantitation of c-Jun normalized to total protein as in A. D. Western blots for EGFR, YES1, and vinculin following 3 days of transient transfection with siNT or siYES1 in empty vector (EV) or EGFR overexpressing A549 cells. * indicates endogenous EGFR expression E. Growth curves for A549 cells quantified by confluency (Incucyte) using the same conditions in D. Significance of differences was calculated by comparing to EGFR siYES1 group. F. EGFR mRNA expression following transient transfection of siRNAs for 1-, 2-, or 3- days. G. EGFR mRNA expression 3 days after transient transfection with siNT or siYES1 in H-1975 cells. H. Western blots for EGFR, c-Jun, YES1, and vinculin 3 days after transient transfection of A549 cells with siNT or siYES1 in conjunction with expression vectors that were either empty (EV) or express c-Jun. I. Quantitation of EGFR normalized to total protein from H. Significance of differences was calculated by comparing to c-Jun siYES1 group. J. EGFR mRNA expression following conditions in H. K. Growth curves for A549 cells quantified by confluency (Incucyte) using the same conditions as in H. L. JUN mRNA expression following silencing with siNT or siYES1 for 3 days. M. Western blots of phosphorylated JNK (T183, Y185), total JNK1, and vinculin. N. Quantitation of phosphorylated JNK normalized to JNK1 from M. *, p <0.05. ns, non-significant.
Figure 5:
Figure 5:
Selective YES1 inhibitors synergize with EGFR inhibitors, in vitro. A,B. Synergy maps of varying doses of YES1 selective inhibitors CH6953755 or NXP900 combined with varying doses of EGFR inhibitors gefitinib, afatinib, or osimertinib. Cells were treated for 5 days and relative cell growth was calculated. The highest single agent (HSA) model was utilized to determine synergy. Color represents the spectrum of drug combination response: dark blue = synergy and dark red = antagonism. C-F. MDA-MB-231 cells were treated with vehicle (Veh), gefitinib 10 μM (Gef), CH6953755 6 μM (CH), or the combination (1:1 ratio, Gef+CH) for 3 days. H-1975 cells were treated with Veh, Gef 6 μM, CH 8 μM, or the combination for 3 days. C. Western blot analysis of phosphorylated EGFR (Y845), total EGFR, phosphorylated SFKs (Y416), total YES1, and vinculin (control). D. Quantitation of EGFR normalized to total protein from C. E. Pyknotic nuclei were counted and expressed relative to total cells/field F. EdU-stained cells were quantified and expressed relative to total cells/field. Significance of differences was calculated by comparing to Gef + CH group. *, p <0.05. ns, non-significant.
Figure 6:
Figure 6:
Pharmacological inhibition of YES1 potentiates EGFR inhibitor response in TNBC and NSCLC xenografts. A. Waterfall plots of MDA-MB-231 tumors from mice treated with vehicle (Veh), gefitinib (Gef), CH6953755 (CH695), or the combination (ratio 1:1, Gef+CH) for 16 days. Each bar represents one tumor. Significance of differences was calculated by comparing to Gef + CH treatment. B. Waterfall plot of the TM00098 patient derived xenograft (PDX) model in NSG mice treated with Veh, Gef, CH695, or Gef+CH for 16 days. C. Waterfall plot of H-1975 tumors in NSG mice treated with Veh, osimertinib (Osi), NXP900 (NX), or the combination (ratio 1:1, Osi+NX) for 18 days. Significance of differences was calculated by comparing to Osi + NX. D. Western blot of phosphorylated SFKs (Y416), YES1, EGFR, and vinculin (control) from tumors treated in A. E. Quantitation of pSFK Y416 normalized to YES1, EGFR normalized to total protein, and c-Jun normalized to total protein. Each symbol is a different tumor. Each treatment group had at least 5 mice. Significance was assessed using a two-tailed student’s t-test. *, p <0.05.

References

    1. Thomas R, andWeihua Z (2019) Rethink of EGFR in Cancer With Its Kinase Independent Function on Board Front Oncol 9, 800 10.3389/fonc.2019.00800 - DOI - PMC - PubMed
    1. Morgillo F, Della Corte CM, Fasano M, andCiardiello F (2016) Mechanisms of resistance to EGFR-targeted drugs: lung cancer ESMO Open 1, e000060 10.1136/esmoopen-2016-000060 - DOI - PMC - PubMed
    1. Nagano T, Tachihara M, andNishimura Y (2018) Mechanism of Resistance to Epidermal Growth Factor Receptor-Tyrosine Kinase Inhibitors and a Potential Treatment Strategy Cells 7, 1–16 10.3390/cells7110212 - DOI - PMC - PubMed
    1. Tomasini P, Brosseau S, Mazieres J, Merlio JP, Beau-Faller M, Mosser J et al. (2017) EGFR tyrosine kinase inhibitors versus chemotherapy in EGFR wild-type pre-treated advanced nonsmall cell lung cancer in daily practice Eur Respir J 50, 1–12 10.1183/13993003.00514-2017 - DOI - PubMed
    1. Harrison PT, Vyse S, andHuang PH (2020) Rare epidermal growth factor receptor (EGFR) mutations in non-small cell lung cancer Semin Cancer Biol 61, 167–179 10.1016/j.semcancer.2019.09.015 - DOI - PMC - PubMed

MeSH terms