. 2025 Feb 25;44(2):115230.
doi: 10.1016/j.celrep.2025.115230. Epub 2025 Jan 22.

A cortico-subcortical loop for motor control via the pontine reticular formation

Affiliations

A cortico-subcortical loop for motor control via the pontine reticular formation

Emília Bősz et al. Cell Rep. .

Abstract

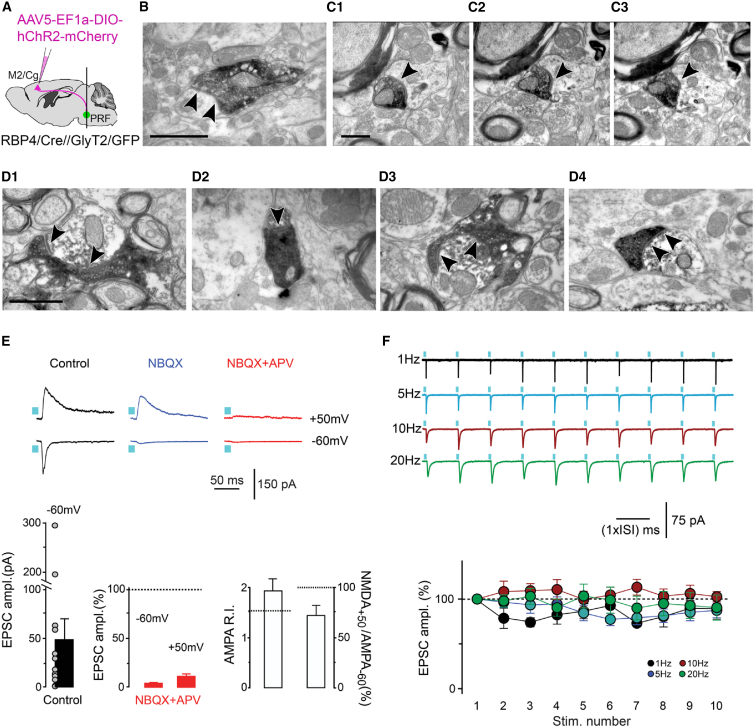
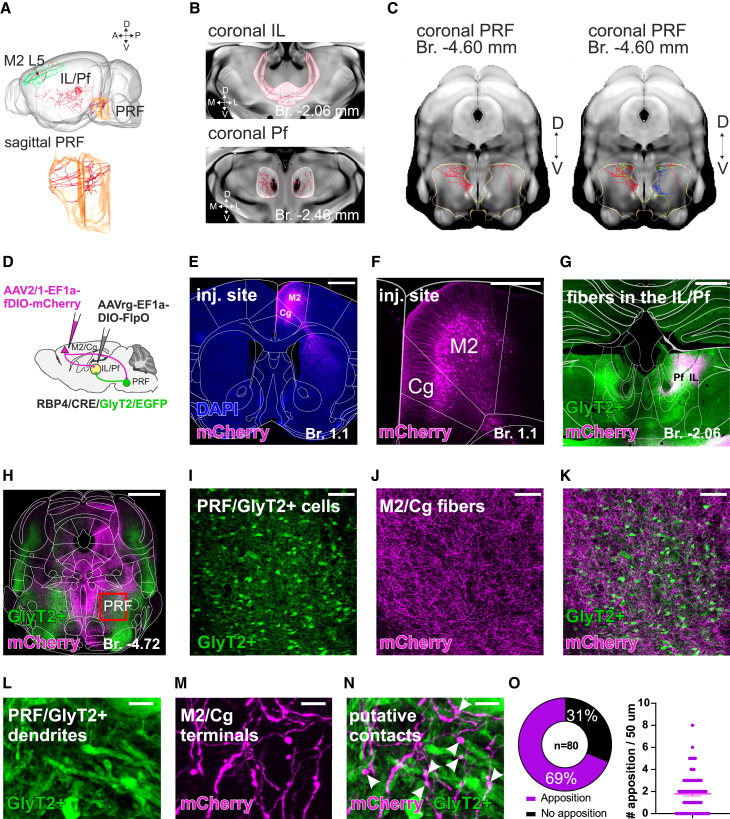
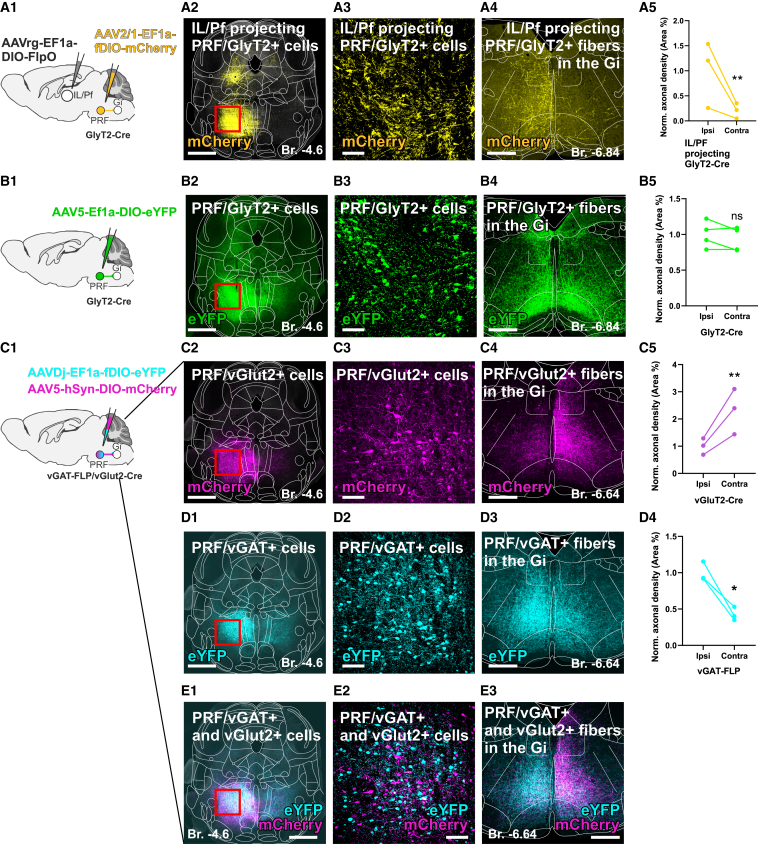
Movement and locomotion are controlled by large neuronal circuits like the cortex-basal ganglia (BG)-thalamus loop. Besides the inhibitory thalamic output, the BG directly control movement via specialized connections with the brainstem. Whether other parallel loops with similar logic exist is presently unclear. Here, we demonstrate that the secondary motor and cingulate cortices (M2/Cg) target and strongly control the activity of glycine transporter 2-positive (GlyT2+) cells in the pontine reticular formation (PRF). In turn, PRF/GlyT2+ cells project to and powerfully inhibit the intralaminar/parafascicular nuclei of the thalamus (IL/Pf). M2/Cg cells co-innervate PRF/GlyT2+ cells and the IL/Pf. Thalamus-projecting PRF/GlyT2+ cells target ipsilateral subcortical regions distinct from BG targets. Activation of the thalamus-projecting PRF/GlyT2+ cells leads to contralateral turning. These results demonstrate that the PRF is part of a cortico-subcortical loop that regulates motor activity parallel to BG circuits. The cortico-PRF-thalamus loop can control turning synergistically with the BG loops via distinct descending pathways.

Keywords: CP: Neuroscience; basal ganglia; brainstem; cingulate cortex; intralaminar thalamus; locomotion; motor cortex; motor system; parafascicular thalamus; pons; rotation; thalamus; turning.


Conflict of interest statement

Declaration of interests The authors declare no competing interests.

Figures

None
Graphical abstract
Figure 1
Figure 1
Cortical inputs to PRF/GlyT2+ cells (A) Scheme of anterograde tracing from the frontal cortical motor-related areas (M2/Cg) in the RBP4-Cre//GlyT2-eGFP mouse line (n = 9 mice). (B) Schematic view of the injection sites. (C) Low-power fluorescent micrographs of the cortical injection sites at three anteroposterior levels. (D) Schematic view of the M2/Cg fibers (magenta shade) and PRF/GlyT2+ cells (green dots). The black rectangle, the position of the micrographs, and heatmaps in (E)–(G). (E and F) Confocal micrographs (n = 5 mice) of the glycinergic cells (E) and anterogradely labeled M2/Cg cortical fibers (F) in the PRF glycinergic zone. (G) Fiber density heatmap showing the distribution of cortical fibers (gray shading) and PRF/GlyT2+ cells (green dots). Higher fiber density is indicated with light gray colors. (H1–3) Maximum intensity Z projections of average cortical fiber heatmaps (n = 3 animals) showing anterior M2/Cg inputs at three anteroposterior PRF levels extending from Br. −4.6 to Br. −4.84 (from the Paxinos atlas; 250 μm). (I) Maximum intensity Z projections of cortical fiber heatmaps (n = 3 animals) showing posterior M2/Cg inputs. (J) Quantitative analysis of the anterior M2/Cg fibers in the PRF at three coronal levels. Intensity levels represent fiber density values between 0 and 7, where 0 indicates no innervation and 7 presents the strongest innervation. (K) Proportion of innervation densities in the PRF after anterior (left) and posterior (right) M2/Cg injections at three coronal levels. (L) High-power confocal fluorescent image of anterogradely labeled M2/Cg fibers (magenta) and PRF/GlyT2+ neurons (60×, n = 5 mice). (M–O) High-power light microscopic image (n = 9 mice) of close apposition between M2/Cg fibers (black) and the somata (K), dendrites (L), or a spine (M) of PRF/GlyT2+ neurons. Inset in (M) displays the juxtacellularly labeled PRF/GlyT2+ cell; arrowheads, cortical inputs; asterisk, spine. Scale bars, 1 mm (C), 100 μm (E–I), 20 μm (J), 5 μm (M), 5 μm (K and L), 20 μm (inset).
Figure 2
Figure 2
Cortical afferents target PRF/GlyT2+ cells and evoke a glutamatergic synaptic response (A) Scheme of anterograde tracing from the M2/Cg in the RBP4-Cre//GlyT2-eGFP mouse line. (B and C) Electron micrographs of M2/Cg terminals (n = 44, dark precipitates) in the PRF-contacting mid-caliber dendrites. (C1–C3) Serial EM images of the same axon terminal. Black arrowheads, synapses. (D) Electron micrographs of M2/Cg terminals (DAB-Ni, dark, dense precipitate) establishing synapses on PRF/GlyT2+ dendrites (n = 9, D1, D3, D4, DAB, light precipitate) and spines (n = 1, D2). (E) Optogenetically evoked (blue squares) AMPA and NMDA receptor-mediated components of the EPSCs elicited by M2/Cg terminals in the PRF. Traces from one exemplary experiment are shown above. Top: AMPA and NMDA components (n = 16), control at −60 mV (n = 12; p = 0.002; Wilcoxon signed-rank test) and +50 mV (n = 12; p = 0.003; Wilcoxon signed-rank test). Below, the graphs represent the results from all the experiments. (F) Top: light-evoked EPSC-s displayed no significant depression during stimulation trains, at all tested frequencies ranging from 5 to 20 Hz. Bottom: 89.1% ± 11.5% (n = 6; p > 0.05; Wilcoxon signed-rank test), 87.3% ± 8.2% (n = 14; p = 0.03; Wilcoxon signed-rank test), 102.7% ± 5.7% (n = 10; p = 0.7; Wilcoxon signed-rank test), 90.5% ± 14.0% (n = 12; p = 0.1; Wilcoxon signed-rank test at 1, 5, 10, and 20 Hz, respectively. Source data are provided as a Source Data file. Data are represented as mean ± SE. Scale bars: 1,000 nm (B), 500 nm (C), 1,000 nm (D).
Figure 3
Figure 3
The effect of evoked cortical activity on PRF/GlyT2+ neurons (A) Scheme of the experiments (n = 10 mice: 7 mice with optogenetic 5-ms-long pulses at 1–20 mW [RBP4-Cre//GlyT2-eGFP], 3 mice with electrical 5 ms pulses at 1–2 mA [GlyT2-eGPF]). (B) Representative stimulus-evoked cortical field activity and evoked firing of a glycinergic PRF neuron. Small ticks on the top indicate laser stimulation. (C) Representative fluorescent micrograph of a recorded and labeled PRF/GlyT2+ neuron. Green, GlyT2-eGFP; red, neurobiotin; magenta, M2/Cg fibers. (D) Peristimulus time histograms (PSTH) of cortical stimulus-evoked firing in a representative PRF/GlyT2+ neuron at 1, 10, and 20 Hz stimulation frequencies. Response probability and median latency are visualized by boxplots. 1 Hz: probability 92.86%, 12.5 ms peak ± SEM; 10 Hz: probability: 92.86%, 12.6 ms peak ± SEM, 20 Hz: probability 84.06%, 14.5 ms peak ± SEM. (E) Population PSTHs of juxtacellularly recorded and labeled PRF/GlyT2+ neurons (n = 10) at 1, 10, and 20 Hz. 1 Hz median: 0.0136 s; 10 Hz median: 0.0127 s, 20 Hz median: 0.0132 s. (F) Median latency (left) 1 vs. 10 Hz, n.s. p = 0.22; 10 Hz vs. 20 Hz n.s. p = 0.3, Mood’s median test and response probability (right) 1 vs. 10 Hz, n.s. p = 0.59; 10 Hz vs. 20 Hz n.s. p = 0.65 Mood’s median test of the PRF/GlyT2+ neurons. p < 0.05, ∗∗p < 0.01, ∗∗∗p < 0.001; n.s., no significant difference. Source data are provided as a Source Data file. Scale bars, 20 μm (C).
Figure 4
Figure 4
Co-innervation of PRF and thalamus by M2/Cg L5 neurons (A) Reconstruction of a representative M2 L5 (AA0245) neuron from the Mouse Light Neuron Browser database which innervates both PRF and IL/Pf (top). Axon arbor of the representative M2 L5 neuron (AA0245) at the sagittal level in the PRF (bottom). (B) Axon arbor of the representative M2 L5 neuron (AA0245) in the IL (top) and Pf (bottom). (C) Axon arbor of the representative M2 L5 neuron (AA0245) (left in red) and of 4 L5 neurons in the PRF (right, red, yellow, blue, and green) that have 10 or more axonal endpoints in the PRF and also innervate IL/Pf with multiple endpoints. (D) Scheme of the viral tracing to label PRF collaterals of thalamus-projecting M2/Cg cells. (E) Low-power confocal micrograph of the cortical M2/Cg injection site. (F) High-power confocal fluorescent image of the thalamus-projecting M2 L5 neurons. (G) Merged confocal image of the labeled thalamus-projecting M2/Cg cortical fibers (magenta) and PRF/GlyT2+ fibers (green) in the thalamus. (H) Merged, low-power confocal image of the labeled thalamus-projecting M2/Cg cortical fibers (magenta) and PRF/GlyT2+ fibers (green) in the brainstem. (I–K) Confocal micrographs of the PRF/GlyT2+ cells (green, I), anterogradely labeled thalamus-projecting M2/Cg cortical fibers (magenta, J), and their merged image (K). (L–N) High-power confocal microscopic image of close apposition between the PRF/GlyT2+ dendrites (green, L) and thalamus-projecting M2/Cg fibers (magenta, M). Arrows, putative contacts in (N). (O) Percentage of innervated PRF/GlyT2+ dendrite (left) and the mean number of the close apposition per dendritic segment (right). Source data are provided as a Source Data file. Scale bars, 1 mm (E), 500 μm (F and G), 1 mm (H), 100 μm (I–K), 5 μm (L–N).
Figure 5
Figure 5
Inhibitory action and cortical innervation of thalamus-projecting PRF/GlyT2+ cells (A) Top: scheme of the juxtacellular recordings (n = 13 mice, n = 23 neurons). Bottom: post hoc identified IL/Pf neuron surrounded by GlyT2+ fibers. (B) Response of two representative IL/Pf thalamic neurons to optogenetic activation of PRF/GlyT2+ fibers (top, 5 s stimulation, without a tail pinch; bottom, 30 s stimulation with a tail pinch). Top: discriminated action potentials (AP), 5 s stimulation, without tail pinch. Bottom: instantaneous firing rate (blue line, laser ON), 30 s stimulation with a tail pinch. (C) Mean firing rate (MFR) of the recorded IL/Pf thalamic neurons before, during, and after the photoactivation PRF/GlyT2+ fibers (33 Hz, 5 ms pulse width, laser power 10 mW, 5–30 s duration). Strongly inhibited, (red circles, n = 19 cell), weakly inhibited (light blue circles, n = 4, see STAR Methods) and neurons responding with a post-stimulus gap (dark blue circle, n = 4) are indicated. No pinch (left) and pinch (right) conditions are shown separately. No pinch MFR before vs. stim p = 0.002; no pinch MFR stim vs. after p = 0.002, n = 10 cells; pinch before vs. stim p = 0.00012; pinch MFR stim vs. after p = 0.00085, n = 14 cells; Wilcoxon signed-rank test. (D) Scheme of the double conditional viral tracing to label cortical inputs to thalamus-projecting PRF/GlyT2+ cells. (E) Low-power confocal micrograph of the cortical injection site. (F and G) Merged confocal image of the M2/Cg cortical fibers (green) and PRF/GlyT2+ fibers (magenta) in the thalamus. The red rectangle in (F) indicates the position of the micrograph in (G). (H) Coronal, stereotactic image of the brainstem. The red rectangle indicates the position of the micrographs in (I)–(K). (I–K) Confocal micrographs of the anterogradely labeled M2/Cg cortical fibers (green, I), retrogradely labeled thalamus-projecting PRF/GlyT2+ cells (magenta, J), and their merged image (K). (L–N) High-power confocal microscopic image of the thalamus-projecting PRF/GlyT2+ dendrites (magenta, L) and M2/Cg fibers (magenta, M) and their putative contacts (N, arrowheads). (O) Percentage of innervated thalamus-projecting PRF/GlyT2+ dendrite (left) and mean number of the close apposition per dendritic segment (right). p < 0.05, ∗∗p < 0.01, ∗∗∗p < 0.001; n.s., no significant difference. Source data are provided as a Source Data file. Scale bars, 20 μm (A), 1 mm (E–G), 50 μm (I–K), 5 μm (L–N).
Figure 6
Figure 6
Rotational movements evoked by axonal vs. somatic photoactivation of PRF/GlyT2+ neurons (A) Experimental design of the photoactivation of thalamus-projecting PRF/GlyT2+ cells via their fibers in the thalamus (n = 7 fiber optic fibers). (B) Contralateral rotations (n = 7 fiber optics) displayed as mean rotation angle before, during, and after the stimulus periods following PRF/GlyT2+ fiber stimulation in Pf. The figure represents the average percentage of a full 360° circle per second (χ2 = 10.6, p = 0.005, Friedman test following Durbin-Conover post hoc, before vs. stim p < 0.001; stim vs. after p < 0.001). (C) Schematic view of post hoc identified 7 optic fiber positions for experimental animals in Pf. (D) Experimental design of the photoactivation of PRF/GlyT2+ somata in the PRF (n = 7 fiber optics). (E) Movement trajectory in one representative mouse displaying contralateral turning (mouse ID: 1). Non-stimulated period (left), stimulated period (right) at 5 mW in the PRF. (F) Comparison of the absolute values of the mean rotation angle before, during, and after the PRF stimulus periods in the 7 experimental mice (Friedman test following Durbin-Conover post hoc; 1 mW χ2 = 6, p = 0.050; before vs. stim p = 0.073; stim vs. after p = 0.012; 5 mW χ2 = 8.33, p = 0.016; before vs. stim p = 0.038; stim vs. after p < 0.001; 10 mW χ2 = 10.3, p = 0.006; before vs. stim p < 0.001; stim vs. after p = 0.014; 15 mW χ2 = 12.3, p = 0.002; before vs. stim p=<0.001; stim vs. after p = 0.004 5 mW, χ2 = 8.333, p = 0.012. (G) Lack of significant dose-response effect on rotation (Friedman test χ2 = 7, p = 0.072). (H) Contralateral (n = 4 animals, blueish shades) and ipsilateral (n = 3 animals, reddish shades) rotations following PRF/GlyT2 somatic stimulations. The color code of the animals is the same as in (F). (I) Schematic view of post hoc identified optic fiber position (n = 7) in PRF for the 7 experimental mice. Right, fiber optic positions inducing contralateral rotation; left, fiber optic positions inducing ipsilateral rotation. Same notation as in (G). p < 0.05, ∗∗p < 0.01, ∗∗∗p < 0.001; n.s., no significant difference. Source data are provided as a Source Data file.
Figure 7
Figure 7
Selective ipsilateral innervation of the gigantocellular nucleus by thalamus-projecting PRF/GlyT2+ cells (A) (A1) Experimental design to label thalamus-projecting PRF/GlyT2+ cells+ and their axons (n = 3 mice). (A2–3) Fluorescent micrograph about virus injection site in the PRF. The red rectangle on (A2) indicates the position of the micrograph in (A3). (A4) Ipsilateral projection of the thalamus-projecting PRF/GlyT2+ cells in the Gi (yellow). (A5) Quantification of ipsilateral and contralateral axonal projections of the thalamus-projecting PRF/GlyT2+ cells in the Gi in GlyT2-Cre mice (paired t test, t(2) = 22.07, p = 0.002, n = 3 mice). (B) (B1) Experimental design to label all PRF/GlyT2+ cells (n = 4 mice). (B2–3) Fluorescent micrograph about virus injection site in PRF. The red rectangle on (B2) indicates the position of the micrograph in (B3). (B4) Bilateral projection of the PRF/GlyT2+ cells in the Gi (green). (B5) Quantification of the ipsilateral vs. contralateral axonal projections from PRF/GlyT2+ cells within the Gi region in GlyT2-Cre mice (paired t test, t(3) = 1.462, p = 0.24, n = 4 mice). (C) (C1) Scheme of mixed viral injection into PRF in vGAT-Flp/vGlut2-Cre (n = 3 mice). (C2–3) Fluorescent micrograph about virus injection site in PRF. The red rectangle on C2 indicates the position of the C3 micrograph. (C4) Bilateral projection with contralateral dominance of PRF/vGlut2+ cells in the Gi (magenta). (C5) Quantification of ipsilateral and contralateral axonal projections from PRF/vGluT2+ cells within the Gi region in vGluT2-Cre/vGAT-FLP mice (paired t test, t(2) = 19.04, p = 0.0027, n = 3 mice). (D) (D1–2) Fluorescent micrograph about virus injection site in PRF. The red rectangle on (D1) indicates the position of the micrograph in (D2). (D3) Bilateral projection with ipsilateral dominance of PRF/vGAT+ cells in the Gi (cyan). (D4) Quantification of ipsilateral and contralateral axonal projections from PRF/vGAT2+ cells within the Gi region in vGluT2-Cre/vGAT-Flp mice (paired t test, t(2) = 5.61, p = 0.0303, n = 3 mice). (E) (E1–2) Fluorescent micrograph about virus injection site in PRF. The red rectangle on (E1) indicates the position of the micrograph in (E2). (E3) Merged image of PRF/vGAT+ (cyan) and PRF/vGlut2+ (magenta) fibers in the Gi. p < 0.05, ∗∗p < 0.01, ∗∗∗p < 0.001; n.s., no significant difference. Source data are provided as a Source Data file. Scale bars, 500 μm (A2, B2, C2, D1, E1), 100 μm (A3, B3, C3, D2, E2), 500 μm (A4, B4, C4, D3, E3).

References

    1. Leiras R., Cregg J.M., Kiehn O. Brainstem Circuits for Locomotion. Annu. Rev. Neurosci. 2022;45:63–85. doi: 10.1146/ANNUREV-NEURO-082321-025137. - DOI - PubMed
    1. Arber S., Costa R.M. Networking brainstem and basal ganglia circuits for movement. Nat. Rev. Neurosci. 2022;23:342–360. doi: 10.1038/s41583-022-00581-w. - DOI - PubMed
    1. Smith Y., Raju D.V., Pare J.F., Sidibe M. The thalamostriatal system: A highly specific network of the basal ganglia circuitry. Trends Neurosci. 2004;27:520–527. doi: 10.1016/j.tins.2004.07.004. - DOI - PubMed
    1. Cui G., Jun S.B., Jin X., Pham M.D., Vogel S.S., Lovinger D.M., Costa R.M. Concurrent activation of striatal direct and indirect pathways during action initiation. Nature. 2013;494:238–242. doi: 10.1038/nature11846. - DOI - PMC - PubMed
    1. Díaz-Hernández E., Contreras-López R., Sánchez-Fuentes A., Rodríguez-Sibrían L., Ramírez-Jarquín J.O., Tecuapetla F. The Thalamostriatal Projections Contribute to the Initiation and Execution of a Sequence of Movements. Neuron. 2018;100:739–752.e5. doi: 10.1016/j.neuron.2018.09.052. - DOI - PubMed

Publication types

Substances

LinkOut - more resources