. 2025 Jan 23;20(1):e0317710.
doi: 10.1371/journal.pone.0317710. eCollection 2025.

Construction of an lncRNA-mediated ceRNA network to investigate the inflammatory regulatory mechanisms of ischemic stroke

Affiliations

Construction of an lncRNA-mediated ceRNA network to investigate the inflammatory regulatory mechanisms of ischemic stroke

Meimei Xu et al. PLoS One. .

Abstract

Long non-coding RNAs (lncRNAs) are among the most abundant types of non-coding RNAs in the genome and exhibit particularly high expression levels in the brain, where they play crucial roles in various neurophysiological and neuropathological processes. Although ischemic stroke is a complex multifactorial disease, the involvement of brain-derived lncRNAs in its intricate regulatory networks remains inadequately understood. In this study, we established a cerebral ischemia-reperfusion injury model using middle cerebral artery occlusion (MCAO) in male Sprague-Dawley rats. High-throughput sequencing was performed to profile the expression of cortical lncRNAs post-stroke, with subsequent validation using RT-PCR and qRT-PCR. Among the 31,183 lncRNAs detected in the rat cerebral cortex, 551 were differentially expressed between the MCAO and sham-operated groups in the ipsilateral cortex (fold change ≥2.0, P < 0.05). An integrated analysis of the 20 most abundant and significantly differentially expressed lncRNAs (DELs) identified 25 core cytoplasmic DELs, which were used to construct an interaction network based on their targeting relationships. This led to the establishment of a comprehensive lncRNA-miRNA-mRNA regulatory network comprising 12 lncRNAs, 16 sponge miRNAs, and 191 target mRNAs. Gene Ontology (GO) and Kyoto Encyclopedia of Genes and Genomes (KEGG) pathway analyses revealed that differentially expressed mRNAs (DEmRNAs) were significantly enriched in stroke-related pathways. Our analysis predicted four key lncRNAs, four miRNAs, and eleven crucial mRNAs involved in post-transcriptional regulation through competing endogenous RNA (ceRNA) mechanisms. These molecules were shown to participate extensively in post-stroke processes, including angiogenesis, axonal regeneration, inflammatory responses, microglial activation, blood-brain barrier (BBB) disruption, apoptosis, autophagy, ferroptosis, and thrombocytopenia. These findings highlight the role of lncRNAs as multi-level regulators in the complex network of post-stroke mechanisms, providing novel insights into the pathophysiological processes of stroke.


Conflict of interest statement

The authors declare no conflicts of interest.

Figures

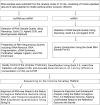
Fig 1
Fig 1. Construction of long non-coding RNA-mediated competing endogenous RNA network to investigate ischemic stroke.
Fig 2
Fig 2. Establishment and evaluation of the MCAO model of brain injury after ischemia‒reperfusion.
(A) Behavioral observation of sham-operated rats. (B) Behavioral observation of MCAO rats. (C) The Longa score assessment. (D) The quantification Quantification of the infarct area. (E) TTC-stained brain sections. The left image shows the sham group, and the right image illustrates the MCAO group, with the pale ischemic area visible in the right brain. The data are presented as the means ± SEMs and were analyzed using an independent sample t-test (**P < 0.01 vs. the sham group, n = 3).
Fig 3
Fig 3. High-throughput sequencing of lncRNAs, miRNAs, and mRNAs.
Fig 4
Fig 4. Expression analysis of lncRNAs between the MCAO and sham groups.
(A) The box plot illustrates the expression abundance of lncRNAs in each sample. The x-axis represents the samples, and the y-axis represents the logarithm value of normalized sample expression using the spliced reads per billion mapping (RPB) algorithm. (B) The volcano plot shows DELs between the two groups. The blue and red dots represent downregulated and upregulated DELs, respectively, in the MCAO group compared with the sham group (FDR < 0.01). (C) A clustering heatmap illustrates distinguishable expression profiles of lncRNAs. The colors from blue to red indicate an increase in relative lncRNA expression. T01–T05: MCAO group; T06–T10: sham group.
Fig 5
Fig 5. Identification of representative lncRNAs and validation of their expression.
(A) Agarose gel electrophoresis was used to determine the sizes of the lncRNA PCR products. The first well of the agarose gel contained the marker, while the subsequent wells contained the lncRNA samples. (B) qRT‒PCR was performed to confirm the expression of lncRNAs, the results of which were not significantly different. (C) qRT‒PCR was conducted to validate the upregulated expression of lncRNAs. (D) qRT‒PCR was performed to confirm the downregulated expression of lncRNAs. The data are presented as the mean ± SEM (n = 3). ns (no significant difference), *P < 0.05, **P < 0.01, ***P < 0.001 vs. the sham group, as determined by an independent sample t-test.
Fig 6
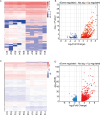
Fig 6. Identification of differentially expressed miRNAs and mRNAs.
(A) and (C):The heatmaps show differentially expressed miRNAs and mRNAs. S01–S05 and T01–T05 are samples from the MCAO group, whereas S06–S10 and T06–T10 are samples from the sham group. The color scale from blue to red indicates increasing expression levels. (B) and (D): The volcano plots compare the MCAO group to the sham group. The blue dots indicate downregulated miRNAs/mRNAs, the red dots indicate upregulated miRNAs/mRNAs, and the gray dots indicate no significant differential expression.
Fig 7
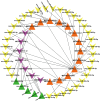
Fig 7. The lncRNA‒miRNA network.
The green nodes represent upregulated miRNAs, whereas the yellow nodes represent downregulated miRNAs. Similarly, orange nodes represent upregulated lncRNAs, and purple nodes represent downregulated lncRNAs compared with those in the sham group (p < 0.05). Each edge in the network indicates an interaction between two nodes.
Fig 8
Fig 8. The miRNA‒mRNA network.
The yellow nodes represent upregulated miRNAs, whereas the red nodes represent downregulated miRNAs. Similarly, green nodes represent upregulated mRNAs, and blue nodes represent downregulated mRNAs, all in comparison to the sham group (p < 0.05). Each edge in the network indicates an interaction between two nodes.
Fig 9
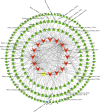
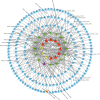
Fig 9. In the competitive endogenous RNA (ceRNA) network involving lncRNAs, miRNAs, and mRNAs, node colors indicate the expression status of different RNA types.
In the network visualization, red nodes represent upregulated lncRNAs, yellow nodes represent downregulated lncRNAs, purple nodes represent upregulated miRNAs, green nodes represent downregulated miRNAs, blue nodes represent upregulated mRNAs, and orange nodes represent downregulated mRNAs compared with the sham group (p < 0.05). Each edge in the network denotes an interaction between two nodes.
Fig 10
Fig 10. The PPI network and screening of the top 20 hub genes.
The genes marked in red represent the top 20 hub genes.
Fig 11
Fig 11. GO and KEGG pathway analyses of the DE-mRNAs.
(A-C) The top 10 enriched biological processes (BP), cellular components (CC), and molecular functions (MF) of the common differentially expressed messenger RNAs (DE-mRNAs). (D) The KEGG pathway analysis of the common DE-mRNAs. The color transition from blue to red indicates decreasing P values, indicating increasingly significant differences. The bar lengths, from short to long, represent an increasing number of enriched genes.
Fig 12
Fig 12. RT‒qPCR Validation of DE miRNAs and DE mRNAs.
(A) qPCR validation of the miRNA sequencing data. (B) qPCR validation of the mRNA sequencing data. The data are presented as the means±SEM (n = 3). * P < 0.05, ** P <0.01 and *** P <0.001; two-tailed paired t-test.
Fig 13
Fig 13. The key candidate lncRNAs in ischemia‒reperfusion injury and their inferred biological pathways.
The white columns list key DEGs, whereas the light gray and dark gray columns show miRNA and mRNA targets that play crucial roles in neural injury. The blue columns list the corresponding biological mechanisms confirmed in brain injury following ischemia‒reperfusion.

Similar articles

Cited by

References

    1. Diener HC, Hankey GJ. Primary and Secondary Prevention of Ischemic Stroke and Cerebral Hemorrhage: JACC Focus Seminar. J Am Coll Cardiol. 2020;75(15):1804–18. 10.1016/j.jacc.2019.12.072 - DOI - PubMed
    1. Esteller M. Non-coding RNAs in human disease. Nat Rev Genet. 2011;12(12):861–74. doi: 10.1038/nrg3074 - DOI - PubMed
    1. Fan J, Chen M, Cao S, Yao Q, Zhang X, Du S, et al.. Identification of a ferroptosis-related gene pair biomarker with immune infiltration landscapes in ischemic stroke: a bioinformatics-based comprehensive study. Bmc Genomics. 2022;23(1):59. doi: 10.1186/s12864-022-08295-0 - DOI - PMC - PubMed
    1. Zhang GL, Zhu ZH, Wang YZ. Neural stem cell transplantation therapy for brain ischemic stroke: Review and perspectives. World J Stem Cells. 2019;11(10):817–30. doi: 10.4252/wjsc.v11.i10.817 - DOI - PMC - PubMed
    1. Powers WJ, Rabinstein AA, Ackerson T, Adeoye OM, Bambakidis NC, Becker K, et al.. 2018 Guidelines for the Early Management of Patients With Acute Ischemic Stroke: A Guideline for Healthcare Professionals From the American Heart Association/American Stroke Association. Stroke. 2018;49(3):e46–110. doi: 10.1161/STR.0000000000000158 - DOI - PubMed

MeSH terms