. 2025 Jan 24;387(6732):eadn7277.
doi: 10.1126/science.adn7277. Epub 2025 Jan 24.

Lysosomal dysfunction and inflammatory sterol metabolism in pulmonary arterial hypertension

Affiliations

Lysosomal dysfunction and inflammatory sterol metabolism in pulmonary arterial hypertension

Lloyd D Harvey et al. Science. .

Abstract

Vascular inflammation regulates endothelial pathophenotypes, particularly in pulmonary arterial hypertension (PAH). Dysregulated lysosomal activity and cholesterol metabolism activate pathogenic inflammation, but their relevance to PAH is unclear. Nuclear receptor coactivator 7 (NCOA7) deficiency in endothelium produced an oxysterol and bile acid signature through lysosomal dysregulation, promoting endothelial pathophenotypes. This oxysterol signature overlapped with a plasma metabolite signature associated with human PAH mortality. Mice deficient for endothelial Ncoa7 or exposed to an inflammatory bile acid developed worsened PAH. Genetic predisposition to NCOA7 deficiency was driven by single-nucleotide polymorphism rs11154337, which alters endothelial immunoactivation and is associated with human PAH mortality. An NCOA7-activating agent reversed endothelial immunoactivation and rodent PAH. Thus, we established a genetic and metabolic paradigm that links lysosomal biology and oxysterol processes to endothelial inflammation and PAH.


Conflict of interest statement

S.Y.C. has served as a consultant for Merck, Janssen, and United Therapeutics. S.Y.C. is a director, officer, and shareholder in Synhale Therapeutics. S.Y.C. has held grants from Bayer and United Therapeutics. S.Y.C. and T.B. have filed patent applications regarding metabolism and next-generation therapeutics in pulmonary hypertension (US 10,925,869 B2, “Compositions and methods for treating pulmonary vascular disease”; PCT/US2015/029286, “Coordinate control of pathogenic signaling by the MIR-130-301 family in pulmonary hypertension and fibroproliferative diseases”; PCT/US2018/062013, “Compositions and methods for administering a YAP1/WWRT1 inhibiting composition and a GLS1 inhibiting composition”). S.Y.C., L.D.H., and I.B. have filed patent applications regarding the therapeutic targeting of NCOA7 (US 11,773,391 B2, “Therapeutic and diagnostic target for SARS-CoV-2 and COVID-19”; PCT/IB2023/055431, “Methods and compositions for treatment of inflammation and inflammatory conditions”). The other authors declare that they have no competing interests. M.J. is an employee of and holds equity in Sapient Bioanalytics for work unrelated to the current manuscript.

Figures

Fig. 1.
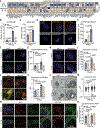
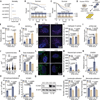
Fig. 1.. Convergent inflammatory regulation of NCOA7 across cellular, animal, and human instances of PAH.
(A) Transcriptomic analysis of human PAECs under control or IL-1β (n = 3 replicates per group). Z-score is indicated as positive in blue and negative in gold. Genes listed have a false discovery rate (FDR)–corrected P value < 0.05. (B) NCOA7short expression by means of RT-qPCR (n = 3 replicates per group). (C) NCOA7full expression by means of RT-qPCR (n = 3 replicates per group). (D) Immunofluorescent (IF) staining of NCOA7 (red with yellow arrowheads), CD31+ ECs (green), α-SMA+ smooth muscle cells (white), and 4′,6-diamidino-2-phenylindole (DAPI)–stained nuclei (blue) in pulmonary vessels of wild-type versus Il6 Tg+ mice. (E) Quantification of NCOA7 intensity in pulmonary vessels (n = 8 mice per group). (F) IF staining of NCOA7 (red with yellow arrowheads), CD31+ ECs (green), α-SMA+ smooth muscle cells (white), and DAPI-stained nuclei (blue) in pulmonary vessels of healthy human controls versus PAH patients. (G) Quantification of NCOA7 intensity in pulmonary vessels (n = 6 to 7 patients per group). (H) NCOA7 expression in ECs identified by means of single-cell RNA-sequencing from lungs of healthy human controls or PAH patients (n > 3 patients per group). (I) NCOA7 expression in fibroblasts identified by means of single-cell RNA-sequencing from lungs of healthy human controls or PAH patients (n > 3 patients per group). (J) NCOA7 expression in smooth muscle cells identified by means of single-cell RNA-sequencing from lungs of healthy human controls or PAH patients (n > 3 patients per group). Cells were identified as expressing NCOA7 if the transformed expression value was >0.2. (K) NCOA7short expression under RNA interference (RNAi) against RELA (n = 3 replicates per group). Two-way ANOVA. (L) NCOA7full expression under RNAi against RELA (n = 3 replicates per group). Two-way ANOVA. (M) ChIP-qPCR against p65/RelA binding to full- and short-length promoter regions (n =3 replicates per group). All data were analyzed by means of Student’s t test unless otherwise specified and presented as mean ± SD.
Fig. 2.
Fig. 2.. NCOA7 deficiency results in lysosomal dysfunction and lipid accumulation under proinflammatory conditions.
(A) Transcriptomic analysis of PAECs under IL-1β subjected to RNAi against control or NCOA7 (n = 3 replicates per group). Z-score is indicated as positive in blue and negative in gold. Identified lysosomal genes have an FDR-corrected P value < 0.05. (B) Expression of ATP6V1B2 under siNC or siNCOA7 by means of RT-qPCR (n = 3 replicates per group). (C) Expression of ATP6V1B2 with lentiviral delivery of control [lentiviral green fluorescent protein (LV-GFP)], NCOA7short, or NCOA7full isoforms (n = 3 replicates per group). Data analyzed by means of one-way ANOVA. (D) Association of the V-ATPase subunit ATP6V1B2 with NCOA7 measured by means of proximity ligation assay (orange). (Bottom) Control images of ATP6V1B2, NCOA7, or neither antibody. (Top) Dual incubation of ATP6V1B2 and NCOA7 antibodies with lentiviral transduction of GFP control, NCOA7short, or NCOA7full. (E) Quantification of amplified signal per cell (n =5 cells per group). Data were analyzed by means of one-way ANOVA. (F) LysoLive probe (green) reflecting β-galactosidase activity and thus lysosomal acidification. (G) Quantified as fluorescence per cell (n = 10 cells per group). (H) Silicone rhodamine (SiR)–Lysosome dye targeting active cathepsin D (purple) and indicating low lysosomal pH. (I) Quantified as fluorescence per cell (n = 10 cells per group). (J) Live-cell confocal microscopy of lysosomes (LysoTracker Deep Red) and lysosomal acidification (LysoSensor Green DND-189). (K) Median fluorescence intensity (MFI) ratio of LysoSensor Yellow/Blue DND-160 dye by means of flow cytometry indicating lysosomal acidification (n = 3 replicates per group). (L) Representative images of lysosomal size in transmission electron micrographs. Yellow arrowheads indicate lamellar-like inclusions reflecting lipid accumulation within lysosomes. (M) Quantification of lysosomal area (n = 20 electron micrographs per group). (N) IF staining of colocalization (yellow) of neutral sterols (BOPIDY in green) and acidic lysosomes (LysoTracker in red). (O) Colocalization was measured using EzColocalization and plotted as Pearson’s correlation coefficient (n = 15 cells per group). All data were analyzed by means of two-way ANOVA unless otherwise specified and presented as mean ± SD.
Fig. 3.
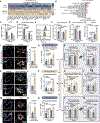
Fig. 3.. NCOA7 deficiency reprograms sterol metabolism to up-regulate oxysterols and bile acids.
(A) Transcriptomic analysis of PAECs under IL-1β subjected to RNAi against control or NCOA7 (n = 3 replicates per group). Z-score is indicated as positive in blue and negative in gold. Identified cholesterol metabolism genes have an FDR-corrected P value < 0.05. (B) Gene set enrichment analysis of top 15 pathways by FDR-adjusted P value with a majority related to sterol metabolism and homeostasis (indicated with red arrows). (C) Expression of LDLR under IL-1β subjected to RNAi against control or NCOA7 (n = 3 replicates per group). (D) Fluorescence intensity of tagged NBD-cholesterol uptake (n = 3 replicates per group). (E) Flow cytometric plot of fluorescently tagged nitrobenzoxadiazole (NBD)–cholesterol uptake. (F) Total cholesterol content under IL-1β subjected to RNAi against control or NCOA7 (n = 3 replicates per group). (G) Total cholesterol content under IL-1β subjected to lentiviral overexpression of GFP, NCOA7short, or NCOA7full. Data analyzed by means of one-way ANOVA (n = 6 replicates per group). (H) Expression of CH25H in PAECs under IL-1β subjected to RNAi against control or NCOA7 by means of RT-qPCR (n = 3 replicates per group). (I) IF staining for CH25H (red with yellow arrowheads), CD31+ ECs (green), α-SMA+ smooth muscle cells (white), and DAPI-stained nuclei (blue) in the pulmonary vessels of wild-type versus Il6 Tg+ mice. (J) Quantification of CH25H in pulmonary vessels (n = 8 mice per group). Student’s t test. (K) IF staining for CH25H (red with yellow arrowheads), CD31+ ECs (green), α-SMA+ smooth muscle cells (white), and DAPI-stained nuclei (blue) in the pulmonary vessels of control versus monocrotaline rats. (L) Quantification of CH25H in pulmonary vessels (n = 5 rats per group). Student’s t test. (M) IF staining for CH25H (red with yellow arrowheads), CD31+ ECs (green), α-SMA+ smooth muscle cells (white), and DAPI-stained nuclei (blue) in the pulmonary vessels of healthy human controls versus PAH patients. (N) Quantification of CH25H in pulmonary vessels (n = 6 to 7 patients per group). Student’s t test. (O) Targeted quantification of 25-hydroxycholesterol by means of LC-MS (n = 5 replicates per group). (P) Targeted quantification of 7-hydroxycholesterol by means of LC-MS (n = 5 replicates per group). (Q) Targeted quantification of 27-hydroxycholesterol by means of LC-MS (n =5 replicates per group). (R) Unbiased bile acid quantification of 5-cholesten-3β−7α−25-triol by means of LC-MS (n = 4 to 6 replicates per group). (S) Unbiased bile acid quantification of 5α-cholestane-3α,7α,12α-triol by means of LC-MS (n = 4 to 6 replicates per group). (T) Unbiased bile acid quantification of 5α-cholestane-3α,7α,12α,24,25-pentol by means of LC-MS (n = 4 to 6 replicates per group). (U) Unbiased bile acid quantification of 3α,7α,12α-trihydroxy-5β−24E-cholesten-26-oic acid by means of LC-MS (n = 4 to 6 replicates per group). (V) Unbiased bile acid quantification of 3β,7α-dihydroxy-5-cholestenoate by means of LC-MS (n = 4 to 6 replicates per group). (W) Unbiased bile acid quantification of 7α-hydroxy-3-oxo-4-cholestenoic acid (7HOCA) by means of LC-MS (n = 4 to 6 replicates per group). Metabolites are organized by proposed pathways in the shaded boxes. Black arrows indicate proposed sequential metabolite pathways. All data were analyzed by means of two-way ANOVA unless otherwise specified and presented as mean ± SD.
Fig. 4.
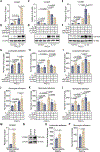
Fig. 4.. The NCOA7-CH25H axis drives pulmonary endothelial immunoactivation.
(A) VCAM1 expression by means of RT-qPCR under RNAi against NCOA7 (n = 3 replicates per group). (B) VCAM1 expression by menas of immunoblot under RNAi against NCOA7 (n = 3 replicates per group). (C) VCAM1 expression by means of RT-qPCR under lentiviral delivery of NCOA7short or NCOA7full (n = 3 replicates per group). (D) VCAM1 expression by means of immunoblot under lentiviral delivery of NCOA7short or NCOA7full (n = 3 replicates per group). (E) VCAM1 expression by means of RT-qPCR under RNAi against NCOA7 and CH25H (n = 3 replicates per group). (F) VCAM1 expression by means ofimmunoblot under RNAi against NCOA7 and CH25H (n = 3 replicates per group). (G) Leukocyte adhesion under RNAi against NCOA7 (n = 6 replicates per group). (H) Leukocyte adhesion under lentiviral delivery of NCOA7short or NCOA7full (n = 6 replicates per group). (I) Leukocyte adhesion under RNAi against NCOA7 and CH25H (n = 6 replicates per group). (J) Monocyte adhesion under RNAi against NCOA7 (n = 6 replicates per group). (K) Monocyte adhesion under lentiviral delivery of NCOA7short or NCOA7full (n = 6 replicates per group). (L) Monocyte adhesion under RNAi against NCOA7 and CH25H (n = 6 replicates per group). (M) VCAM1 expression by means of RT-qPCR under control (ethanol) versus 7HOCA (50 μM) for 24 hours (n = 3 replicates per group; Student’s t test). (N) VCAM1 expression by means of immunoblot under control (ethanol) versus 7HOCA (50 μM) for 24 hours (n = 3 replicates per group; Student’s t test). (O) Leukocyte adhesion in 7HOCA-treated PAECs compared with ethanol controls (n = 6 replicates per group; Student’s t test). (P) Monocyte adhesion in 7HOCA-treated PAECs compared with ethanol controls (n = 6 replicates per group; Student’s t test). All data were analyzed by means of two-way ANOVA unless otherwise specified and presented as mean ± SD.
Fig. 5.
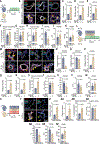
Fig. 5.. Genetic loss of Ncoa7 and the orotracheal delivery of 7HOCA worsens PAH in vivo.
(A) Ncoa7-null mice crossed onto the Il6 Tg+ PAH model. (B) Pulmonary arterioles from Il6 Tg+ versus Ncoa7/ × Il6 Tg+ mice stained for a target protein (CH25H, VCAM1, or CD11b; red with yellow arrowheads), the endothelial layer (CD31; green), the smooth muscle layer (α-SMA; white), and nuclear counterstain (DAPI; blue). (C to F) Quantification of (C) CH25H relative intensity, (D) VCAM1 relative intensity, (E) CD11b+ cells, and (F) vessel remodeling by means of percent muscularization in the pulmonary arterioles of Il6 Tg+ versus Ncoa7/ × Il6 Tg+ mice (n = 8 mice per group). (G) 7HOCA fold change, (H) Fulton’s Index, (I) RVFAC, (J) TAPSE, and (K) RVSP of Il6 Tg+ versus Ncoa7−/− × Il6 Tg+ mice (n =6 to 10 mice per group). (L) Il6 Tg+ mice were serially injected in the tail vein with either 7C1 nanoparticle encapsulated mouse siRNA against negative control or Ncoa7 (1 mg/kg) starting at 10 weeks of age every 5 days for a total of five doses and were euthanized at 16 weeks. (M) Pulmonary arterioles from siNC:7C1 Il6 Tg+ versus siNCOA7:7C1 Il6 Tg+ mice stained for a target protein (NCOA7, CH25H, VCAM1, or CD11b; red with yellow arrowheads), the endothelial layer (CD31; green), the smooth muscle layer (α-SMA; white), and nuclear counterstain (DAPI; blue). (N to S) Quantification of the relative intensity of (N) NCOA7 in endothelium, (O) NCOA7 in smooth muscle cells, (P) CH25H, (Q) VCAM1, (R) the number of CD11b+ cells per vessel, or (S) the degree of vessel muscularization defined by α-SMA layer thickness to total vessel diameter. (n =6 mice per group). (T) Fulton’s Index, (U) RVFAC, (V) TAPSE, and (W) RVSP of 7C1:siNc Il6 Tg+ versus 7C1:siNcoa7 Il6 Tg+ mice (n =9 to 18 mice per group). (X) Mice received orotracheal delivery of either PBS or 7HOCA (10 mg/kg) for 4 weeks under hypoxic (10% O2) conditions and were euthanized at 16 weeks. (Y) Pulmonary arterioles from PBS versus 7HOCA mice stained for a target protein (VCAM1, or CD11b; red with yellow arrowheads), the endothelial layer (CD31; green), the smooth muscle layer (α-SMA; white), and nuclear counterstain (DAPI; blue). (Z to AB) Quantification of the relative intensity of (Z) VCAM1, (AA) the number of CD11b+ cells per vessel, or (AB) the degree of vessel muscularization defined by α-SMA layer thickness to total vessel diameter (n = 4 mice per group). (AC) Fulton’s Index, (AD) RVFAC, (AE) TAPSE, and (AF) RVSP of mice receiving orotracheal PBS or 7HOCA (n = 3 to 7 mice per group). All data were analyzed by means of Student’s t test unless otherwise specified and presented as mean ± SD.
Fig. 6.
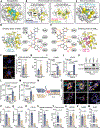
Fig. 6.. The G allele of SNP rs11154337 prevents lysosomal lipid accumulation and attenuates oxysterol-mediated immunoactivation in iPSC-ECs.
(A) Metabolites identified in NCOA7-deficit PAECs or in the plasma of Ncoa7-deficient mice individually were associated with higher mortality in PAH patients in the UPMC-a cohort (n = 116 patients; Cox regression with multivariate adjustment; P value cutoff < 0.01). (B and C) Allelic variants of SNP rs11154337 and their clinical readouts of 6-min walk distance (6MWD) and survival in PAH patients in the UPMC-b cohort (n = 93 patients) and STRIDE+ cohort (n = 630 patients). (D) Schematic of iPSC-EC production. (E) NCOA7short and (F) NCOA7full expression by means of RT-qPCR in iPSC-ECs under IL-1β (n = 3 replicates per group). (G) IF staining with SiR-Lysosome dye against active cathepsin D and (H) quantification of fluorescence in iPSC-ECs under control or IL-1β (purple; n = 10 cells per group). (I) ATP6V1B2 expression by means of RT-qPCR in iPSC-ECs under control or IL-1β (n = 3 replicates per group). (J) Transmission electron micrograph quantification of lysosomal area in iPSC-ECs under control or IL-1β. (K) Total cholesterol content as measured by means of relative luminescence in iPSC-ECs under control or IL-1β (n =6 replicates per group). (L) IF staining with BODIPY dye against neutral lipids and (M) quantification of fluorescence in iPSC-ECs under control or IL-1β (green; n = 10 cells per group). (N) CH25H expression by means of RT-qPCR in iPSC-ECs under control or IL-1β (n = 3 replicates per group). (O) Targeted 25HC quantification by means of LC-MS in iPSC-ECs under control or IL-1β (n =5 replicates per group). (P) VCAM1 expression by means of RT-qPCR or (Q) immunoblot in iPSC-ECs under control or IL-1β (n = 3 replicates per group). (R) Leukocyte and (S) monocyte adhesion to iPSC-EC monolayer under control or IL-1β (n =6 replicates per group). All data were analyzed by means of two-way ANOVA unless otherwise specified and presented as mean ± SD.
Fig. 7.
Fig. 7.. Computational modeling identifies 958ami as an NCOA7 activator that abrogates endothelial immunoactivation and PAH.
(A to C) Computational protocol for identifying small-molecule modulators of NCOA7, composed of three major components: (A) druggability simulations, (B) pharmacophore modeling, and (C) virtual screening. (D and E) Refinement of the identified compound 958 after molecular dynamics simulations into its analog 958ami. Interactions between compound atoms and NCOA7 residues are shown in two dimensions. Stronger interactions are indicated with orange dashed lines, and weaker interactions are indicated with gray dashed lines. Orange solid lines are strong or persistent interactions with more than 0.3 μs cumulative duration per interaction over 0.6 μs total simulations. (F) Association of the V-ATPase subunit ATP6V1B2 with NCOA7 measured by means of proximity ligation assay (orange). The images demonstrate dual incubation of ATP6V1B2 and NCOA7 antibodies with DMSO or 958ami (20 μM). (G) Quantification of amplified signal per cell (n = 15 cells per group). (H) Lysosomal pH assessed by means of LysoSensor Green DND-189, and immunofluorescence intensity quantified per cell (n = 20 cells per group). (I) CH25H expression by means of RT-qPCR (n = 3 replicates per group; two-way ANOVA). (J) Expression of VCAM1 by means of RT-qPCR and (K) immunoblot in PAECs treated with DMSO versus 958ami (n = 3 replicates per group; two-way ANOVA). (L) Leukocyte and (M) monocyte adhesion in 958ami-treated PAECs compared with DMSO control (n = 6 replicates per group). (N) Rats were administered monocrotaline (80 mg/kg intraperitoneally) 1 week before initiation of a daily dose of 958ami (7.5 mg/kg intraperitoneally) for 10 days. (O) Pulmonary arterioles from DMSO-versus 958ami-injected rats stained for a target protein (CH25H, VCAM1, or CD11b; red with yellow arrowheads), the endothelial layer (CD31; green), the smooth muscle layer (α-SMA; white), and nuclear counterstain (DAPI; blue). (P to S) Quantification of the relative intensity of (P) CH25H or (Q) VCAM1, (R) the number of CD11b+ cells per vessel, or (S) the degree of vessel muscularization defined by α-SMA layer thickness to total vessel diameter (n = 6 to 7 rats per group). (T) Fulton’s Index, (U) RVFAC, (V) TAPSE, and (W) RVSP of monocrotaline rats receiving intraperitoneal DMSO or 958ami (n = 5 to 15 rats per group). All data were analyzed by means of Student’s t test unless otherwise specified and presented as mean ± SD.

Update of

Comment in

  • Decoding lysosome communication.
    Pullamsetti SS, Savai R. Pullamsetti SS, et al. Science. 2025 Jan 24;387(6732):359-361. doi: 10.1126/science.adv1201. Epub 2025 Jan 23. Science. 2025. PMID: 39847645

References

    1. Bäck M, Yurdagul A Jr, Tabas I, Öörni K, Kovanen PT, Inflammation and its resolution in atherosclerosis: Mediators and therapeutic opportunities. Nat. Rev. Cardiol 16, 389–406 (2019). doi: 10.1038/s41569-019-0169-2 - DOI - PMC - PubMed
    1. Guzik TJ, Touyz RM, Oxidative stress, inflammation, and vascular aging in hypertension. Hypertension 70, 660–667 (2017). doi: 10.1161/HYPERTENSIONAHA.117.07802 - DOI - PubMed
    1. Kelly PJ, Lemmens R, Tsivgoulis G, Inflammation and stroke risk: A new target for prevention. Stroke 52, 2697–2706 (2021). doi: 10.1161/STROKEAHA.121.034388 - DOI - PubMed
    1. Hattori Y, Hattori K, Machida T, Matsuda N, Vascular endotheliitis associated with infections: Its pathogenetic role and therapeutic implication. Biochem. Pharmacol 197, 114909 (2022). doi: 10.1016/j.bcp.2022.114909 - DOI - PMC - PubMed
    1. Jones JH, Minshall RD, Endothelial transcytosis in acute lung injury: Emerging mechanisms and therapeutic approaches. Front. Physiol 13, 828093 (2022). doi: 10.3389/fphys.2022.828093 - DOI - PMC - PubMed

MeSH terms