. 2025 Feb 11;58(2):381-396.e9.
doi: 10.1016/j.immuni.2024.12.012. Epub 2025 Jan 22.

Microbiota translocation following intestinal barrier disruption promotes Mincle-mediated training of myeloid progenitors in the bone marrow

Affiliations

Microbiota translocation following intestinal barrier disruption promotes Mincle-mediated training of myeloid progenitors in the bone marrow

Iñaki Robles-Vera et al. Immunity. .

Abstract

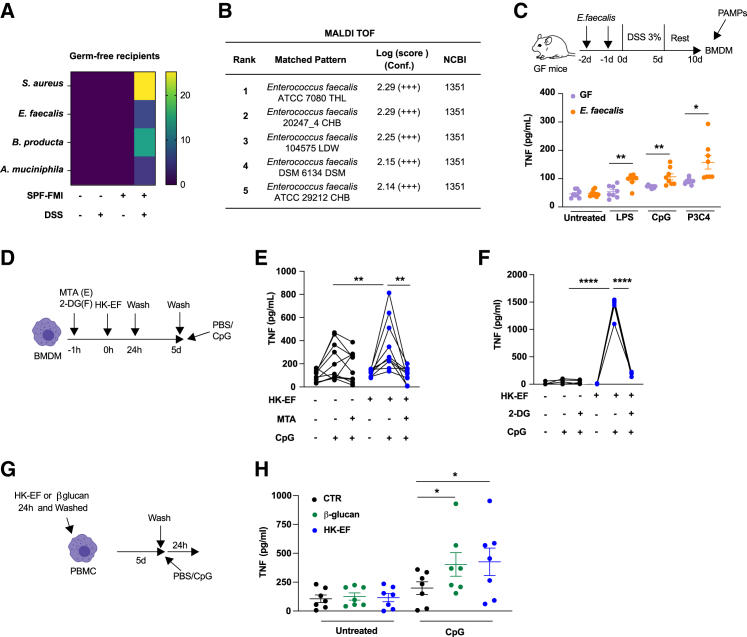
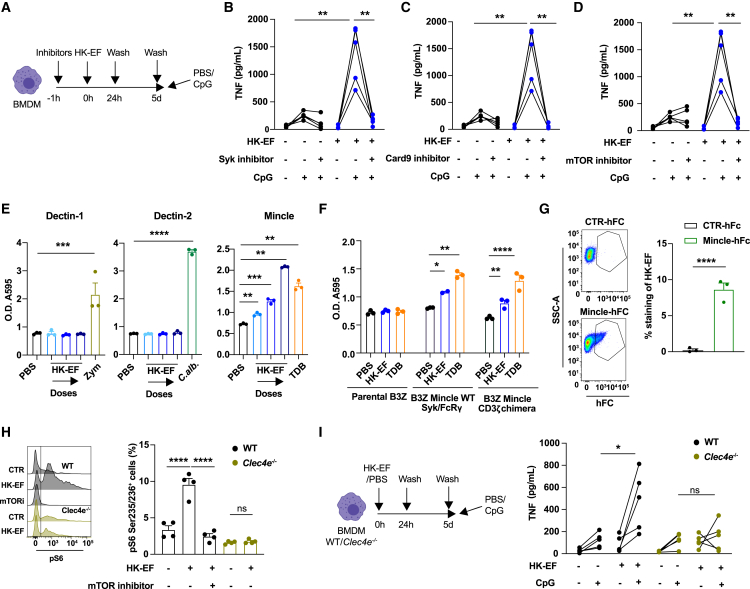
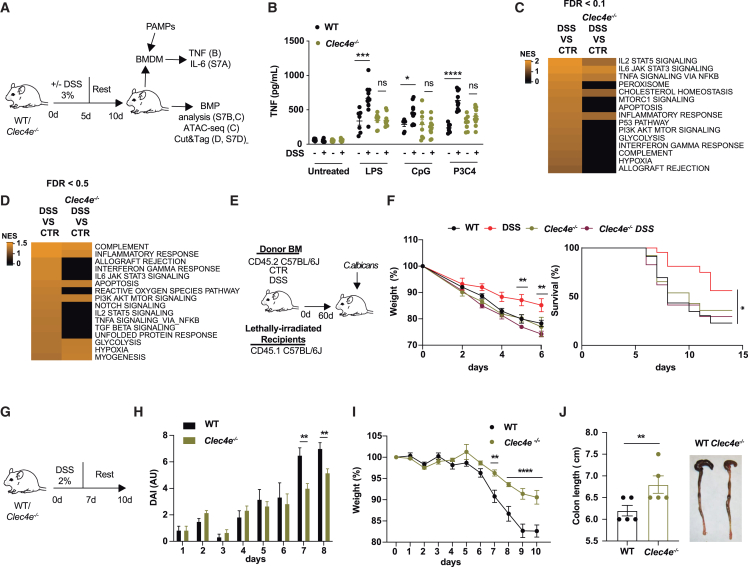
Impairment of the intestinal barrier allows the systemic translocation of commensal bacteria, inducing a proinflammatory state in the host. Here, we investigated innate immune responses following increased gut permeability upon administration of dextran sulfate sodium (DSS) in mice. We found that Enterococcus faecalis translocated to the bone marrow following DSS treatment and induced trained immunity (TI) hallmarks in bone-marrow-derived mouse macrophages and human monocytes. DSS treatment or heat-killed E. faecalis reprogrammed bone marrow progenitors (BMPs), resulting in enhanced inflammatory responses in vitro and in vivo and protection against subsequent pathogen infections. The C-type lectin receptor Mincle (Clec4e) was essential for E. faecalis-induced TI in BMPs. Clec4e-/- mice showed impaired TI upon E. faecalis administration and reduced pathology following DSS treatment. Thus, Mincle sensing of E. faecalis induces TI that may have long-term effects on pathologies associated with increased gut permeability.

Keywords: Mincle receptor; bone marrow progenitors; gut bacterial translocation; inflammation; macrophages; trained immunity.


Conflict of interest statement

Declaration of interests J.L.S., L.C., C.M.D.-R., S.I., and S.M.-C. were employees of Inmunotek S.L. or Fundación Inmunotek at the time of the work. The D.S. lab receives funds from a collaboration agreement between CNIC and Inmunotek.

Figures

None
Graphical abstract
Figure 1
Figure 1
Gut microbiota translocation induces trained immunity in myeloid bone marrow progenitors (A and B) (A) Mice were treated or not with DSS and antibiotics (ABX) as indicated in the outline; bone marrow (BM) extracted and BM-derived macrophages (BMDMs) generated and stimulated for 24 h with the following pathogen-associated molecular patterns: LPS, CpG, or Pam3CSK4 (P3C4). (B) TNF production measured by ELISA in culture supernatant of BMDMs from the indicated treatments and stimulations. Data obtained from a pool of two independent experiments (n = 7–9). (C and D) (C) Germ-free (GF) mice were administered or not with fecal microbiota inoculation (FMI) from SPF mice and treated or not with the DSS protocol as indicated. Then, BMDMs were generated and stimulated as in (A). (D) TNF production measured by ELISA in culture supernatant of BMDMs from indicated treatments and stimulations. Two pooled independent experiments (n = 8). (E) Mice were treated or not with DSS, as indicated in (A), and BM myeloid progenitors (BMPs) counted at day 10. Graphs show total numbers per femur of common myeloid progenitors (CMPs), granulocyte-monocyte progenitors (GMPs), and multipotent progenitor cells (MPP3). Three pooled independent experiments (n = 13–15). (F and G) ATAC-seq analysis in GMPs sorted from BM of control (CTR) or DSS mice at day 10 of the protocol shown in (A). (F) MAplot showing 40.011 differentially accessible peaks between DSS and CTR mice GMPs, with p < 0.01. (G) Bar plot showing enriched gene sets from the MSigDB Hallmark collection with false discovery rate (FDR) < 0.25. Positive normalized enrichment score (NES) values (orange color) and negative (green color) indicate congruent over- or under-expression of a pathway or function-associated genes in DSS compared with CTR condition. Only the top 20 hits (according to FDR) are represented. A pool of 3 mice was used per biological replicate, and 3 biological replicates were used per condition. (H) H3K4me3 Cut&Tag analysis in GMPs sorted from BM of CTR or DSS mice at day 10 of protocol shown in (A). Bubble plot showing gene set enrichment analysis (GSEA) from the MSigDB Hallmark collection with p < 0.1. Positive NES values (red) and negative (purple) indicate congruent over- or under-expression of a pathway or function-associated genes in DSS compared with CTR condition. Only the top 20 hits (according to FDR) are represented. A pool of 3 mice was used per biological replicate, and 3 biological replicates were used per condition. (I) RNA-seq analysis in GMPs obtained from untreated or DSS mice after DSS protocol described in (A). GSEA profile from gene expression changes in glycolysis, mTOR, IL-6, and TNF is highlighted. A pool of 3 mice was used per biological replicate, and 3 biological replicates were used per condition. (J) Donor mice were treated or not with DSS as in (A) and BM grafted to CD45.1 C57BL/6J recipient mice. (K) After 60 days, mice were challenged with LPS and TNF measured in plasma by ELISA 1 h later. Two pooled experiments (n = 8–10). (L) Graphs show total numbers per femur of the indicated myeloid BMPs. Two pooled experiments (n = 7–8). (B, D, E, K, and L) Individual data and mean ± SEM are shown. p < 0.05; ∗∗p < 0.01; ∗∗∗p < 0.005; ∗∗∗∗p < 0.001 (unpaired Student’s t test). See also Figure S1.
Figure 2
Figure 2
Identification of Enterococcus faecalis as a driver of bone marrow training upon gut barrier disruption (A and B) BM from DSS mice was flushed and analyzed by 16S sequencing (A) or cultured in lysogeny broth (LB) plates for MALDI-TOF analysis (B). (A) Heatmap representing the bacterial read counts found in flushed BM. (B) MALDI biotyper report showing the species of bacteria detected by MALDI-TOF analysis from colonies obtained from LB plates in aerobic conditions after BM flushing. A log score of ≥1.80 represents high confidence and it is accepted for bacterial identification. (C) GF mice were monocolonized or not with E. faecalis and treated with DSS; BM extracted and BMDMs generated and stimulated with LPS, CpG, or P3C4 for 24 h. TNF production measured by ELISA in culture supernatant of BMDMs from indicated treatments and stimulations. Two pooled experiments (n = 8). (D–F) BMDMs obtained from C57BL/6J mice were pretreated or not with the methyltransferase inhibitor, 5′-methylthioadenosine (MTA) (E), or the glycolysis inhibitor 2-deoxy-glucose (2-DG) (F), for 1 h before incubation with HK-EF for a further 24 h. After this time, media were changed, and cells were rested for 5 days. TNF production measured by ELISA in culture supernatant of BMDMs after 24 h stimulation with CpG. (E) Three pooled experiments (n = 10). (F) Two pooled experiments (n = 5). (G and H) Human peripheral blood mononuclear cells (PBMCs) were incubated for 24 h with or without β-glucan or HK-EF, washed and left resting for 5 days before restimulation with CpG. (H) TNF concentration was measured in the supernatant by ELISA. Two pooled experiments (n = 7). (C and H) Individual data and mean ± SEM are shown. Unpaired Student’s t test. (E and F) Individual data and paired Student's t test. p < 0.05; ∗∗p < 0.01; ∗∗∗∗p < 0.001. See also Figures S2 and S3.
Figure 3
Figure 3
Systemic administration of HK-EF trains myeloid progenitors (A and B) (A) Wild-type (WT) or Rag1−/− mice were treated or not with HK E. faecalis (HK-EF) i.v. followed by the indicated analyses 10 days later. (B) TNF concentration measured by ELISA in plasma obtained 1 h after LPS stimulation in the indicated genotypes and treatments. Two pooled independent experiments (n = 5–7). (C) Graphs show total cell numbers per femur of common myeloid progenitors (CMPs), granulocyte-monocyte progenitors (GMPs), and multipotent progenitor cells (MPP3) at day 10 of protocol shown in (A). Three pooled independent experiments (n = 12–13). (D and E) ATAC-seq analysis in GMPs sorted from BM at day 10 of protocol shown in (A). (D) MAplot showing 2.360 differentially accessible peaks between HK-EF and control (CTR) mice GMPs, with p < 0.01. (E) Bar plot showing enriched gene sets from the MSigDB Hallmark collection with FDR < 0.25. Positive normalized enrichment score (NES) values (orange color) and negative (green color) indicate congruent over- or under-expression of a pathway or function-associated genes in HK-EF compared with CTR. Only the top 20 hits (according to FDR) are represented. A pool of 3 mice was used per biological replicate, and 3 biological replicates were used per condition. (F) H3K4me3 Cut&Tag analysis in GMPs at day 10 of protocol shown in (A). Bubble plot showing gene set enrichment analysis (GSEA) from the MSigDB Hallmark collection with an p < 0.1. Positive NES values (depicted in red) and negative (depicted in purple) indicate congruent over- or under-expression of a pathway or function-associated genes in HK-EF compared with CTR. Only the top 20 hits (according to FDR) are represented. Each biological replicate consisted of a pool of 3 mice, and 3 biological replicates were used per condition. (G) RNA-seq analysis was performed on GMPs at day 10 of protocol shown in (A). GSEA for GMPs obtained from WT mice treated or not with HK-EF. GSEA profile from gene expression changes in glycolysis, mTOR, IL-6, and TNFA is highlighted. (H–J) Donor mice were treated or not with HK-EF and rested for 10 days as in (A) and BM (I) or GMPs sorted from BM (J) were grafted to lethally irradiated CD45.1 C57BL/6J recipient mice. After 60 days, mice were challenged with LPS and TNF concentration measured by ELISA in plasma obtained 1 h after LPS stimulation. (I) One representative experiment of two performed (n = 5–9). (J) Two pooled independent experiments (n = 6–8). (B, C, I, and J) Individual data and mean ± SEM are shown. Unpaired Student’s t test was used to compare groups. ∗∗p < 0.01; ∗∗∗p < 0.005; ∗∗∗∗p < 0.001; ##p < 0.01 vs. Rag1−/−. See also Figure S4.
Figure 4
Figure 4
HK-EF triggers Mincle-dependent trained immunity in BMDMs (A–D) (A) BMDMs were treated or not with HK-EF upon pretreatment with Syk inhibitor (B), Card9 inhibitor (C), or mTOR inhibitor (D), stimulated with CpG 5 days later, and TNF production measured by ELISA in culture supernatant of BMDMs 24 h after CpG stimulation. Paired Student’s t test comparing independent BMDMs cultures (n = 5). (E) NFAT reporter activity of B3Z cells expressing the extracellular domains of either mouse Dectin-1 (left), Dectin-2 (middle), or Mincle (right) coupled to an intracellular CD3ζ in response to the indicated stimuli: PBS, HK-EF, Zymosan (Zym), Candida albicans (C. alb), and trehalose-6,6-dibehenate (TDB). Increasing doses of HK-EF correspond to 2 × 105, 2 × 107, and 2 × 109 CFU per well. One representative experiment of three performed is shown. Statistical analysis was performed using one-way ANOVA with Bonferroni post hoc test. (F) NFAT reporter activity in response to TDB or HK-EF (2 × 102 CFU) in B3Z cells parental, stably transfected with WT Mincle, Syk, and FcRγ, or B3Z expressing human Mincle-CD3ζ chimera. One representative experiment of three performed is shown. Statistical analysis was performed by one-way ANOVA with Bonferroni post hoc test. (G) Representative plots (left) and graph depicting the frequency (right) of HK-EF stained with control-hFc or Mincle-hFc. Pool of three independent experiments. (H) Representative histograms (left) and frequency of BMDMs from WT and Clec4e−/− mice showing high phosphorylation of S6 ribosomal protein (Ser235/236) measured by flow cytometry. Pool of two independent experiments. (G and H) Individual data and mean ± SEM. (I) BMDMs from WT or Clec4e−/− mice were treated with PBS or HK-EF as indicated in the outline. TNF production measured by ELISA in culture supernatant of BMDMs from indicated treatments and stimulations. Paired Student’s t test compares 5 independent WT and Clec4e−/− BMDMs cultures. p < 0.05; ∗∗p < 0.01; ∗∗∗p < 0.005; ∗∗∗∗p < 0.001. See also Figure S5.
Figure 5
Figure 5
Mincle receptor stimulation induces trained immunity (A and B) (A) BMDMs were treated or not with MTA 1 h before plating in trehalose-6,6-dibehenate (TDB)-coated wells. After 24 h, cells were re-plated in non-TDB-coated plates and rested for 5 days before stimulation with CpG for 24 h. (B) TNF (left) and IL-6 (right) production measured by ELISA in culture supernatant of BMDMs from indicated treatments and stimulations. Paired Student’s t test compares 5 independent cultures. (C) BMDMs from WT or Clec4e−/− mice were trained with TDB as described in (A). TNF production measured by ELISA in culture supernatant of BMDMs from indicated treatments and stimulations. Paired Student’s t test compares 5 independent WT and Clec4e−/− BMDMs cultures. (D) Time course kinetics extracellular acidification rate (ECAR) (left) and basal ECAR (right) of BMDMs stimulated or not with TDB for 24 h, measured in the MitoStress test in a Seahorse assay (n = 4). (E) Representative histograms (left) and frequency of BMDMs from WT and Clec4e−/− mice stimulated or not for 24 h with TDB showing high phosphorylation of S6 ribosomal protein (Ser235/236) measured by flow cytometry. Pool of 3 independent experiments. (F) BMDMs from WT mice were treated as in (A) but using as training stimuli HK or live EF, HK E. coli or some well-stablished ligands for Mincle, including GclC14C18, ManC14C18, and mucus from Lactobacillus plantarum-gavaged mice (enriched LP mucus). TNF production measured by ELISA in the culture supernatant of BMDMs from indicated treatments and stimulations. Paired Student’s t test compares 5 independent WT BMDMs cultures. (G) NFAT reporter activity in response to TDB or 2 × 102 CFU of HK Staphylococcus aureus (HK-SA) in B3Z cells parental, stably transfected with WT Mincle, Syk, and FcRγ or B3Z expressing human Mincle-CD3ζ chimera. One representative experiment of three performed is shown. One-way ANOVA with Bonferroni post hoc test. (H) BMDMs from WT or Clec4e−/− mice were trained or not as indicated in (A) with HK-SA. TNF production was measured by ELISA in the culture supernatant of BMDMs from the indicated treatments and stimulations. Paired Student’s t test compares 3 independent WT and Clec4e−/− BMDMs cultures. (I and J) (I) WT or Clec4e−/− mice were treated with DDA or DDA:TDB i.v. and restimulated with LPS 10 days later. (J) TNF (left) and IL-6 (right) concentration measured by ELISA in plasma obtained 1 h after LPS stimulation. Three pooled independent experiments (n = 9). Individual data and mean ± SEM are shown. Unpaired Student’s t test. p < 0.05; ∗∗p < 0.01; ∗∗∗p < 0.005; ∗∗∗∗p < 0.001.
Figure 6
Figure 6
HK-EF induces Mincle-dependent trained immunity in vivo that is protective against infection (A and B) (A) WT and Clec4e−/− mice were treated or not with HK-EF i.v. and challenged with LPS i.p. at day 10. (B) TNF concentration in plasma from mice of the indicated treatments and genotypes. Three pooled independent experiments (n = 8–10). (C and D) Mice were either trained with HK-EF or left untreated and GMPs were sorted from BM at day 10 of protocol shown in (A) and analyzed by ATAC-seq (C) and H3K4me3 Cut&Tag analysis (D). Comparative heatmap representing normalized enrichment score (NES) values for gene sets from the MSigDB Hallmark collection, calculated through GSEA, after ascribing open regions to gene promoters. Gene sets have been selected among those enriched with FDR < 0.1 (C) or FDR < 0.5 (D). Positive and negative NES values indicate increased accessibility for gene-associated regions in mice treated with HK-EF or not (CTR), in WT or Clec4e−/− backgrounds, as indicated. A pool of 3 mice was used per biological replicate, and 3 biological replicates were used per condition. (E) Donor mice were either treated with HK-EF or left untreated, followed by a 10-day resting period as outlined in (A). GMPs from these mice were subsequently grafted to lethally irradiated CD45.1 C57BL/6J recipient mice. After 60 days, the recipient mice were challenged with LPS. TNF concentration measured by ELISA in plasma obtained 1 h after LPS stimulation was measured by ELISA. One representative experiment out of two performed is shown (n = 5–9). WT mice are the same as in Figure 3I and shown here for comparison with Clec4e−/− mice tested in the same experiment. (F–H) WT and Clec4e−/− mice treated or not with HK-EF were challenged with 1.5 × 105 CFU per mouse C. albicans i.v. (G) or 15 plaque-forming unit (PFU) per mouse of influenza A virus i.n. (H) at day 10. Weight loss (left) and survival curves (right) are shown. (I and J) Donor mice were treated or not with HK-EF, followed by a 10-day resting period as in (A) and their BM used to graft lethally irradiated CD45.1 C57BL/6J recipient mice. After 60 days, mice were challenged with C. albicans 1.5 × 105 CFU per mouse i.v. (J) Weight loss (left) and survival curves (right) are shown. (B and E) Individual data and mean ± SEM are shown. Unpaired Student’s t test was used to compare conditions. ∗∗∗p < 0.005; ∗∗∗∗p < 0.001. (G, H, and J) Results from a pool of two independent experiments (n = 10). Two-way ANOVA test comparing CTR vs. HK-EF weight. Log rank (Mantel-Cox) test for survival curve comparison. p < 0.05; ∗∗p < 0.01; ∗∗∗p < 0.005; ∗∗∗∗p < 0.001. See also Figure S6.
Figure 7
Figure 7
Mincle deficiency prevents trained immunity and attenuates pathology associated to DSS-induced gut barrier disruption (A and B) (A) WT and Clec4e−/− mice were treated or not with DSS for 5 days and rested. At day 10, BM was extracted and BMDMs generated and stimulated with LPS, CpG, or P3C4 for 24 h. (B) TNF production measured by ELISA in culture supernatant of BMDMs from indicated treatments and stimulations. Two pooled independent experiments (n = 7–10). (C and D) GMPs were sorted from BM at day 10 of protocol shown in (A) and analyzed by ATAC-seq (C) and H3K4me3 Cut&Tag (D). Comparative heatmap representing normalized enrichment score (NES) values for gene sets from the MSigDB Hallmark collection, as calculated by GSEA, after ascribing open regions to gene promoters. Gene sets have been selected among those enriched with FDR < 0.1 (C) or FDR < 0.5 (D). Positive and negative NES values indicate increased accessibility for gene-associated regions in mice treated with DSS or not (CTR), in WT or Clec4e−/− backgrounds, as indicated. A pool of 3 mice was used per biological replicate, and 3 biological replicates were used per condition. (E and F) WT or Clec4e−/− donor mice were treated as in (A) and BM grafted into lethally irradiated CD45.1 C57BL/6J recipient mice. After 60 days, recipient mice were challenged with C. albicans 1.5 × 105 CFU per mouse i.v. (F) Weight loss (left) and survival curves (right) are shown. Results from a pool of two independent experiments (n = 10). Two-way ANOVA test comparing CTR vs. HK-EF weight. Log rank (Mantel-Cox) test for survival curve comparison. (G–J) WT and Clec4e−/− mice were treated with DSS as indicated. (H) Disease activity index (DAI) (n = 8). Mean ± SEM. (I) Weight loss (n = 10). Mean ± SEM. (J) Colon length (n = 5). Individual data and mean ± SEM. Two pooled independent experiments. Unpaired Student’s t test was used to compare groups. p < 0.05; ∗∗p < 0.01; ∗∗∗p < 0.005; ∗∗∗∗p < 0.001. See also Figure S7.

References

    1. Akdis C.A. Does the epithelial barrier hypothesis explain the increase in allergy, autoimmunity and other chronic conditions? Nat. Rev. Immunol. 2021;21:739–751. doi: 10.1038/s41577-021-00538-7. - DOI - PubMed
    1. Tilg H., Zmora N., Adolph T.E., Elinav E. The intestinal microbiota fuelling metabolic inflammation. Nat. Rev. Immunol. 2020;20:40–54. doi: 10.1038/s41577-019-0198-4. - DOI - PubMed
    1. Brandi P., Conejero L., Cueto F.J., Martínez-Cano S., Dunphy G., Gómez M.J., Relaño C., Saz-Leal P., Enamorado M., Quintas A., et al. Trained immunity induction by the inactivated mucosal vaccine MV130 protects against experimental viral respiratory infections. Cell Rep. 2022;38 doi: 10.1016/j.celrep.2021.110184. - DOI - PMC - PubMed
    1. Vuscan P., Kischkel B., Joosten L.A.B., Netea M.G. Trained immunity: general and emerging concepts. Immunol. Rev. 2024;323:164–185. doi: 10.1111/imr.13326. - DOI - PubMed
    1. Netea M.G., Domínguez-Andrés J., Barreiro L.B., Chavakis T., Divangahi M., Fuchs E., Joosten L.A.B., van der Meer J.W.M., Mhlanga M.M., Mulder W.J.M., et al. Defining trained immunity and its role in health and disease. Nat. Rev. Immunol. 2020;20:375–388. doi: 10.1038/s41577-020-0285-6. - DOI - PMC - PubMed

MeSH terms

LinkOut - more resources