

Exploring the burden of cholera in the WHO African region: patterns and trends from 2000 to 2023 cholera outbreak data
- PMID: 39848637
- PMCID: PMC11891530
- DOI: 10.1136/bmjgh-2024-016491
Exploring the burden of cholera in the WHO African region: patterns and trends from 2000 to 2023 cholera outbreak data
Abstract
Introduction: Cholera outbreaks remain persistent in the WHO African region, with an increased trend in recent years. This study analyses actual drivers of cholera including correlations with water, sanitation, and hygiene (WASH) indicators, and climate change trends.
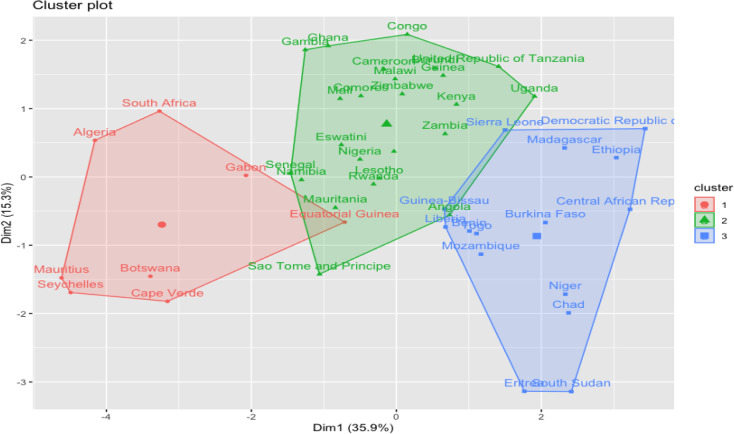
Methods: This was a cross-sectional descriptive and analytic study. Cholera data from 2000 to 2023 and data relating to cholera drivers were compiled and analysed through multi-level exploratory analysis. We cross-referenced several WASH indicators, and generated a similarity matrix to categorise countries or subnational units into groups using principal component analysis and K-means clustering. We integrated cholera outbreak data with WASH indicators and created a matrix of indicators relevant for analysing cholera burden. We conducted summary statistics, temporal visualisations, Geographic Information System (GIS) mapping, trend analysis and statistical tests for correlations to derive patterns and trends from the data, derive similarities and develop projections.
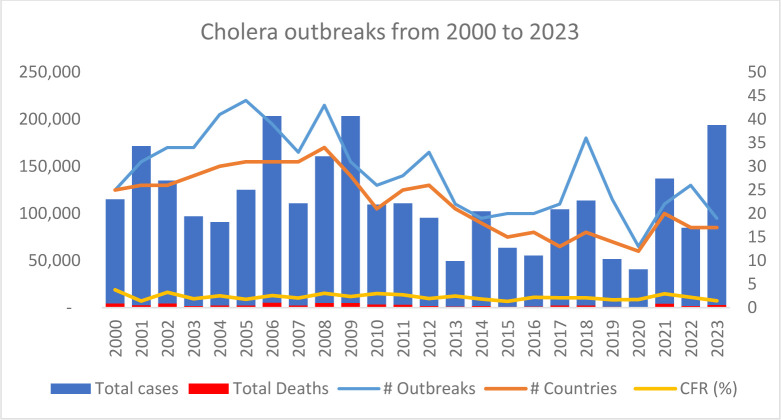
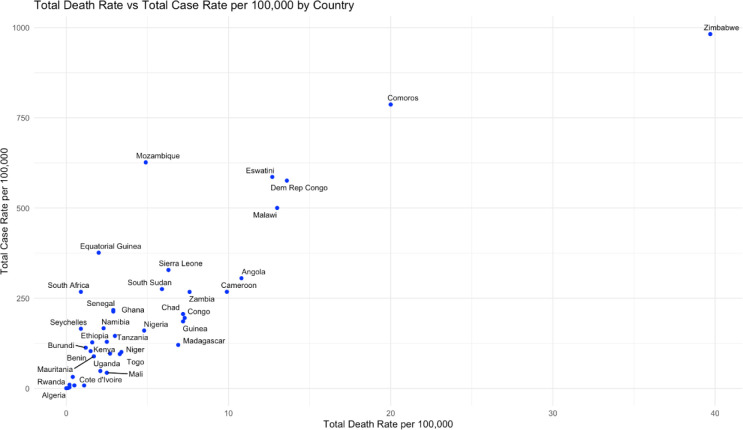
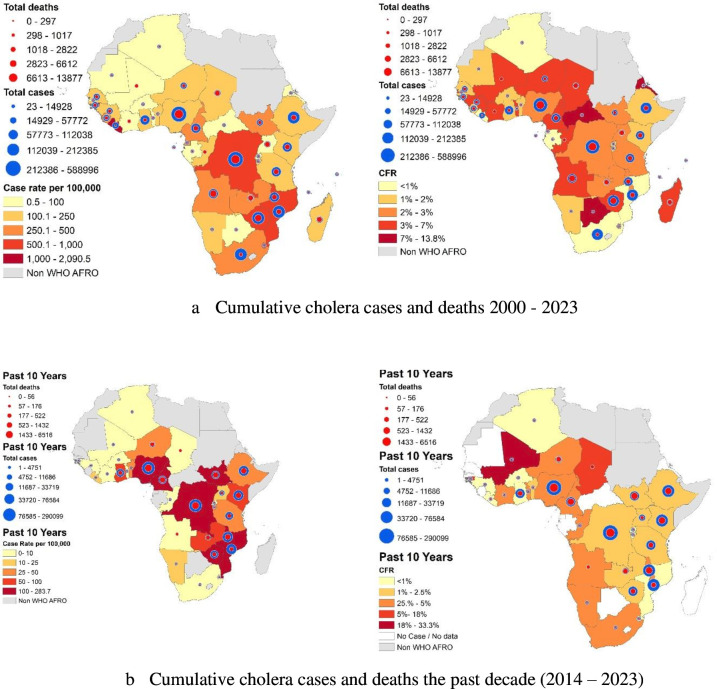
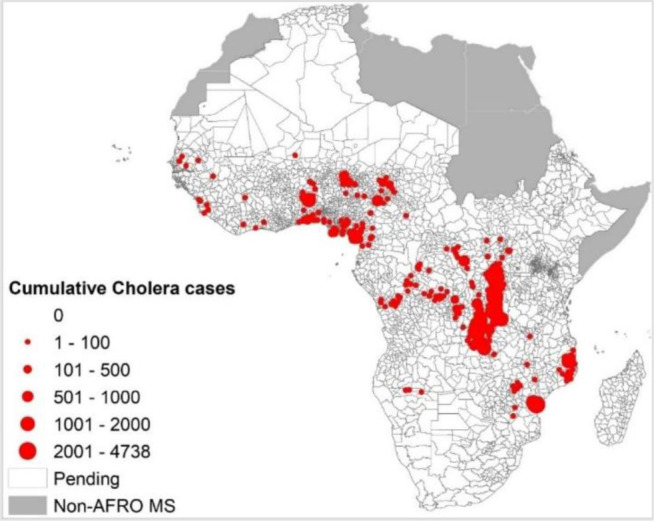
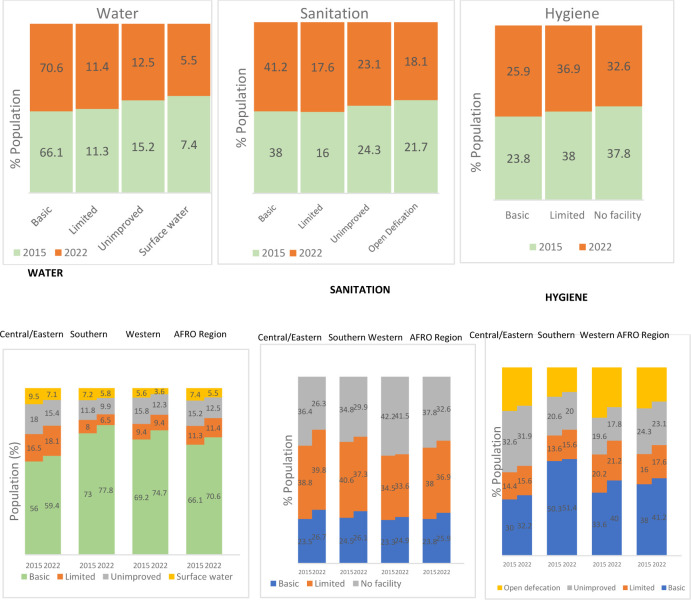
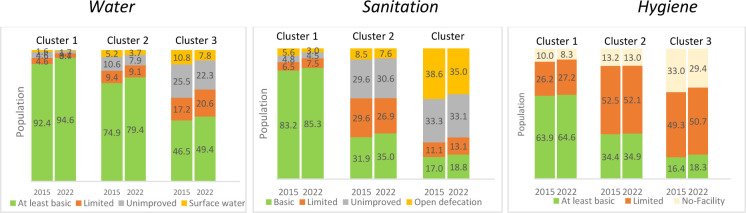
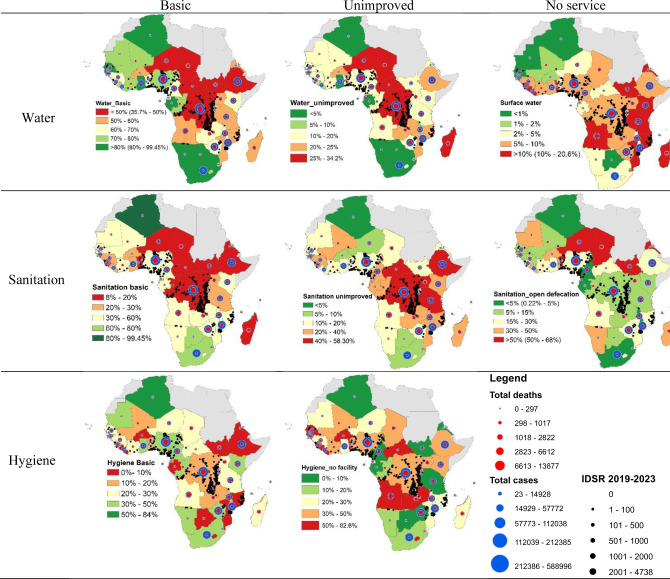
Results: A total of 2 727 172 cases and 63 182 deaths were reported from 44 countries, representing 94% of the 47 countries in the region, from 2000 to 2023. The case fatality ratio of 2.3% is suggestive of issues in case management. A total of 684 outbreaks were reported, with the highest burdens in Nigeria and the Democratic Republic of the Congo. Median detection time to outbreak was 2 days, while median time for outbreak control was 92 days. Cholera incidence seemed higher in the period 2014 to 2023 than in the period before 2014. The study results confirmed correlations between WASH indicators and cholera outbreaks. Risks factors include drinking surface water, lacking soap and/or water, and open defaecation. Over 29% and 58.8% of the population lack access to basic water and basic sanitation, respectively.
Conclusion: Insufficient access to WASH services remains the main predisposing factor for cholera in the WHO African region. Political leaders should invest more in access to WASH, strengthen multisectoral collaboration, and improve availability of needed tools to increase the likelihood of meeting cholera elimination goals by 2030.
Keywords: Cholera; Control strategies; Epidemiology; Global Health; Public Health.
© World Health Organization 2025. Licensee BMJ.
Conflict of interest statement
Competing interests: None declared.
Figures
Similar articles
-
An assessment of the progress made in the implementation of the regional framework for cholera prevention and control in the WHO African region.BMJ Glob Health. 2025 Jan 22;10(1):e016168. doi: 10.1136/bmjgh-2024-016168. BMJ Glob Health. 2025. PMID: 39848635 Free PMC article. Review.
-
Dissecting Water, Sanitation, and Hygiene (WaSH) to Assess Risk Factors for Cholera in Shashemene, Oromia Region, Ethiopia.Clin Infect Dis. 2024 Jul 12;79(Suppl 1):S53-S62. doi: 10.1093/cid/ciae274. Clin Infect Dis. 2024. PMID: 38996037 Free PMC article.
-
Health facility preparedness for cholera outbreak response in four cholera-prone districts in Cameroon: a cross sectional study.BMC Health Serv Res. 2019 Jul 8;19(1):458. doi: 10.1186/s12913-019-4315-7. BMC Health Serv Res. 2019. PMID: 31286934 Free PMC article.
-
Cholera outbreaks in Africa.Curr Top Microbiol Immunol. 2014;379:117-44. doi: 10.1007/82_2014_369. Curr Top Microbiol Immunol. 2014. PMID: 24827501
-
The 2023 Latin America report of the Lancet Countdown on health and climate change: the imperative for health-centred climate-resilient development.Lancet Reg Health Am. 2024 Apr 23;33:100746. doi: 10.1016/j.lana.2024.100746. eCollection 2024 May. Lancet Reg Health Am. 2024. PMID: 38800647 Free PMC article. Review.
Cited by
-
Unmasking and tackling the underestimation of the cholera burden in Africa: A viewpoint.PLoS Negl Trop Dis. 2025 Jun 5;19(6):e0013128. doi: 10.1371/journal.pntd.0013128. eCollection 2025 Jun. PLoS Negl Trop Dis. 2025. PMID: 40471901 Free PMC article. Review.
-
Trends of cholera epidemics and associated mortality factors in Cameroon: 2018-2023: a cross-sectional study.BMC Public Health. 2025 May 16;25(1):1816. doi: 10.1186/s12889-025-23007-5. BMC Public Health. 2025. PMID: 40380135 Free PMC article.
-
Cholera in Sub-Saharan Africa: Unveiling neglected drivers and pathways to elimination.PLoS Negl Trop Dis. 2025 Apr 23;19(4):e0013029. doi: 10.1371/journal.pntd.0013029. eCollection 2025 Apr. PLoS Negl Trop Dis. 2025. PMID: 40267060 Free PMC article.
-
An assessment of the progress made in the implementation of the regional framework for cholera prevention and control in the WHO African region.BMJ Glob Health. 2025 Jan 22;10(1):e016168. doi: 10.1136/bmjgh-2024-016168. BMJ Glob Health. 2025. PMID: 39848635 Free PMC article. Review.
-
Geographical shifting of cholera burden in Africa and its implications for disease control.Nat Med. 2025 Aug 7. doi: 10.1038/s41591-025-03847-9. Online ahead of print. Nat Med. 2025. PMID: 40775053
References
-
- World Health Organization . Weekly Epidemiological Record, 98. 2023. pp. 431–52.https://iris.who.int/handle/10665/372986 Available.
-
- Dossou Sodjinou V, Talisuna A, Braka F, et al. The 2021 Cholera Outbreak in West Africa: Epidemiology and Public Health Implications. Arch Clin Biomed Res. 2022;06:296–307. doi: 10.26502/acbr.50170245. - DOI
MeSH terms
Grants and funding
LinkOut - more resources
Full Text Sources
Medical