. 2025 Jan 23;15(1):2922.
doi: 10.1038/s41598-024-80519-7.

Identification of potential biomarkers for 2022 Mpox virus infection: a transcriptomic network analysis and machine learning approach

Affiliations

Identification of potential biomarkers for 2022 Mpox virus infection: a transcriptomic network analysis and machine learning approach

Joy Prokash Debnath et al. Sci Rep. .

Abstract

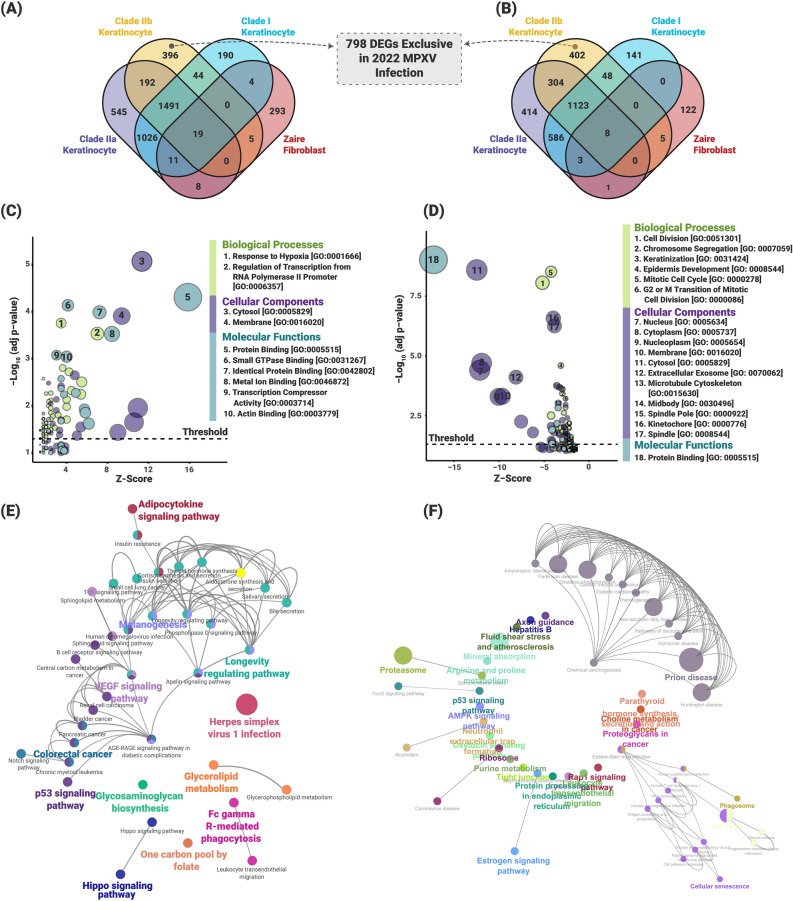
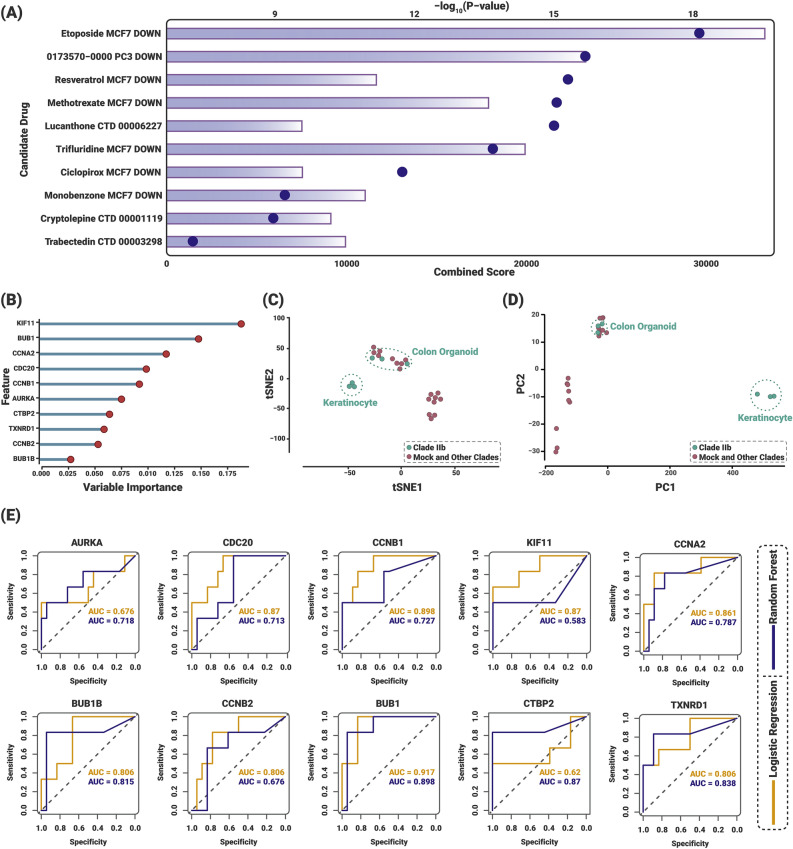
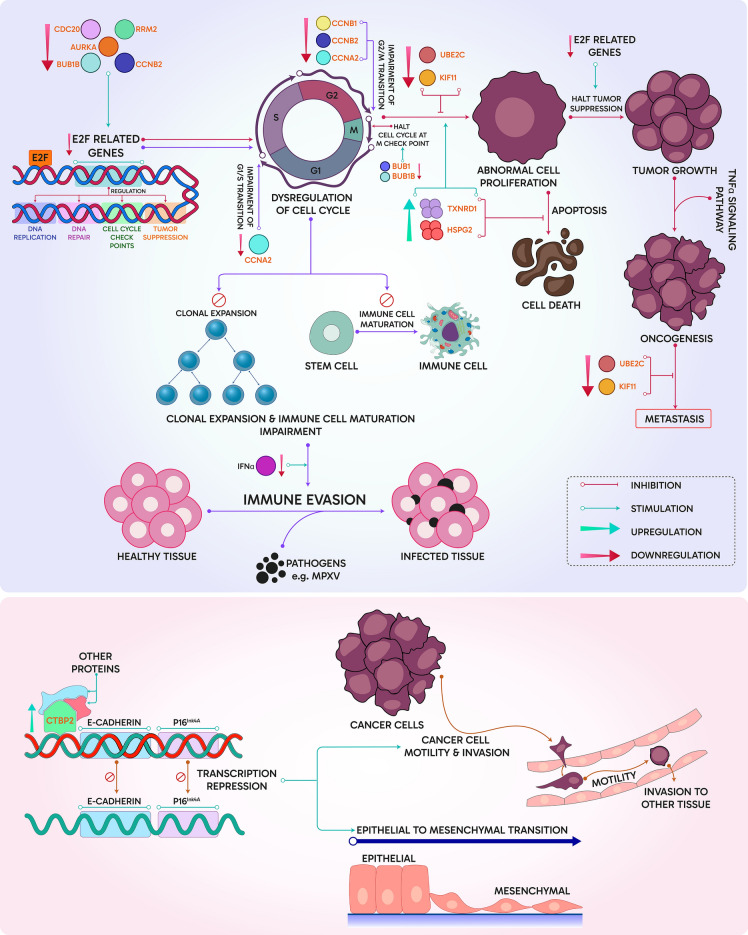
Monkeypox virus (MPXV), a zoonotic pathogen, re-emerged in 2022 with the Clade IIb variant, raising global health concerns due to its unprecedented spread in non-endemic regions. Recent studies have shown that Clade IIb (2022 MPXV) is marked by unique genomic mutations and epidemiological behaviors, suggesting variations in host-virus interactions. This study aimed to identify the differentially expressed genes (DEGs) induced by the 2022 MPXV infection through comprehensive bioinformatics analyses of microarray and RNA-Seq datasets from post-infected cell types with different MPXV clades. Subsequently, gene expression network analyses pinpoint the key DEGs, followed by their candidate drug assessment using the Drug SIGnatures DataBase (DSigDB) and validation by multiple machine learning algorithms. Comparative differential gene expression (DGE) analysis revealed 798 DEGs exclusive to the 2022 MPXV invasion in the skin cell types (keratinocytes). Intriguingly, 13 key DEGs were identified across hubs and clusters, highlighting their aberrant expressions in cell cycle regulation, immune responses, and cancer pathways. Biomarker screening via Random Forest (RF) model (selected with PyCaret from multiple models) and validation through t-distributed stochastic neighbor embedding (t-SNE) algorithm, principal component analysis (PCA), and ROC curve analysis employing Logistic Regression and Random Forest, identified 6 key DEGs (TXNRD1, CCNB1, BUB1, CDC20, BUB1B, and CCNA2) as promising biomarkers (AUC > 0.7) for clade IIb infection. This study anticipates that further investigation and clinical trials will catalyze novel detection and therapeutic options to combat 2022 MPXV infection in humans.

Keywords: 2022 MPXV (Clade IIb); Biomarker; Candidate drugs; DEGs; Machine learning (ML) models; Mpox (monkeypox).


Conflict of interest statement

Declarations. Competing interests: The authors declare no competing interests.

Figures

Fig. 1
Fig. 1
Schematic illustration of the study.
Fig. 2
Fig. 2
Data normalization. (A,B) PCA of RNA-Seq data highlighting clusters among the samples. X-axis and Y-axis represent the first principal component (PC1) and the second principal component (PC2), respectively. (C,D) UMAP of the microarray datasets identifying two outliers in both datasets. Each circle represents an individual, with varying colors denoting the different treatments. (E) Specific contrast depicts the distribution of adjusted p-values for each analysis, revealing a substantial number of significant genes in monocyte, fibroblast, and keratinocyte cell types.
Fig. 3
Fig. 3
Identification of DEGs from each contrast of the datasets. (AF) The volcano plots illustrate the up- and down-regulated genes. The x-axis denotes the log2 fold change (LFC) in gene expression, with positive values indicating upregulation and negative values indicating downregulation. The Y-axis shows the negative log-transformed adjusted P-value. Red circles highlight upregulated genes, while blue circles indicate downregulated genes. The horizontal line marks the FDR threshold of 0.05 and the vertical lines delineate the LFC thresholds of -1 and + 1. (GI) The number of DEGs for each contrast and the shared DEGs, offering a comprehensive overview of gene expression changes across different conditions.
Fig. 4
Fig. 4
Identification of exclusive DEGs to 2022 MPXV infection and their relationships among metabolic processes. (A,B) Venn diagrams illustrate the shared and unique DEGs across various clades. (C,D) The X-axis represents the Z-Score, while the -log (adj p-value) is allocated to the Y-axis. The area of the bubbles is significantly proportional to the number of DEGs (C for upregulated and D for downregulated genes) associated with the given GO terms. (E,F) Pathway enrichment analysis of exclusively expressed upregulated (E) and downregulated (F) genes. The circles represent the pathway, while the lines indicate the connection among the given pathways.
Fig. 5
Fig. 5
Gene expression network analysis. (A & D) The assessment of the functional and physical interactions among the exclusively expressed up- and down-regulated genes. Nodes represent proteins, and edges represent the interactions among gene products. (B & E) The interconnected regions known as clusters of proteins. (A,B & D,E) The red and blue nodes indicate up- and down-regulated genes respectively, and the straight lines represent edges. (C & F) Construction of gene regulatory networks, each containing the top 10 hub genes identified from both PPI networks. (G) The heatmap delineates the expression pattern of 13 DEGs uniquely associated with infections of different clades. (H) The correlation among the 13 DEGs is shown where red and blue colors indicate positive and negative correlation respectively. LFC: Log Fold Change; NA: Not Available.
Fig. 6
Fig. 6
Candidate drugs and predicted biomarkers. (A) Top 10 potential therapeutic drugs for the 13 key genes expressed in 2022 MPXV infection. The y-axis represents drug names, while the horizontal bars on the x-axis represent the combined scores, with the circles indicating the -log(P-value) for each candidate. (B) Feature importance plot for the random forest model, focusing on the top 10 most important DEGs ranked by their importance coefficient. (C,D) t-SNE and PCA based on the top 10 genes’ expressions in the RNA-Seq data. Samples associated with the keratinocyte cell line show clear distinction from that associated with colon organoids as they have not shown any differential expression. (E) The ROC curve of ranked DEGs displays AUC values for each gene predicted by both LR and RF models. t-SNE: t-distributed Stochastic Neighbor Embedding; PC: Principal Component; AUC: Area Under the ROC Curve.
Fig. 7
Fig. 7
Association of 13 key DEGs in different pathways.

References

    1. Mpox (monkeypox) outbreak 2022 - Global. World Health Organizationhttps://www.who.int/emergencies/situations/monkeypox-oubreak-2022 (2024). (Accessed 10 08 2024).
    1. Kraemer, M. U. G. et al. Tracking the 2022 monkeypox outbreak with epidemiological data in real-time. Lancet Infect. Dis.22, 941–942 (2022). - PMC - PubMed
    1. Isidro, J. et al. Phylogenomic characterization and signs of microevolution in the 2022 multi-country outbreak of monkeypox virus. Nat. Med.28, 1569–1572 (2022). - PMC - PubMed
    1. WHO Director-General declares mpox outbreak a public health emergency of international concern. World Health Organizationhttps://www.who.int/news/item/14-08-2024-who-director-general-declares-m... (2024). (Accessed 14 08 2024).
    1. Bunge, E. M. et al. The changing epidemiology of human monkeypox—A potential threat? A systematic review. PLoS Negl. Trop. Dis.16, e0010141 (2022). - PMC - PubMed