. 2025 Jan 24;10(1):26.
doi: 10.1038/s41392-024-02120-8.

VCP downstream metabolite glycerol-3-phosphate (G3P) inhibits CD8+T cells function in the HCC microenvironment

Affiliations

VCP downstream metabolite glycerol-3-phosphate (G3P) inhibits CD8+T cells function in the HCC microenvironment

Cheng Cheng et al. Signal Transduct Target Ther. .

Abstract

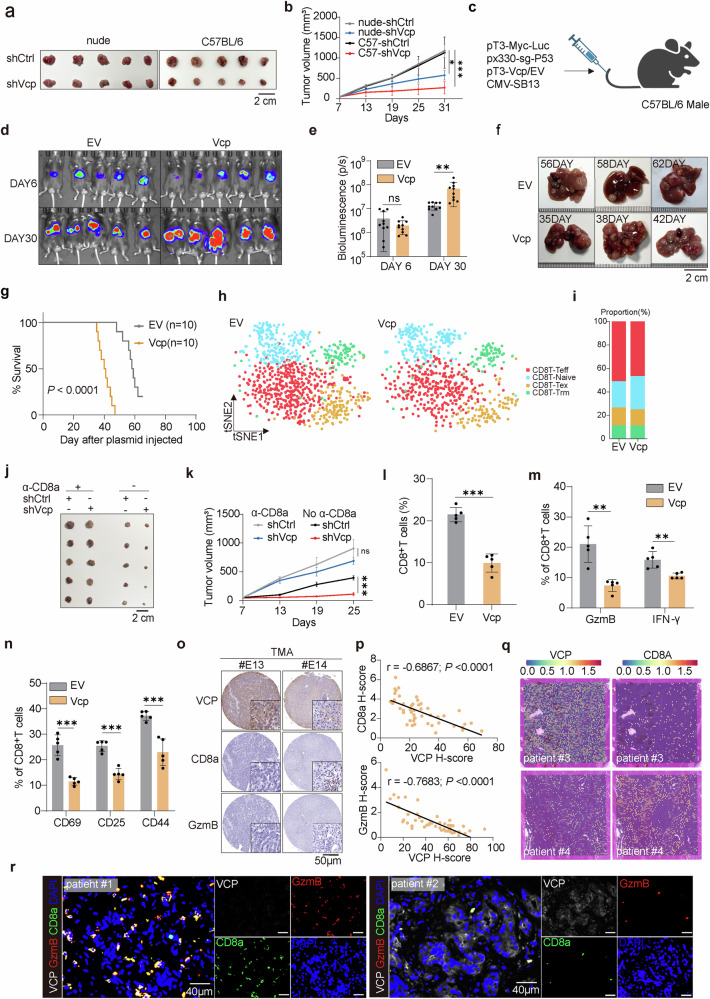
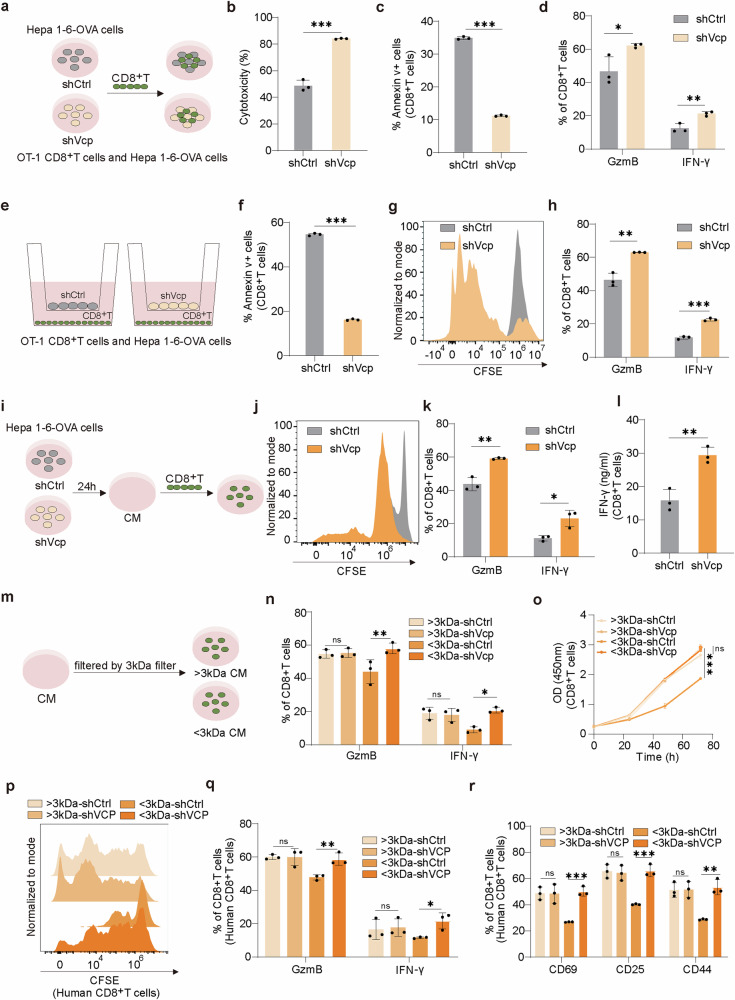
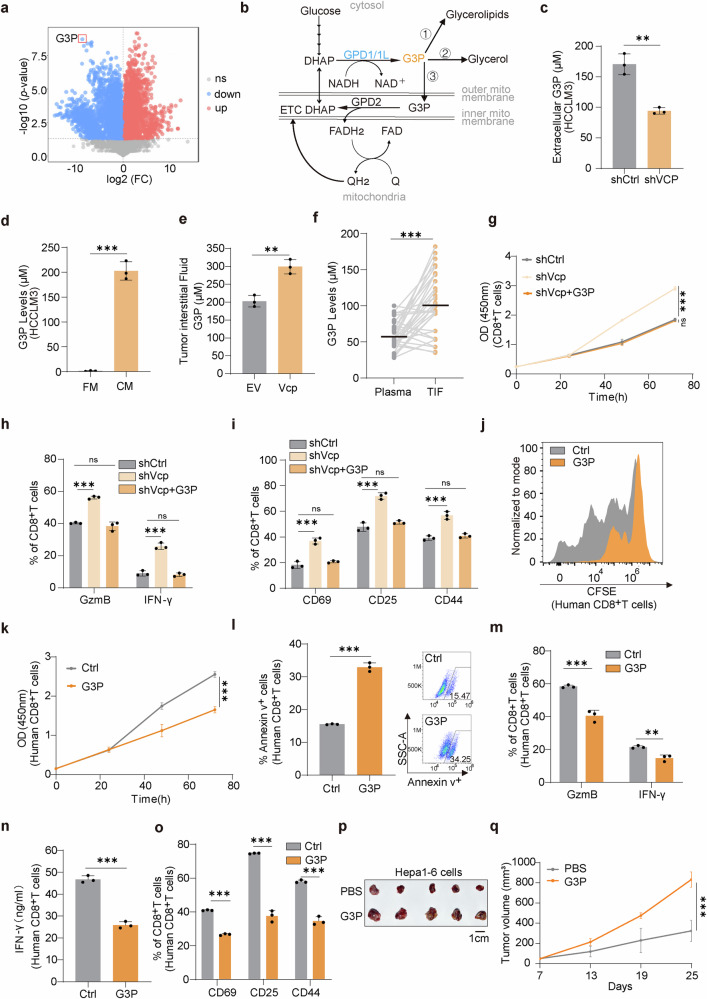
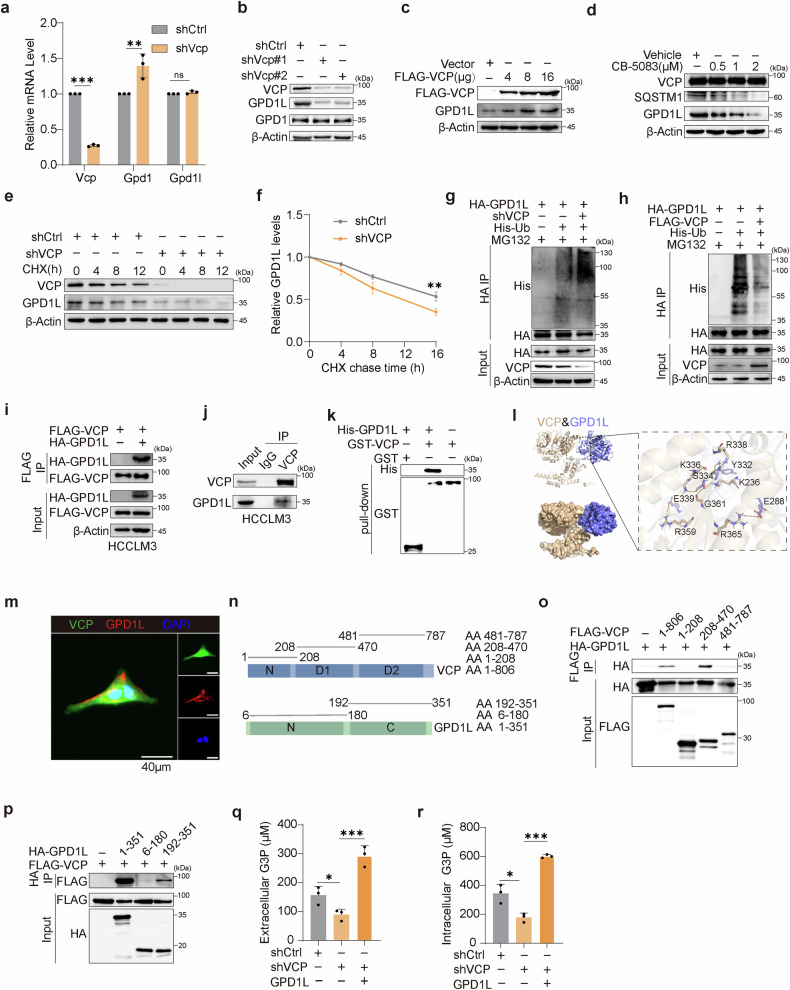
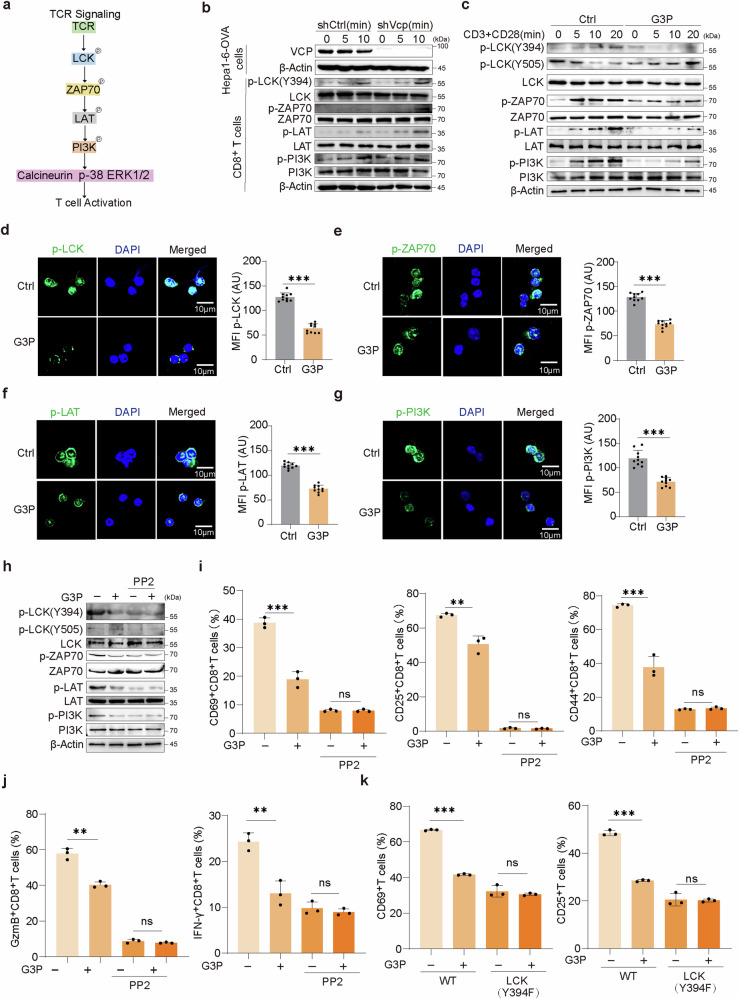
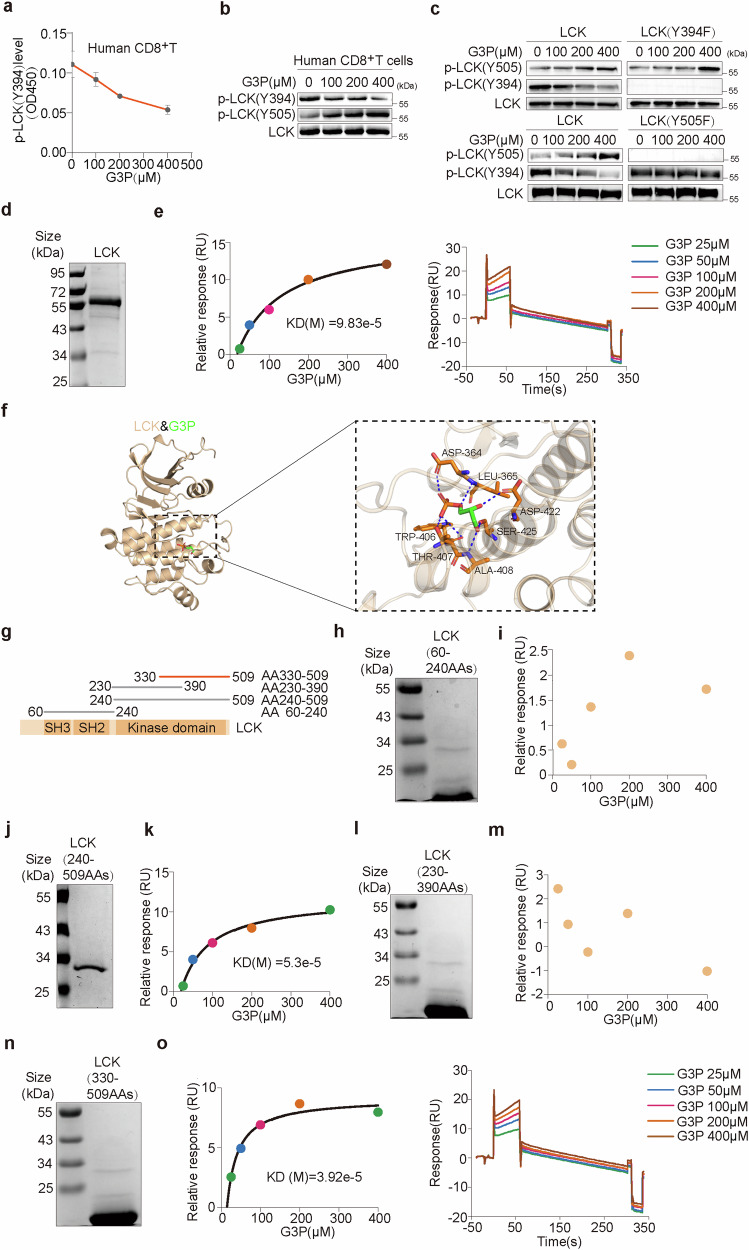
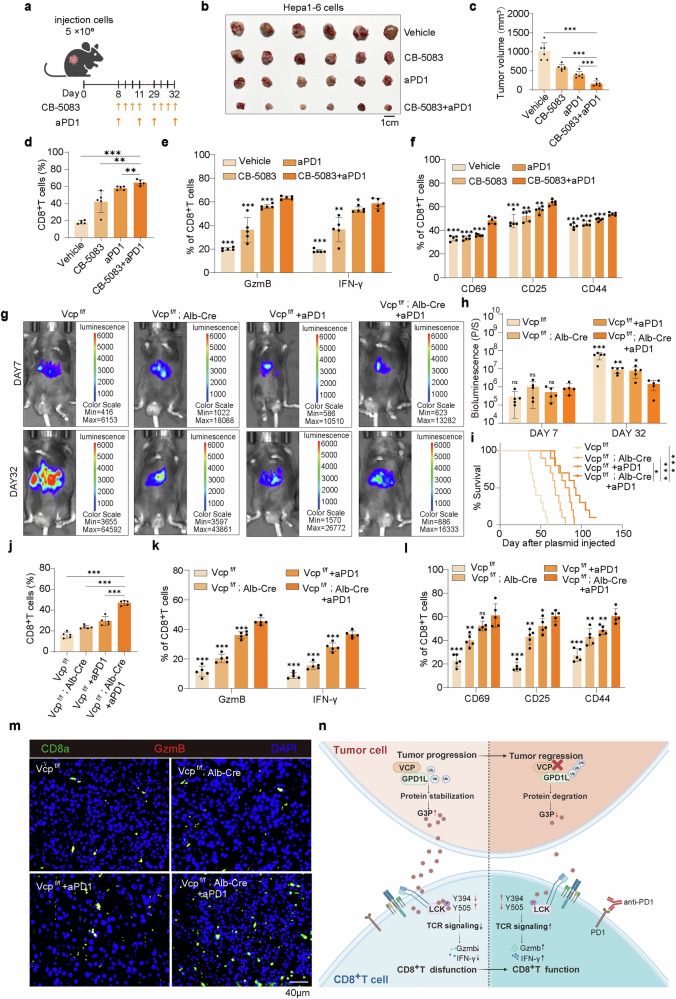
CD8+T cells within the tumor microenvironment (TME) are often functionally impaired, which limits their ability to mount effective anti-tumor responses. However, the molecular mechanisms behind this dysfunction remain incompletely understood. Here, we identified valosin-containing protein (VCP) as a key regulator of CD8+T cells suppression in hepatocellular carcinoma (HCC). Our findings reveal that VCP suppresses the activation, expansion, and cytotoxic capacity of CD8+T cells both in vitro and in vivo, significantly contributing to the immunosuppressive nature of the TME. Mechanistically, VCP stabilizes the expression of glycerol-3-phosphate dehydrogenase 1-like protein (GPD1L), leading to the accumulation of glycerol-3-phosphate (G3P), a downstream metabolite of GPD1L. The accumulated G3P diffuses into the TME and directly interacts with SRC-family tyrosine kinase LCK, a critical component of the T-cell receptor (TCR) signaling pathway in CD8+T cells. This interaction heightens the phosphorylation of Tyr505, a key inhibitory residue, ultimately reducing LCK activity and impairing downstream TCR signaling. Consequently, CD8+T cells lose their functional capacity, diminishing their ability to fight against HCC. Importantly, we demonstrated that targeting VCP in combination with anti-PD1 therapy significantly suppresses HCC tumor growth and restores the anti-tumor function of CD8+T cells, suggesting synergistic therapeutic potential. These findings highlight a previously unrecognized mechanism involving VCP and G3P in suppressing T-cell-mediated immunity in the TME, positioning VCP as a promising upstream target for enhancing immunotherapy in HCC.


Conflict of interest statement

Competing interests: The authors declare no competing interests.

Figures

Fig. 1
Fig. 1
VCP impairs CD8+T cells infiltration, activation, and effector function to promote HCC progression. a, b Representative images of tumor volumes from Hepa1-6-bearing nude and C57BL/6 mice sacrificed on day 31. The average sizes of tumors were measured and plotted (n = 5/group). Mean values ± SEM. Two-way ANOVA. c Schematic illustrating transposon- and CRISPR-Cas9-based injection of vectors into mice via the tail vein to generate liver tumors resembling human HCC. The transposon-based vector overexpressing Myc can express luciferase. Schematic created with BioRender.com. d, e Bioluminescence images of C57BL/6 mice at indicated time points after plasmid injection. Bioluminescence signal at indicated time points post plasmid injection in C57BL/6 mice. f Representative images of livers from (d). g Kaplan–Meier survival curve of C57BL/6 mice treated as in (d). Log-rank test. h, i t-SNE analysis of scRNA-seq data of 4 subclusters from CD8+T cells. j, k Representative images of tumor volumes from Hepa1-6-bearing C57BL/6 mice treated with anti-CD8 and sacrificed on day 25 (n = 5/group). Mean values ± SEM. Two-way ANOVA. ln The percentage of CD8+T cells (l), cytokines production (Granzyme B, IFN-γ) (m), and activation indicators (CD69, CD25, CD44) (n) in spontaneous tumor were measured by flow cytometry (n = 5/group). o Representative tissue microarray (TMA) images for VCP, CD8a, and GzmB immunohistochemistry in 90 HCC patients. p The IHC staining was scored, and correlation analyses were performed (n = 90 patients). The Pearson correlation test was used. q Signature score of VCP and CD8A expression in patient #3 and #4. r Patients clinical samples were stained with multiple immunofluorescence for DAPI, CD8a, GzmB, and VCP. Data are presented as mean values ± SD. Statistical significance was determined using two-sided t-tests, *P < 0.05, **P < 0.01, and ***P < 0.001
Fig. 2
Fig. 2
VCP inhibits CD8+T cells function via metabolite-mediated mechanism. a OT-1 CD8+T cells co-cultured with shCtrl or shVcp Hepa1-6-OVA cells. b Cytotoxicity assessed by measuring lactate dehydrogenase (LDHA) release from Hepa1-6-OVA cells (n = 3). c The percentage of Annexin v+ CD8+T cells co-cultured with shCtrl or shVcp Hepa1-6-OVA cells was determined by flow cytometry (n = 3). d The percentage of cytokines produced by CD8+T cells co-cultured with tumor cells was measured by flow cytometry (n = 3). e Schematic diagram showing OT-1 CD8+T cells co-cultured with shCtrl or shVcp Hepa1-6-OVA cells using a Transwell system. f The percentage of Annexin v+ CD8+T cells in Transwell system was determined by flow cytometry (n = 3). g The proliferation of CD8+T cells in Transwell system was measured by CFSE assay. h The percentage of cytokines produced by CD8+T cells in Transwell system was measured by flow cytometry (n = 3). i Schematic diagram showing CD8+T cells cultured with conditioned medium (CM) produced by shCtrl or shVcp Hepa1-6-OVA cells. j The proliferation of CD8+T cells cultured with CM produced by shCtrl or shVcp Hepa1-6-OVA cells was measured by CFSE assay. k The percentage of cytokines produced by CD8+T cells cultured with CM produced by shCtrl or shVcp Hepa1-6-OVA cells was measured by flow cytometry (n = 3). l Secreted IFN-γ levels by CD8+T cells cultured with CM produced by shCtrl or shVcp Hepa1-6-OVA cells (n = 3). m Schematic diagram showing CD8+T cells cultured with >/<3 kDa CM produced by shCtrl or shVcp Hepa1-6-OVA cells. n The percentage of cytokines produced by CD8+T cells cultured with >/<3 kDa CM produced by shCtrl or shVcp Hepa1-6-OVA cells was measured by flow cytometry (n = 3). o The proliferation of CD8+T cells cultured with >/<3 kDa CM produced by shCtrl or shVcp Hepa1-6-OVA cells was measured by CCK8 assay (n = 3). Two-way ANOVA. p The proliferation of human CD8+T cells cultured with >/<3 kDa CM produced by shCtrl or shVCP HCCLM3 cells was measured by CFSE assay. q The percentage of cytokines produced by human CD8+T cells cultured with >/<3 kDa CM produced by shCtrl or shVCP HCCLM3 cells was measured by flow cytometry (n = 3). r The expression of activation indicators in human CD8+T cells cultured with >/<3 kDa CM produced by shCtrl or shVCP HCCLM3 cells was determined by flow cytometry (n = 3). Data are presented as mean values ± SD. Statistical significance was determined using two-sided t-tests, *P < 0.05, **P < 0.01, and ***P < 0.001
Fig. 3
Fig. 3
VCP acts through downstream metabolite G3P. a Volcano plot representing metabolite changes in conditional medium from shVCP HCCLM3 cells compared with Control. b Schematic of G3P metabolism. c Extracellular G3P levels in shCtrl or shVCP HCCLM3 cells (n = 3). d G3P levels in fresh medium (FM) and conditional medium (CM) from HCCLM3 cells (n = 3). e G3P levels in interstitial fluid of spontaneous tumors (n = 3). f G3P levels in tumor interstitial fluid (TIF) and plasma from HCC patients (n = 31). g The proliferation of CD8+T cells co-cultured with shCtrl or shVcp Hepa1-6-OVA cells or treated with G3P using a Transwell system was measured by CCK8 assay (n = 3). Two-way ANOVA. h, i The percentage of cytokines production (h) and activation indicators (i) of CD8+T cells treated as in (g) were measured by flow cytometry (n = 3). j The proliferation of human CD8+T cells treated with G3P was measured by CFSE assay. k The proliferation of human CD8+T cells treated with G3P was measured by CCK8 assay (n = 3). Two-way ANOVA. l The percentage of Annexin v+ human CD8+T cells treated with G3P was determined by flow cytometry (n = 3). m The percentage of cytokines produced by human CD8+T cells treated with G3P was measured by flow cytometry (n = 3). n Secreted IFN-γ levels by human CD8+T cells treated with G3P. Analysis was performed after 24 h (n = 3). o The expression of activation indicators in human CD8+T cells treated with G3P was determined by flow cytometry (n = 3). p, q Representative images of tumor volumes from Hepa1-6-bearing C57BL/6 mice after intratumoral injection of PBS/G3P and sacrificed on day 25 (n = 5/group). Mean values ± SEM. Two-way ANOVA. Data are presented as mean values ± SD. Statistical significance was determined using two-sided t-tests, *P < 0.05, **P < 0.01, and ***P < 0.001
Fig. 4
Fig. 4
VCP maintains GPD1L stability to accumulate G3P in HCC. a qPCR analysis assessing expression of Vcp, Gpd1, and Gpd1l in Hepa1-6 cells stably expressing shCtrl or shVcp (n = 3). b Immunoblot analysis of the indicated proteins in Hepa1-6 cells stably expressing shCtrl or shVcp. c Immunoblot analysis of the indicated proteins in HCCLM3 cells transfected with increasing amounts of FLAG-VCP. d Immunoblot analysis of the indicated proteins in HCCLM3 cells treated with gradient concentrations of CB-5083 or Vehicle for 24 h. e, f Immunoblot analysis of the indicated proteins in shCtrl or shVCP HCCLM3 cells treated with or without 100 μg/mL CHX for the indicated times. Relative GPD1L protein levels (GPD1L:β-Actin) are shown in (f). g, h Immunoblot analysis of HA beads pull-down products and input derived from HCCLM3 cells treated with 10 μM MG132 for 8 h and co-transfected with the indicated plasmids for 48 h. i Immunoblot analysis of FLAG beads pull-down products and input derived from HCCLM3 cells co-transfected with the indicated plasmids for 48 h. j HCCLM3 cell lysates were subject to immunoprecipitation with control IgG, anti-VCP antibodies. The immunoprecipitates were then blotted. k GST pull-down assay was performed by mixing recombinant GST-VCP with pre-immunoprecipitated His-GPD1L protein. l The interaction between VCP and GPD1L was speculated using three-dimensional structures. m Immunofluorescence analysis to detect colocalization of VCP and GPD1L in HCCLM3 cells. n Schematic of VCP and GPD1L structures. o Immunoblot analysis of FLAG beads pull-down products and input derived from 293T cells transfected with HA-GPD1L and FLAG-tagged indicated constructs. p Immunoblot analysis of HA beads pull-down products and input derived from 293T cells transfected with FLAG-VCP and HA-tagged indicated constructs. q Extracellular G3P levels in shCtrl and shVCP HCCLM3 cells transfected with or without HA-GPD1L for 48 h (n = 3). r Intracellular G3P levels in shCtrl or shGPD1L HCCLM3 cells transfected with or without HA-GPD1L for 48 h (n = 3). Data are presented as mean values ± SD. Statistical significance was determined using two-sided t-tests, *P < 0.05, **P < 0.01, and ***P < 0.001
Fig. 5
Fig. 5
G3P inhibits CD8+T cells through LCK signaling. a The TCR signaling pathway. b CD8+T cells co-cultured with shCtrl or shVcp Hepa1-6-OVA cells were activated for 5 or 10 min or unstimulated (0). Cell lysates were analyzed by western blot (WB). c Mouse naive CD8+T cells treated with G3P or untreated (Ctrl) were activated for the indicated times. Cell lysates were analyzed by western blot (WB). dg Left, mouse naive CD8+T cells treated with G3P or untreated (Ctrl) followed by stimulation were subjected to immunostaining and confocal microscopic imaging. Right, quantification of the mean fluorescence intensity. h Immunoblot analysis of the indicated proteins in mouse CD8+T cells treated with G3P and/or PP2 during stimulation. i The expression of activation indicators in mouse CD8+T cells treated with G3P and/or PP2 was determined by flow cytometry (n = 3). j The percentage of cytokines produced by mouse CD8+T cells treated with G3P and/or PP2 was measured by flow cytometry (n = 3). k Jurkat T cells expressing WT–LCK or the LCK(Y394F) mutant were treated with G3P or untreated. The expression of activation indicators was determined by flow cytometry (n = 3). Data are presented as mean values ± SD. Statistical significance was determined using two-sided t-tests, *P < 0.05, **P < 0.01, and ***P < 0.001
Fig. 6
Fig. 6
G3P directly interacts with LCK and suppresses its activity. a The p-LCK(Y394) levels of human CD8+T cells treated with gradient concentrations of G3P. b Immunoblot analysis of the indicated proteins in human CD8+T cells treated with gradient concentrations of G3P. c In vitro kinase assay using purified LCK and its mutants incubated with ATP and increasing amounts of G3P. d Purified LCK protein was analyzed by SDS–PAGE, followed by Coomassie blue staining. e BIAcore measurement of the interaction between G3P and the purified LCK. f The interaction between LCK and G3P were speculated using three-dimensional structures. g Schematic of LCK structure. h Purified region LCK (60-240AAs) was analyzed by SDS–PAGE, followed by Coomassie blue staining. i BIAcore measurement of the interaction between G3P and the purified region. j Purified region LCK(240-509AAs) was analyzed by SDS–PAGE, followed by Coomassie blue staining. k BIAcore measurement of the interaction between G3P and the purified region. l Purified region LCK(230-390AAs) was analyzed by SDS–PAGE, followed by Coomassie blue staining. m BIAcore measurement of the interaction between G3P and the purified region. n Purified region LCK(330-509AAs) was analyzed by SDS–PAGE, followed by Coomassie blue staining. o BIAcore measurement of the interaction between G3P and the purified region
Fig. 7
Fig. 7
Targeting VCP combined with anti-PD1 modulates the TME of HCC. a Treatment schema of Hepa1-6 tumor-bearing C57BL/6 mice. Schematic created with BioRender.com. b Hepa1-6 tumors were dissected from the C57BL/6 mice treated with vehicle, CB-5083, aPD1, or both (n = 6/group). c Data from (b). df The percentage of CD8+T cells, cytokines production (Granzyme B, IFN-γ), and activation indicators (CD69, CD25, CD44) in Hepa1-6 tumors were measured by flow cytometry analysis (n = 5/group). g, h Bioluminescence images of conditional knockout mice at indicated time points after plasmid injection. Bioluminescence signal at indicated time points post plasmid injection in Vcp conditional knockout mice. i Kaplan–Meier survival curve of conditional knockout mice treated as in (g). Log-rank test. jl The percentage of CD8+T cells, cytokines production (Granzyme B, IFN-γ), and activation indicators (CD69, CD25, CD44) with spontaneous tumors in Vcp conditional knockout mice were measured by flow cytometry (n = 5/group). m Spontaneous tumor sections of conditional knockout mice were stained with multiple immunofluorescence. n Schematic summary graph of the main conclusion of the study. Tumor cells VCP promotes the generation of G3P through stabilizing GPD1L, which then impairs TCR signaling and causes CD8+T cells dysfunction. Schematic created with BioRender.com. Data are presented as mean values ± SD. Statistical significance was determined using two-sided t-tests, *P < 0.05, **P < 0.01, and ***P < 0.001

Similar articles

Cited by

References

    1. Vogel, A., Meyer, T., Sapisochin, G., Salem, R. & Saborowski, A. Hepatocellular carcinoma. Lancet400, 1345–1362 (2022). - PubMed
    1. Sangro, B. et al. A randomized, multicenter, phase 3 study of nivolumab vs sorafenib as first-line treatment in patients (pts) with advanced hepatocellular carcinoma (HCC): CheckMate-459. J. Clin. Oncol. 34, TPS4147-TPS4147 (2016).
    1. Yang, C. et al. Evolving therapeutic landscape of advanced hepatocellular carcinoma. Nat. Rev. Gastroenterol. Hepatol.20, 203–222 (2023). - PubMed
    1. Zhu, A. X. et al. Pembrolizumab in patients with advanced hepatocellular carcinoma previously treated with sorafenib (KEYNOTE-224): a non-randomised, open-label phase 2 trial. Lancet Oncol.19, 940–952 (2018). - PubMed
    1. Llovet, J. M. et al. Adjuvant and neoadjuvant immunotherapies in hepatocellular carcinoma. Nat. Rev. Clin. Oncol.21, 294–311 (2024). - PMC - PubMed

MeSH terms

Substances