. 2025 Feb;10(2):448-467.
doi: 10.1038/s41564-024-01915-3. Epub 2025 Jan 23.

KorB switching from DNA-sliding clamp to repressor mediates long-range gene silencing in a multi-drug resistance plasmid

Affiliations

KorB switching from DNA-sliding clamp to repressor mediates long-range gene silencing in a multi-drug resistance plasmid

Thomas C McLean et al. Nat Microbiol. 2025 Feb.

Abstract

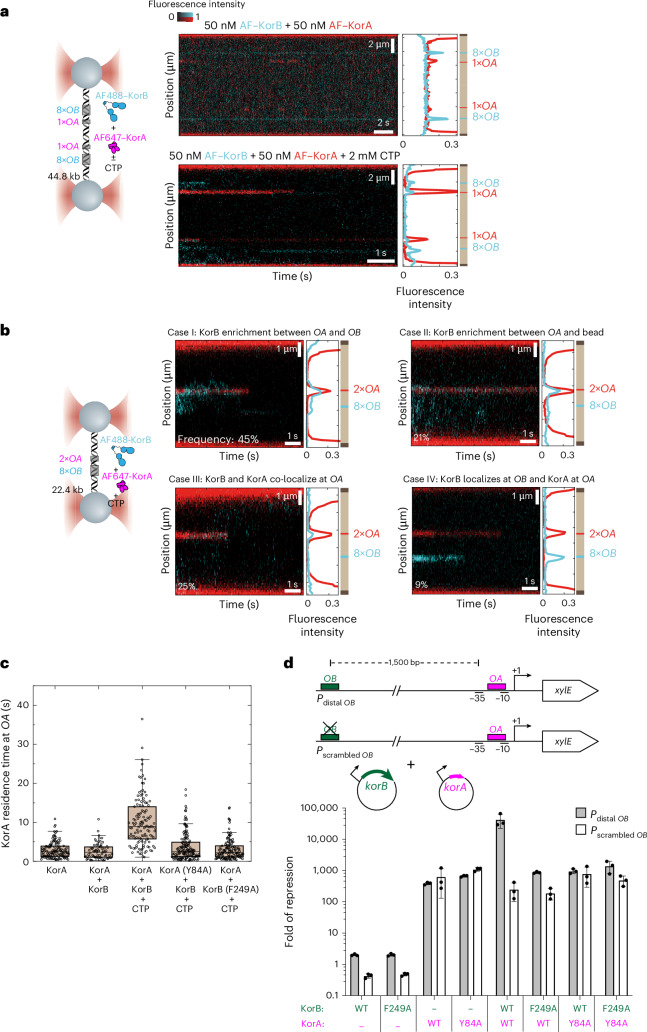
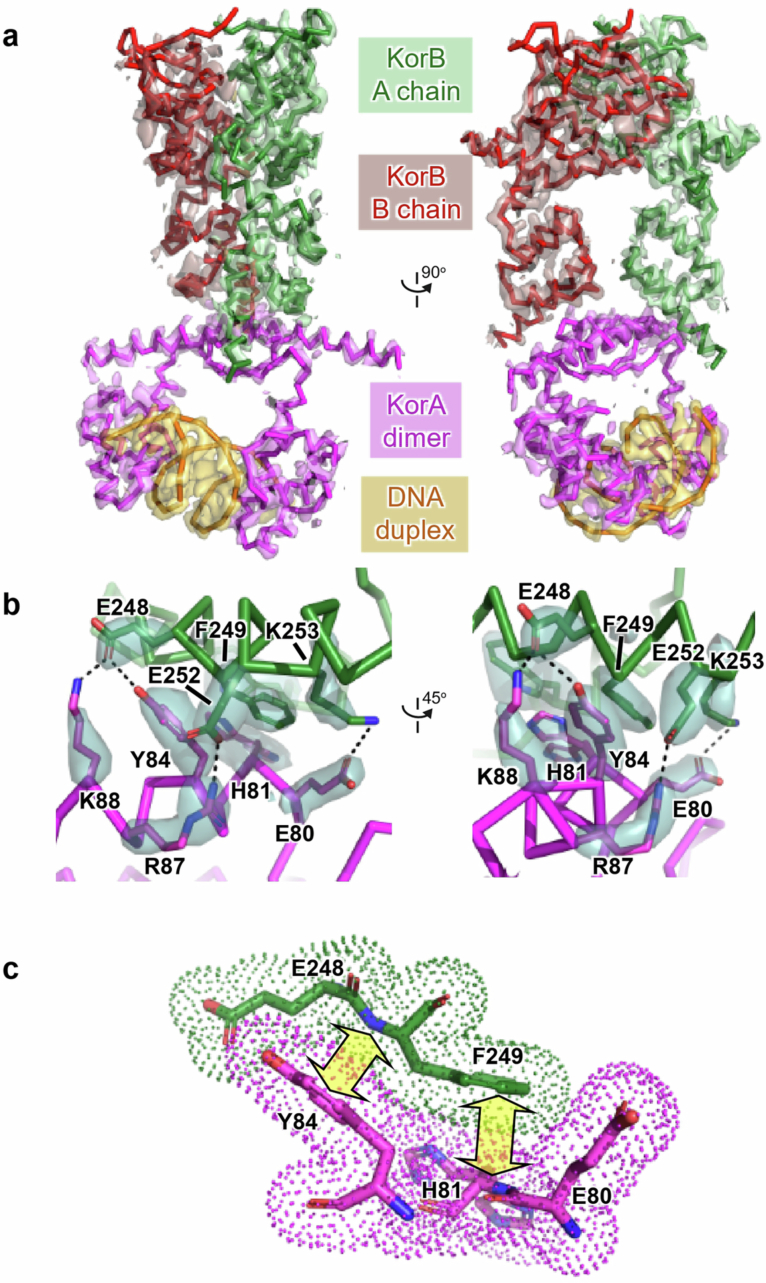
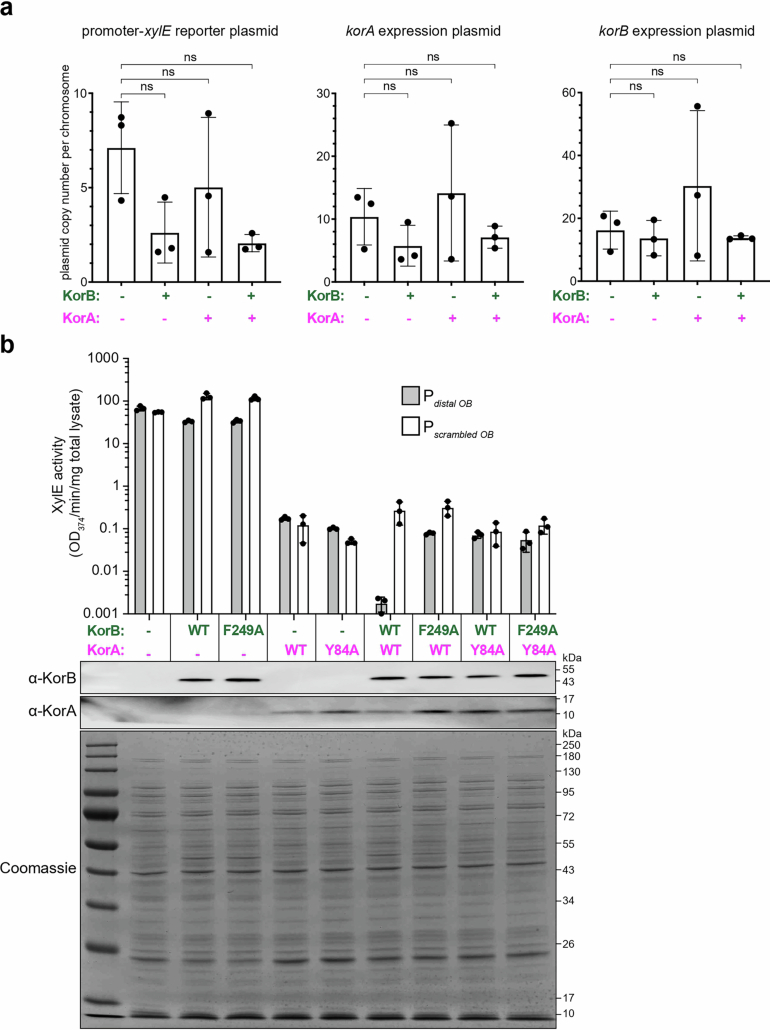
Examples of long-range gene regulation in bacteria are rare and generally thought to involve DNA looping. Here, using a combination of biophysical approaches including X-ray crystallography and single-molecule analysis for the KorB-KorA system in Escherichia coli, we show that long-range gene silencing on the plasmid RK2, a source of multi-drug resistance across diverse Gram-negative bacteria, is achieved cooperatively by a DNA-sliding clamp, KorB, and a clamp-locking protein, KorA. We show that KorB is a CTPase clamp that can entrap and slide along DNA to reach distal target promoters up to 1.5 kb away. We resolved the tripartite crystal structure of a KorB-KorA-DNA co-complex, revealing that KorA latches KorB into a closed clamp state. DNA-bound KorA thus stimulates repression by stalling KorB sliding at target promoters to occlude RNA polymerase holoenzymes. Together, our findings explain the mechanistic basis for KorB role switching from a DNA-sliding clamp to a co-repressor and provide an alternative mechanism for long-range regulation of gene expression in bacteria.


Conflict of interest statement

Competing interests: The authors declare no competing interests.

Figures

Fig. 1
Fig. 1. KorB binds and hydrolyses CTP in the presence of OB DNA.
a, The domain architecture of KorB: an intrinsically disordered region (IDR) IncC (ParA)-interacting peptide, the NTD, a central OB DBD, a predicted flexible 53-amino acid linker and a CTD. The KorB∆N30∆CTD variant that was used for crystallization lacks the 30 N-terminal amino acids, the linker and the CTD (faded green). b, Analysis of the interaction of KorB (WT and mutants) with CTP by ITC. Each experiment was duplicated. The y-axes show a measured power differential (DP) between the reference and sample cells to maintain a zero temperature between the cells, and enthalpy (∆H) of binding. c, Co-crystal structure of a KorB∆N30∆CTD–CTPɣS complex reveals a CTP-binding pocket and a closed conformation at the NTD of KorB. Top: the front view of the co-crystal structure of KorB∆N30∆CTD (dark green and grey) bound to a non-hydrolysable analogue CTPɣS (orange). Bottom: the top view of the KorB∆N30∆CTD–CTPɣS co-crystal structure. d, The protein–ligand interaction map of CTPɣS bound to KorB∆N30∆CTD. Hydrogen bonds are shown as dashed green lines and hydrophobic interactions as red semi-circles. We did not observe electron density for Mg2+ in the CTP-binding pocket. N146 does not make contact with CTPɣS; however, mutations at the equivalent residue in ParB were previously reported to disrupt CTP hydrolysis,, and thus N146 was also selected for mutagenesis in this study. e, NTP hydrolysis rates of KorB (WT and variants) were measured at increasing concentrations of NTP. Experiments were triplicated. Source data
Fig. 2
Fig. 2. CTP and OB DNA promote the engagement of the NTD of KorB in vitro and are essential for KorB to repress transcription from a distance.
a, SDS–PAGE analysis of BMOE crosslinking products of 8 µM of KorB (S47C) dimer (and variants) ± 1 µM 24 bp OB/scrambled (SCR) DNA ± 1 mM CTP. X indicates a crosslinked form of KorB. Sub-stoichiometric concentration of OB DNA was sufficient to promote efficient crosslinking of KorB (S47C) (Extended Data Fig. 2b). The S47C substitution did not impact the OB-mediated repression function of KorB (Extended Data Fig. 2c). Quantification of the crosslinked fraction is shown below each representative image. Data are represented as mean values ± s.d. from three replicates. b, CTP binding promotes the diffusion of KorB on DNA containing OB sites. Left: schematic of the C-trap optical tweezers experiment where DNA containing one or two clusters of 8×OB sites were tethered between two beads and scanned with a confocal microscope using 488 nm illumination. A 44.8 kb DNA was constructed from ligating together two identical tandem 22.4 kb DNA, each containing 8×OB and 1×OA site (Methods). The OA site is omitted from the diagram for simplicity. Right: representative kymographs showing the binding of KorB at the OB cluster in the presence or absence of CTPɣS or CTP. Scale bars represent fluorescence intensity on the kymographs. Kymographs were taken in a buffer-only channel, after 60 s incubation in the protein channel, to reduce the fluorescence background. c, CTP-dependent N engagement is essential for KorB to repress transcription from a distance. Left: schematic diagrams of promoter–xylE reporter constructs. Right: values shown are fold of repression, which is a ratio of XylE activities from cells co-harbouring a reporter plasmid and a KorB-expressing plasmid to that of cells co-harbouring a reporter plasmid and an empty plasmid (KorB-minus control). Data are represented as mean values ± s.d. from three replicates. See Extended Data Fig. 2c for the absolute values of XylE activities and an α-KorB immunoblot from lysates of cells used in the same experiments. Source data
Fig. 3
Fig. 3. KorA promotes the N engagement of KorB independent of CTP and OB DNA in vitro.
a, The domain architecture of KorB (same as Fig. 1a) and KorA. The KorB∆N30∆CTD variant that was used for crystallization lacks the 30 N-terminal amino acids, the linker and the CTD (faded green). KorA has an N-terminal OA DNA-binding domain (NTD) and a C-terminal dimerization domain (CTD). b, SDS–PAGE analysis of BMOE crosslinking products of 8 µM of KorB (S47C) dimer (or the variant S47C F249A) ± 8 µM of KorA dimer (WT or the variant Y84A) ± 1 µM 24 bp OB/scrambled OB DNA ± 1 mM CTP. X indicates a crosslinked form of KorB. Quantification of the crosslinked fraction is shown below each representative image. Data are represented as mean values ± s.d. from three replicates. c, Analysis of the interaction of KorB with KorA by ITC. The experiment was duplicated. d, KorA–DNA docks onto the DBD of a clamp-closed KorB in the co-crystal structure of a KorB∆N30∆CTD–KorA–DNA complex. Left: the side view of the co-crystal structure of KorB∆N30∆CTD (dark green and light green) bound to a KorA (magenta and pink) on a 14 bp OA DNA duplex (black). Right: The front view of the KorB∆N30∆CTD–KorA–DNA co-crystal structure. e, Helix α10 (dark green) of KorB interacts with helix α5 (magenta) of KorA. Hydrogen bonds are shown as dashed lines, pi-stacking interaction between the aromatic ring of Y84 in KorA with the E248–F249 peptide bond of KorB and between the aromatic ring of F249 in KorB with the E80–H81 peptide bond of KorB are shown as black semi-circles (Extended Data Fig. 6b,c). Source data
Fig. 4
Fig. 4. KorA can block the diffusion of KorB on DNA, and KorB increases the residence time of KorA at its operator OA.
a, Left: schematic of the C-trap optical tweezers experiment with positions of 8×OB and 1×OA clusters indicated. Right: representative kymograph showing the binding of AF488-labelled KorB and AF647-labelled KorA ± CTP. The upper panel kymograph was taken in a channel containing fluorescently labelled KorAB, hence the higher fluorescence background. The lower panel kymograph was taken in a buffer-only channel to reduce the fluorescence background. b, Left: schematic of the C-trap optical tweezers experiment. Right: representative kymographs of AF647–KorA and AF488–KorB in the presence of CTP for the four described cases. The frequency of occurrence for each case is indicated on the kymographs (the total number of recorded events n = 182). Kymographs were taken in a buffer-only channel, after a 60 s incubation in the protein channel, to reduce fluorescence background. c, Box plot showing the residence times (mean ± s.e.m.) of AF647–KorA alone (2.9 ± 0.2 s, n = 122), in the presence of KorB (2.6 ± 0.2 s, n = 70) or KorB–CTP (10.1 ± 0.6 s, n = 125), that of AF647–KorA (Y84A) in the presence of KorB–CTP (3.7 ± 0.3 s, n = 148), and that of AF647–KorA in the presence of KorB (F249A) and 2 mM CTP (3.1 ± 0.2 s, n = 126) (see Extended Data Fig. 7b for representative kymographs). Box plots indicate the median and the 25th and 75th percentiles of the distribution, and whiskers extending to data within 1.5× interquartile range. Outliers are displayed as points beyond the whiskers. d, KorA captures the KorB–CTP clamp to heighten long-range transcriptional repression. Top: schematic diagrams of promoter–xylE reporter constructs. Bottom: values shown are fold of repression, which is a ratio of XylE activities from cells co-harbouring a reporter plasmid and KorB/A-expressing plasmid to that of cells co-harbouring a reporter plasmid and an empty plasmid (KorA/B-minus control). Data are represented as mean values ± s.d. from three replicates (Extended Data Fig. 8b). Source data
Fig. 5
Fig. 5. KorA and KorB exploit unstable E. coli RNAP:PkorA DNA complexes to repress transcription initiation.
a, Promoter scaffold from the RK2 korABF operon (PkorA) is shown with core promoter elements (underlined), OA (magenta box), and OB (green box). Differences to the PkorAPR discriminator are depicted. b, Deconvolved nMS spectra of E. coli70 holoenzyme assembled on 100 bp PkorA DNA (Eσ70:DNA) with and without 2.5-fold excess KorA dimer in 150 mM ammonium acetate pH 7.5 and 0.01% Tween-20. c, Deconvolved nMS spectra of Eσ70:DNA with and without 2.5-fold excess KorB dimer in 500 mM ammonium acetate pH 7.5 and 0.01% Tween-20. d, Top: representative gel close-up on the abortive RNA product (5′-ApUpG-3′) transcribed by Eσ70 in in vitro abortive initiation half-life assays on the two PkorA linear scaffold variants. Bottom: plot of fraction of competitor-resistant open complexes (from normalized abortive RNA band intensities) against time. Data points from three experimental replicates are mean values ± s.e.m. with an exponential trend line fit. Some error bars are too small or lead to negative values and thus were omitted. Estimated half-lives are shown adjacent to exponential decay trend lines. e, WT PkorA and PkorAPR discriminator in vitro transcription repression of Eσ70 in the presence of fivefold excess KorA and/or KorB. Data points from at least three experimental replicates are normalized to holoenzyme only control as mean values ± s.e.m. Eσ70 + KorA and Eσ70 + KorA + KorB conditions on WT PkorA has n = 4, while the rest are n = 3; this remains valid as repression quantities are normalized to a Eσ70-only control and background-corrected for each gel run, and s.e.m. are considered in statistical analysis. P values were calculated by unpaired two-tailed Welch’s t-tests; *P ≤ 0.05, **P ≤ 0.01, ***P ≤ 0.001. The P values are 3.66 × 10−3 (Eσ70 + KorA), 0.635 × 10−3 (Eσ70 + KorB) and 31.5 × 10−3 (Eσ70 + KorA + KorB). Source data
Fig. 6
Fig. 6. A proposed model for the CTP-dependent clamp-sliding activity of KorB, clamp-locking activity of KorA and their cooperation to heighten long-range transcription repression.
a, KorB (dark green) loading, sliding, and release cycle. Loading KorB is likely an open clamp, in which OB DNA binds at the DBD. The presence of CTP (orange) and OB DNA likely triggers KorB clamp closing. In this state, KorB can slide away from the OB site by diffusion while entrapping DNA. CTP hydrolysis and/or the release of hydrolytic products (CDP and inorganic phosphate Pi) likely reopen the clamp to release DNA. Substitutions that affect various KorB functions are also indicated on the schematic diagram. KorA (magenta) bound at OA can form a complex with and promote or trap KorB in a closed clamp state. In this state, KorB most likely still entraps DNA. The tripartite KorAB–DNA reduces the release of KorB from DNA as well as the release of KorA from OA DNA. b, A model for KorA–KorB cooperation to enhance long-range transcription repression. On RK2, OB can position kilobases away from the target core promoter elements while OA is almost invariably near these core promoter elements. Owing to an unfavourable discriminator sequence, the RNAP holoenzyme–promoter DNA complex is inherently unstable. In the absence of KorB–CTP, KorA binds OA with a low retention time, thus only providing an unstable steric hindrance to occlude RNAP (magenta) from the core promoter elements, resulting in weak transcriptional repression. In the presence of CTP, KorB loads at a distal OB site, binds CTP, closes the clamp and slides by diffusion to reach the distal OA site. OA-bound KorA captures and locks KorB in a clamp-closed conformation. In this state, the KorAB–DNA co-complex presents a larger and more stable steric hindrance. As a result, the KorAB–DNA co-complex can exploit the unstable RPo and occludes RNAP more effectively, hence stronger transcriptional repression than each protein alone can provide.
Extended Data Fig. 1
Extended Data Fig. 1. KorB is a CTPase enzyme.
a, A sequence alignment between KorB, Caulobacter crescentus ParB (CParB), and Bacillus subtilis ParB (BParB). Residues R117, N146, and A115 (red) of KorB are indicated on its amino acid sequence. The position of the P-motif 2 (GARRYR for KorB and GERRxR for canonical ParB), and the N-terminal ParB/Srx-like domain are also indicated on the sequence alignment. Residues S47 or K351C (blue) were substituted by cysteine to generate KorB (S47C) and KorB (K351C) variants which were subsequently used in BMOE crosslinking assays (Fig. 2a and Extended Data Fig. 2a). Residue F249 of KorB that contacts Y84 of KorA is shown with a black arrow (see also Fig. 3e and Extended Data Fig. 6c). b, Analysis of the interaction of KorB with CDP and CTPɣS by ITC. KorB binding to CDP was qualitatively much weaker than to CTP, but the data precluded the estimation of a binding affinity through curve fitting. Each experiment was duplicated. Regression curves were fitted, and binding affinities (KD) were shown. c, An omit difference map for CTPγS was calculated after removing the ligands from the final structure and re-refining to convergence at 2.3 Å resolution. Shown are orthogonal views of the two ligands from the chain A-B dimer only, together with their associated omit density displayed as a semi-transparent cyan surface contoured at 2.0 σ. It was not possible to unambiguously assign the positions of the ligand sulfur atoms, thus they were modeled as CTP molecules. d, CTP hydrolysis rates of KorB, C. crescentus ParB, and B. subtilis Noc were measured by continuous detection of released inorganic phosphates (see Methods). CTPase rates were measured at 1 mM concentrations of CTP and in the presence of 0.5 µM of cognate DNA duplexes. Data are represented as mean values ± SD from five replicates. Source data
Extended Data Fig. 2
Extended Data Fig. 2. CTP and OB DNA promote the engagement of the N-terminal domain of KorB in vitro and are essential for KorB to repress transcription from a distance.
a, (left panel) KorB is cysteine-less and did not crosslink in the presence of BMOE. (right panel) The CTD of KorB is likely a constant dimerization domain, as judged by the crosslinking of KorB (K351C) variant. K351C is predicted to be crosslinkable based on symmetry-related interactions observed in the previously published crystal structure of KorB CTD (PDB: 1IGQ). SDS-PAGE analysis of BMOE crosslinking products of 8 µM of KorB (K351C) dimer (and variants) ± 0.5 µM 24 bp OB/scrambled OB DNA ± 1 mM CTP. X indicates a crosslinked form of KorB. Quantification of the crosslinked fraction is shown below each representative image. Data are represented as mean values ± SD from three replicates. b, Sub-stoichiometric concentrations of OB are sufficient to promote crosslinking of KorB (S47C). SDS-PAGE analysis of BMOE crosslinking products of 8 µM of KorB (S47C) dimer + 1 mM CTP + increasing concentration of 24 bp OB DNA (from 1/128 to 2/1 OB-to-KorB molar ratio). A ratio of ~16-fold less OB DNA to KorB was sufficient to achieve maximal crosslinking. Data are represented as mean values ± SD from three replicates. c, Substitutions S47C, K351C, F249A, R117A, and N146A on KorB and their impact on KorB’s ability to repress OB-proximal or distal promoters, as judged by promoter-xylE reporter assays. (top panel) Values shown are fold of repression, a ratio of XylE activities from cells co-harboring a reporter plasmid and KorB-expressing plasmid to that of cells co-harboring a reporter plasmid and an empty plasmid (KorB-minus control). Data are represented as mean values ± SD from three replicates. (bottom panel) Absolute values of XylE activities from the same assay. An α-KorB immunoblot and loading controls (Coomassie-stained SDS-PAGE) from lysates of cells used in the same experiments are also shown below. Source data
Extended Data Fig. 3
Extended Data Fig. 3. CTP enables KorB diffusion on OB-containing DNA.
a, AF488-KorB did not bind DNA lacking OB site. (left panel) Representative cartoon showing a DNA containing an OA site (but no OB site) trapped between the two beads in the optical tweezers. (upper right panel) A scan showing DNA trapped between two beads, inside a protein channel containing 50 nM AF488-KorB and 2 mM CTP. (lower right panel) the same DNA molecule, after a minute of incubation with AF488-KorB + CTP in the protein channel, was subsequently transferred to a channel with buffer. We did not observe any binding event, only a high background from the fluorescently labeled protein. b, Determination of the diffusion constant of KorB. (left panel) Representative KorB trajectories measured on the DNA (n = 111). (middle panel) Mean squared displacement (MSD) of KorB trajectories for different time intervals (∆t). (right panel) The diffusion constant of KorB (1.61 ± 0.12 µm2/s, mean ± SEM) was calculated as half of the slope of the linear fit of MSD versus ∆t. Box plots indicate the median, the 25th and 75th percentiles of the distribution, and whiskers extending to data within 1.5× interquartile range. Outliers are displayed as points beyond the whiskers. Source data
Extended Data Fig. 4
Extended Data Fig. 4. KorB did not condense a DNA containing 1xOA and 16xOB sites in the presence of CTP or KorA.
(left panel) Cartoon of the basic magnetic tweezers (MT) components and the layout of the experiment, and a schematic representation of a DNA containing 1xOA and a 16xOB cluster. The positions of OA and OB sites are represented to scale. (right panel) Average force-extension curves of bare DNA molecules (n = 56) and in the presence of different dimer concentrations of KorB + 2 mM CTP (500 nM, n = 11, and 1 µM, n = 13) or Bacillus subtilis BsParB + 2 mM CTP (500 nM, n = 11, 1 µM, n = 21 and 2 µM, n = 17), and in the presence of 1 µM KorB + 1 µM KorA + 2 mM CTP (n = 10). Data are represented as mean values ± SEM from three replicates. Source data
Extended Data Fig. 5
Extended Data Fig. 5. KorA interacts with KorB to promote the N-engagement of KorB.
a, SDS-PAGE analysis of BMOE crosslinking products of 8 µM of KorB (S47C) dimer ± 8 µM dimer concentration of KorA + 1 mM CTP ± 1 µM 24 bp DNA containing both OB and OA sites (OB_OA) or both scrambled OB site and OA (OBSCR_OA) or both OB and scrambled OA site (OB_OASCR). X indicates a crosslinked form of KorB (S47C). Quantification of the crosslinked fraction is shown below each representative image. Data are represented as mean values ± SD from three replicates. b, KorA can promote clamp-defective KorB (R117A) and KorB (N146A) variants to N-engage. SDS-PAGE analysis of BMOE crosslinking products of 8 µM of KorB (S47C R117A) dimer and KorB (S47C N146A) dimer ± 8 µM of KorA dimer ± 0.5 µM 24 bp OB/scrambled (SCR) OB DNA ± 1 mM CTP. X indicates a crosslinked form of KorB (S47C R117A) or KorB (S47C N146A). Quantification of the crosslinked fraction is shown below each representative image. Data are represented as mean values ± SD from three replicates. c, Substitutions Y84A on KorA or F249A on KorB eliminated KorA-KorB interaction. Analysis of the interaction of KorB (WT or variant) with KorA (WT or variant) by ITC. Each experiment was duplicated. Regression curves were fitted, and binding affinities (KD) were shown. Source data
Extended Data Fig. 6
Extended Data Fig. 6. Structure of the KorA-KorB-DNA ternary complex.
The crystal structure of the KorA-KorB-DNA complex was determined at 2.7 Å resolution. a, A series of omit difference maps were calculated by separately removing parts of the final structure and re-refining to convergence at 2.7 Å resolution. Maps for KorB chain A (green), KorB chain B (red), the KorA dimer (magenta) and the DNA duplex (orange) are displayed as semi-transparent surfaces on a color-coded backbone trace of the structure, contoured at 2.0 σ and shown as orthogonal views. b, Close-up of a KorB-KorA interface with only the side chains of key residues displayed. Also shown is omit difference density (semi-transparent cyan surface, contoured at 2.0 σ) calculated for the model after the removal of these side chains and re-refining. c, Further detail on the KorB-KorA interface with color-coded van der Waals dots illustrating intimate contact. In addition to the hydrogen bonds highlighted in panel b, the aromatic ring of Y84 in KorA makes pi-pi interactions with the E248-F249 peptide bond of KorB, which is reciprocated by the aromatic ring of F249 in KorB making pi-pi interactions with the E80-H81 peptide bond of KorB. These interactions are indicated by the pale yellow double-headed arrows.
Extended Data Fig. 7
Extended Data Fig. 7. KorA can block the diffusion of KorB on DNA, and KorB increases the residence time of KorA at its operator OA.
a, KorA can block the diffusion of KorB on DNA. (left panel) Schematic of the C-trap optical tweezers experiments where a DNA containing a cluster of 8xOB sites and 2xOA sites was tethered between two beads and scanned with a confocal microscope using 488 nm and 635 nm illumination. (right panel) More representative kymographs showing the distribution of AF647-KorA and AF488-KorB in the presence of CTP along a DNA for the four cases described. The frequency of occurrence for each case is indicated (the total number of recorded events n = 182). Kymographs were taken in a buffer-only channel to reduce fluorescence background, following a 60 s incubation in the protein channel. b, KorB increases the residence time of KorA at OA. (left panel) Schematic of the C-trap optical tweezers experiments where a DNA containing two clusters of 8xOB sites and 1xOA site were tethered between two beads and scanned with a confocal microscope using 635 nm illumination. (right panel) Representative kymograph showing the binding of AF647-labeled KorA either alone or in the presence of unlabeled KorB, the binding of AF647-KorA in the presence of unlabeled KorB and 2 mM CTP, the binding of AF647-KorA (Y84A) in the presence of unlabeled KorB and 2 mM CTP, and the binding of AF647-KorA in the presence of unlabeled KorB (F249A) and 2 mM CTP. Concentrations of proteins are shown above each representative image. KorA residence time experiments were performed in the protein channel using unlabeled KorB and a lower concentration of AF-KorA to minimize fluorescence background. Source data
Extended Data Fig. 8
Extended Data Fig. 8. KorA and KorB co-operatively heighten long-range transcriptional repression.
Promoter-xylE reporter assays were used to measure promoter activities in the presence or absence of KorAB (WT or variants) (see Fig. 4d for the schematic diagrams of promoter-xylE reporter constructs). a, The copy number of plasmids used in promoter-xylE reporter assays. Illumina whole-genome deep sequencing was employed to determine the copy number (relative to the chromosome) for each of the three plasmids used in the promoter-xylE reporter assays. Data are represented as mean values ± SD from three replicates. There was not sufficient evidence of a difference in plasmid copy number under any tested conditions (one-way ANOVA statistical test with the null hypothesis that there is no difference in plasmid copy number across all four conditions, three replicates, P = 0.10 (left panel, not significant, ns), 0.39 (middle panel, ns), and 0.37 (right panel, ns)). b, Absolute values of XylE activities from the same promoter-xylE reporter assay in Fig. 4d. Immunoblots (α-KorB and α-KorA) and loading controls (Coomassie-stained SDS-PAGE) from lysates of cells used in the same experiments are also shown below. Data are represented as mean values ± SD from three replicates. Source data
Extended Data Fig. 9
Extended Data Fig. 9. KorA and KorB are transcriptional repressors that exclude E. coli RNAP from promoters.
a, Representative urea-PAGE gel closeup on the abortive RNA product (5’-ApUpG*-3’; *radiolabelled on guanosine alpha-phosphate) transcribed in in vitro abortive initiation assays on WT PkorA and the PkorAPR discriminator mutant linear DNA scaffolds with different mixes of Eσ70 and/or fivefold excess KorA, fivefold excess KorB and/or saturating CTP. b, WT PkorA in vitro transcription repression of E. coli RNAP:σ70 holoenzyme (Eco Eσ70) in the presence of fivefold excess KorA and/or KorB. Experiments were repeated at least three times. All values are normalized to holoenzyme only control as mean values ± SEM. Eσ70 + KorB condition has n = 3 while the rest are n = 4, and this remains valid as repression quantities are normalized to a Eσ70-only control and background-corrected for each gel run, and SEMs are considered in statistical analysis. P value was calculated by an unpaired Welch’s t-test; * p ≤ 0.05, ** p ≤ 0.01. The P values are 0.1827 (KorA vs KorA + KorB), 0.0281 (KorA vs KorB), and 0.0067 (KorB vs KorA + KorB). c, Deconvolved native mass spectra of Eσ70 (5 μM) with 2.5-fold excess KorA dimer electrospray ionized in buffer of 300 mM or 150 mM ammonium acetate pH 8.0 and 0.01% Tween-20. No peak of Eσ70:KorA was observed. Source data

Similar articles

Cited by

References

    1. Schoenfelder, S. & Fraser, P. Long-range enhancer–promoter contacts in gene expression control. Nat. Rev. Genet.20, 437–455 (2019). - PubMed
    1. Kim, S., Beltran, B., Irnov, I. & Jacobs-Wagner, C. Long-distance cooperative and antagonistic RNA polymerase dynamics via DNA supercoiling. Cell179, 106–119.e16 (2019). - PubMed
    1. Tripathi, S., Brahmachari, S., Onuchic, J. N. & Levine, H. DNA supercoiling-mediated collective behavior of co-transcribing RNA polymerases. Nucleic Acids Res.50, 1269–1279 (2022). - PMC - PubMed
    1. Wang, Z. & Dröge, P. Long-range effects in a supercoiled DNA domain generated by transcription in vitro. J. Mol. Biol.271, 499–510 (1997). - PubMed
    1. Bignell, C. R., Haines, A. S., Khare, D. & Thomas, C. M. Effect of growth rate and incC mutation on symmetric plasmid distribution by the IncP-1 partitioning apparatus. Mol. Microbiol.34, 205–216 (1999). - PubMed

MeSH terms