. 2025 Jan;6(1):175-193.
doi: 10.1038/s43018-024-00889-9. Epub 2025 Jan 23.

Systemic IFN-I combined with topical TLR7/8 agonists promotes distant tumor suppression by c-Jun-dependent IL-12 expression in dendritic cells

Affiliations

Systemic IFN-I combined with topical TLR7/8 agonists promotes distant tumor suppression by c-Jun-dependent IL-12 expression in dendritic cells

Martina Sanlorenzo et al. Nat Cancer. 2025 Jan.

Abstract

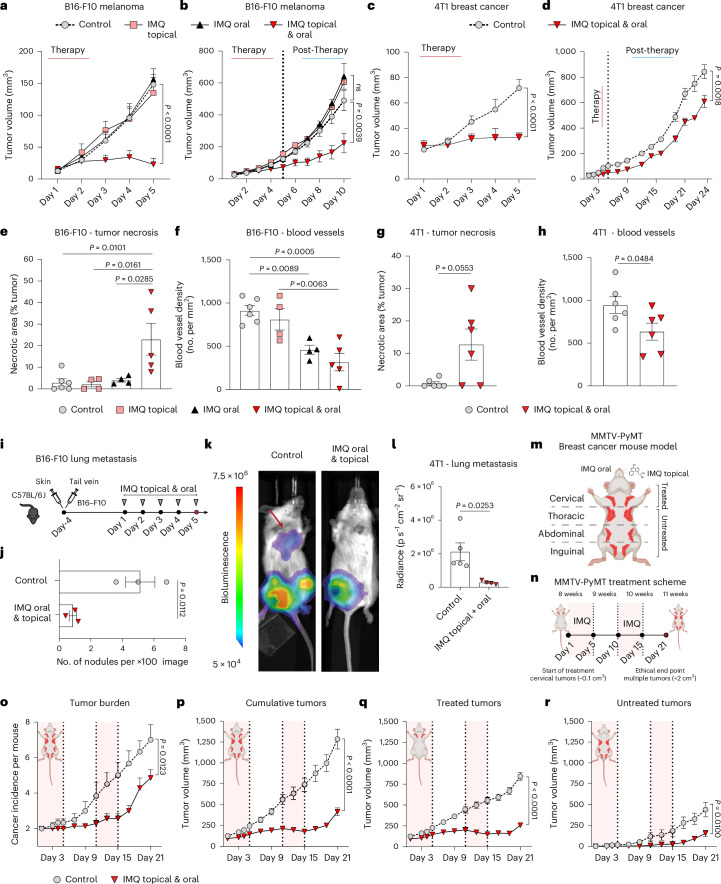
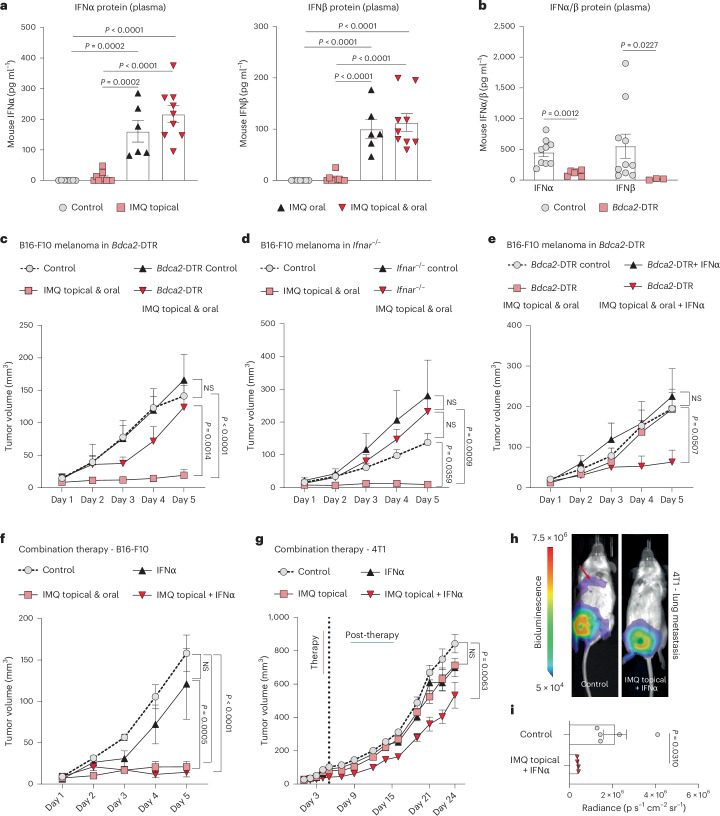
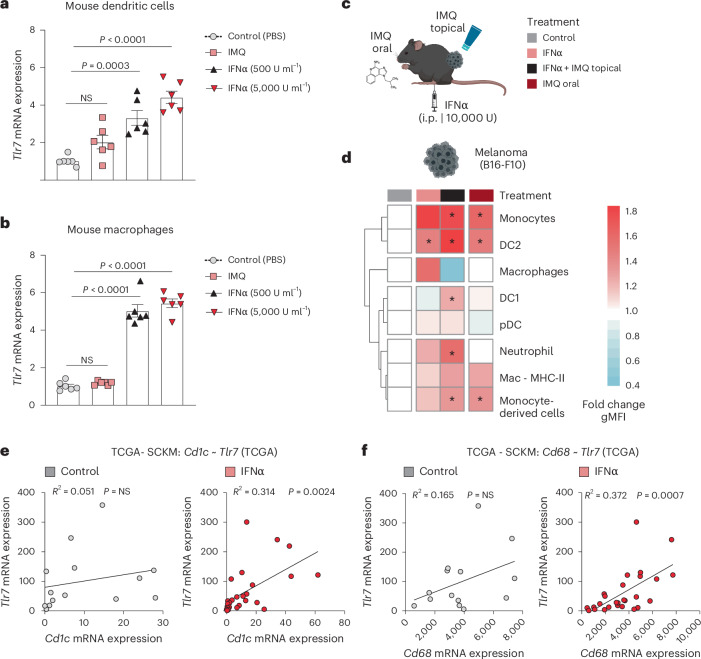
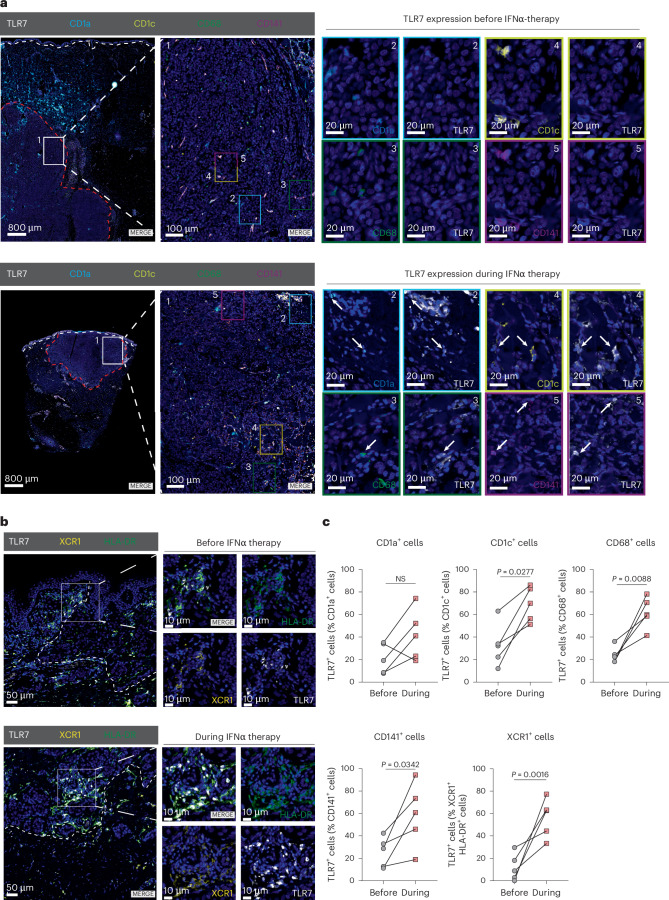
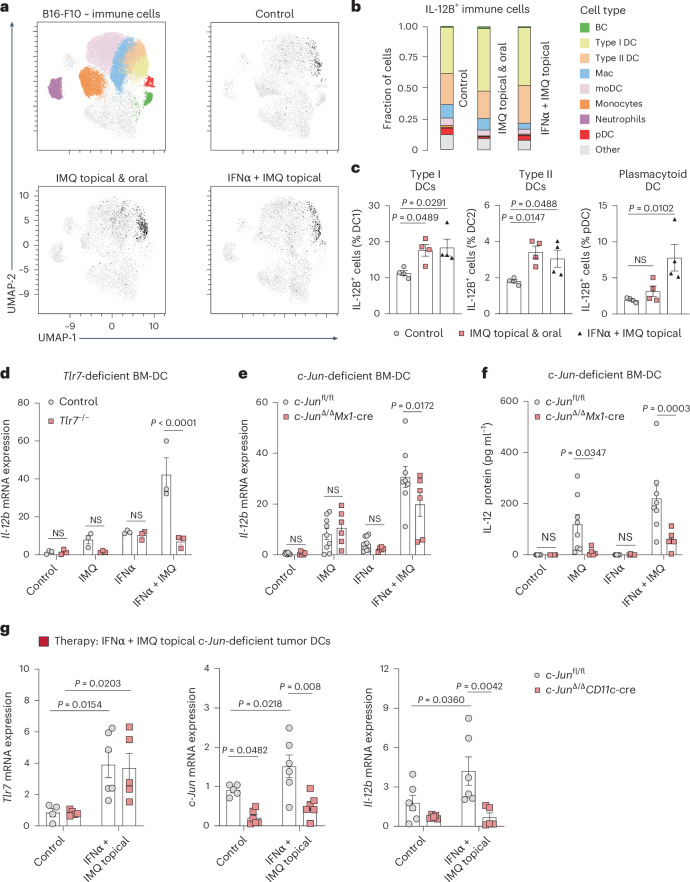
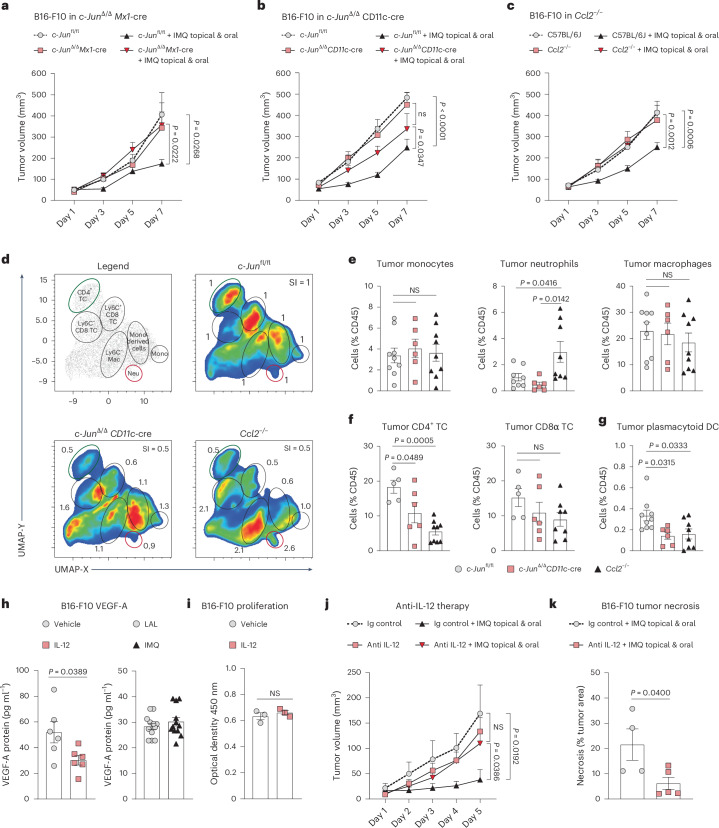
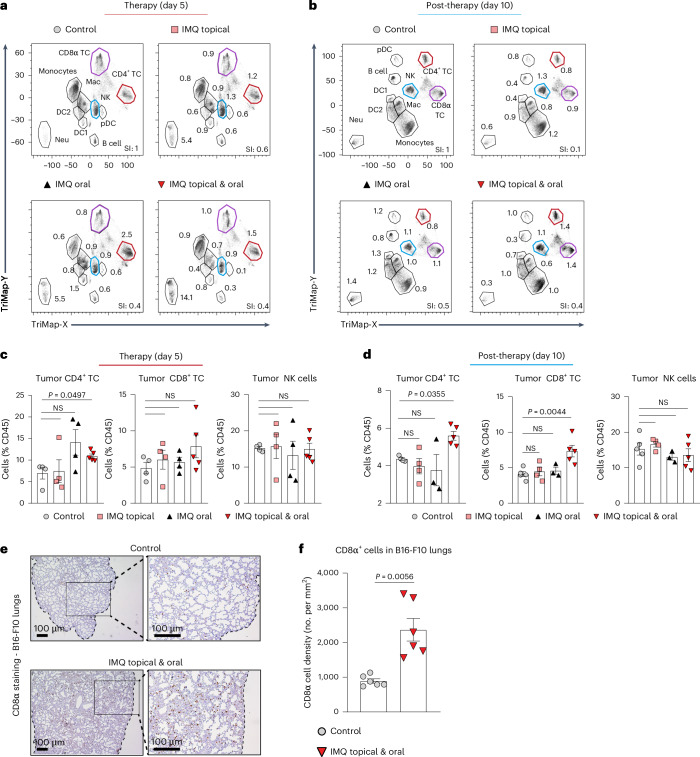
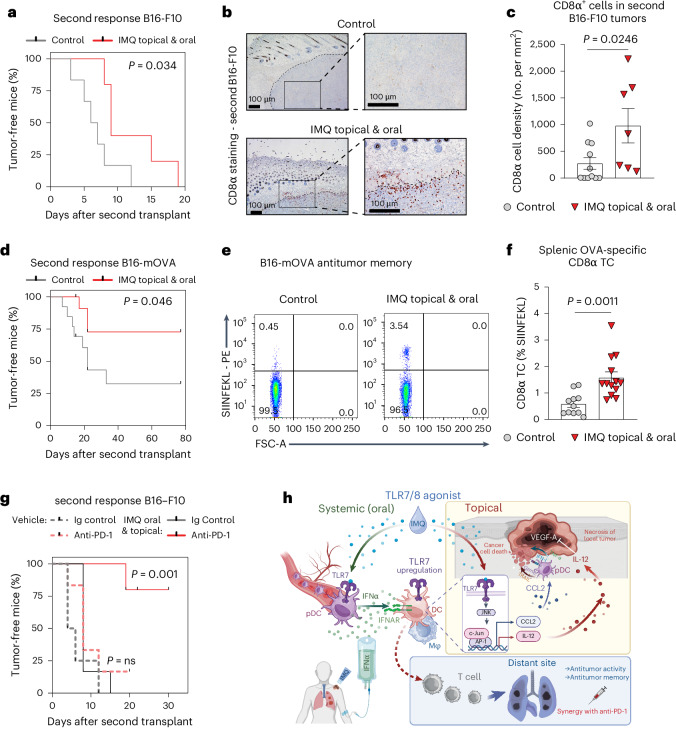
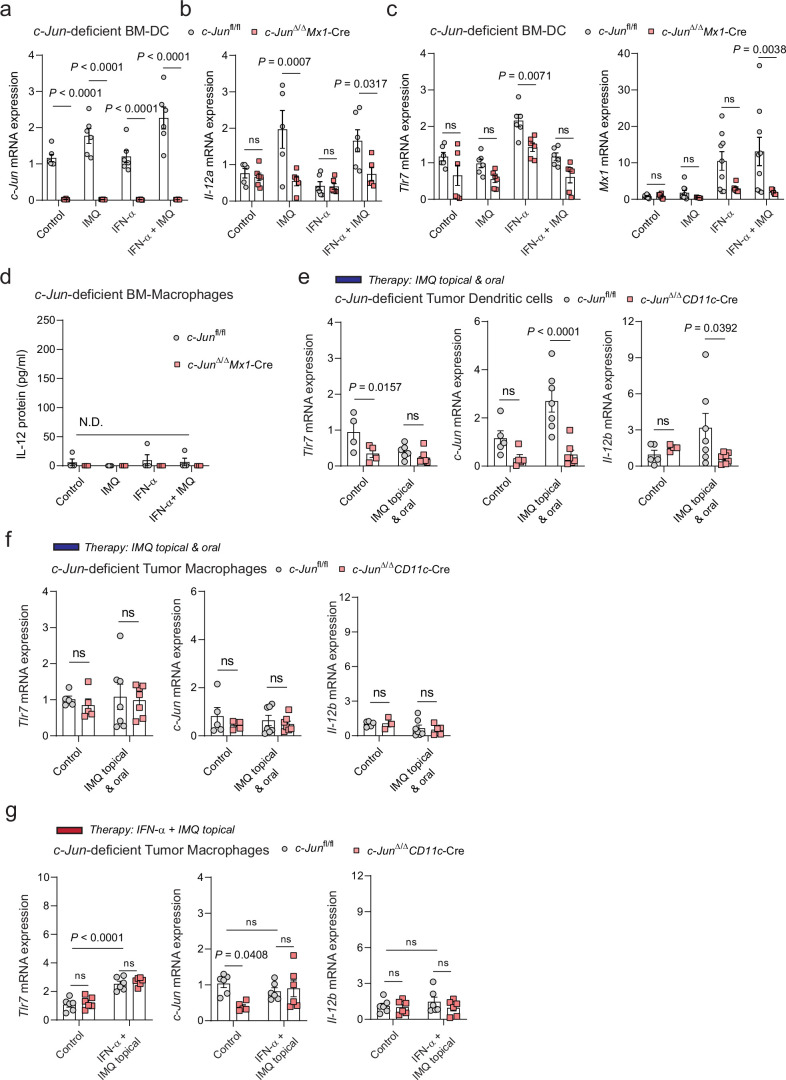
Dendritic cell (DC) activation by pattern recognition receptors like Toll-like-receptors (TLRs) is crucial for cancer immunotherapies. Here, we demonstrate the effectiveness of the TLR7/8 agonist imiquimod (IMQ) in treating both local tumors and distant metastases. Administered orally, IMQ activates plasmacytoid DCs (pDCs) to produce systemic type I interferons (IFN-I) required for TLR7/8 upregulation in DCs and macrophages, sensitizing them to topical IMQ treatment, which is essential for therapeutic efficacy. The mechanism involves c-Jun/AP-1 mediating TLR7/8 signaling in IFN-I-primed DCs, upregulating the pDC-recruiting chemokine CCL2 and the anti-angiogenic cytokine interleukin-12, which suppresses VEGF-A production leading to tumor necrosis and regression. Combining topical and systemic IMQ or IFN-I generates a CD8+ T cell-dependent response at metastatic sites, reinforced by PD-1 blockade, leading to long-lasting memory. Analysis of cohorts of patients with melanoma demonstrates DC-specific TLR7/8 upregulation by IFN-I, supporting the translational potential of combining systemic IFN-I and topical IMQ to improve immunotherapy of topically accessible tumors.


Conflict of interest statement

Competing interests: The authors declare no competing interests.

Figures

Fig. 1
Fig. 1. Oral and topical IMQ promotes local and distant antitumor effects.
ad, Tumor growth curves of mice treated with IMQ orally, topically or both for five consecutive days (therapy; see Extended Data Fig. 1a,b). All mice wore a collar. After treatment termination tumor growth was monitored to the ethical end point (post-therapy). B16-F10 melanoma growth under therapy (control n = 7, IMQ: topical n = 7, oral n = 8, topical and oral n = 8) (a) and post-therapy (control n = 5, IMQ: topical n = 4, oral n = 3, topical and oral n = 5) (b). 4T1 breast cancer under therapy (n = 6 mice per group) (c) and post-therapy (control n = 5, IMQ: topical and oral n = 4) (d). n in ad is the number of mice pooled from two (a,c) independent experiments and from one experiment (b,d). e,f, Quantification of necrotic areas (e) in H&E-stained sections of B16-F10 tumors from a and of blood vessels (f) in endomucin-stained sections. Control n = 6, IMQ: topical n = 4, oral n = 4, topical and oral n = 5; n is the number of mice pooled from two independent experiments. g,h, Tumor necrosis (g) and blood vessels (h) were analyzed in 4T1 breast cancers (c). n = 6 mice per group pooled from two independent experiments. i, B16-F10 lung metastasis model. Intradermal and tail vein injections of B16-F10 tumor cells were performed. IMQ was administered topically, on the primary tumor and orally. j, Quantification of B16-F10-lung metastasis from i. n = 3 mice per group from one experiment. k, Lung metastasis was assessed by bioluminescence in 4T1 breast cancer-bearing mice from d 24 days after treatment start. l, Quantification of 4T1-lung metastasis from k. Control n = 5, IMQ topical and oral n = 4; n is the number of mice from one experiment. m,n, MMTV-PyMT breast cancer mouse model (m). Female mice received combination therapy at 8 weeks of age (first palpable tumors). IMQ was administered orally and topically on the breast (5 days), followed by a second round after a 5-day break (n). or, Tumor burden (o) and tumor growth curves showing cumulative (p), treated (q) and untreated (r) tumor sizes. In or, control n = 6, IMQ topical and oral n = 7; n is the number of mice from one experiment. Data are plotted as mean ± s.e.m. Dots represent biological replicates (eh,j,l). P values were calculated by unpaired, two-tailed t-test (j) with Welch’s correction (l), one-way ANOVA (eh) and two-way ANOVA with Tukey’s post-test (ad,or). Source data
Fig. 2
Fig. 2. The antitumor effect of IMQ depends on pDCs and type I IFN.
a,b, Protein levels of IFNα and IFNβ (a) in the plasma of mice 1 h after treatment with topical IMQ, oral IMQ, and topical plus oral IMQ in wild-type mice (control n = 7, IMQ: topical n = 10, oral n = 8, topical and oral n = 9) and in and mice depleted of pDCs (Bdca2-DTR) (b). IFNα: control n = 9, Bdca2-DTR n = 6, IFNβ: control n = 10, Bdca2-DTR n = 3; n corresponds to the number of individual mouse plasma pooled from two independent experiments. c, Tumor growth kinetics (B16-F10) were assessed in mice depleted of pDCs (Bdca2-DTR). The mice were treated with topical and oral IMQ. Control n = 4, IMQ topical and oral n = 7, Bdca2-DTR control n = 6, IMQ topical and oral n = 8; n is the number of mice pooled from two independent experiments. df Tumor growth (B16-F10) was monitored in mice lacking the type I IFN receptor (Ifnar−/) (n = 6 mice per group pooled from two independent experiments) (d), in mice depleted of pDCs (Bdca2-DTR) (Bdca2-DTR control n = 4, IFNα n = 6, IMQ topical and oral n = 6, IMQ topical and oral + IFNα n = 6; n is the number of mice pooled from two independent experiments) (e) and in wild-type mice (control n = 6, IFNα n = 6, IMQ topical and oral n = 5, IMQ topical + IFNα n = 5; n is the number of mice pooled from two independent experiments) (f). g, Tumor growth was monitored in 4T1 breast cancer-bearing mice during therapy (5 days) and after treatment termination (post-therapy). Therapy included treatment with IFNα and/or IMQ topically. Control and IMQ topical + IFNα n = 5, IFNα and IMQ topical and oral n = 3; n is the number of mice from one experiment. h, Lung metastasis was assessed by bioluminescence in 4T1 breast cancer-bearing mice from g 24 days after treatment start. i, Quantification of lung metastasis described in h. Control n = 5, IMQ topical + IFNα n = 4; n is the number of mice from one experiment. Data are plotted as mean ± s.e.m. Dots in a,b and i represent biological replicates. P values were calculated by one-way ANOVA with Tukey’s post-test (a) or unpaired, two-tailed t-test (i) with Welch’s correction (b) or two-way ANOVA with Tukey’s post-test (cg). Source data
Fig. 3
Fig. 3. IFNα sensitizes DCs and macrophages to TLR7/8 agonists.
a, Dendritic cells were generated from BM that was supplemented with FLT3L. Dendritic cells were treated with IFNα (500 or 5,000 U ml−1) or stimulated with IMQ (2.5 µg ml−1) for 24 h. Tlr7 mRNA expression was analyzed using RT–qPCR. (n = 6 mice per group; data are pooled from two independent experiments). b, Tlr7 mRNA expression was quantified in murine BM-derived macrophages treated as described in a. n = 6 mice per group; data are pooled from two independent experiments. c, Mice received IFNα and/or topical IMQ or oral IMQ 1 day before the analysis of TLR7 expression on myeloid cells by intracellular flow cytometry. Sample size: n = 3 mice per group from one experiment. d, Heatmap depicts TLR7 expression on myeloid cells within B16-F10 tumors. Treatments are indicated in color-coded rectangles above the heatmap, as described in c. The fold change of the geometric mean fluorescence intensity (gMFI) of TLR7 on myeloid cells of treated mice compared to the control is shown. e, Tlr7 mRNA expression was plotted against a human dendritic cell signature gene (Cd1c) in a subset of patients with melanoma included in the TCGA database. The subset consisted of patients who received IFNα before biopsy (n = 29) and a control group of patients who did not (n = 14). f, Correlation plot of Tlr7 to Cd68, a human macrophage cell signature gene, in a subset of melanoma patients from the TCGA database described in e. Bar graphs are plotted as mean ± s.e.m. Dots in a and b represent biological replicates. Correlation is shown in a xy-plot with a linear regression. Heatmaps are color-coded (blue, low; red, high value). P values were calculated by unpaired, two-tailed t-tests (d), one-way ANOVA with Tukey’s post-test (a,b) and two-tailed Pearson’s correlation test (e,f). Source data
Fig. 4
Fig. 4. IFNα therapy induces TLR7 expression on myeloid cells.
a, Multiplex immunofluorescence analysis of melanoma samples from a cohort of n = 5 patients who underwent IFNα therapy. The staining panel included antibodies against CD1a, CD1c, CD68, CD141 and TLR7. Representative images are shown for a patient before (top) and during IFNα therapy (bottom). The white-dotted line demarcates the border of the epidermis and the red-dotted line indicates the border of the tumor. Arrows indicate double-positive cells, which are shown magnified in numeric and color-coded insets. Magnification: ×0.65, ×4.5 and ×35 (zoom). Scale bars, 800 µm, 100 µm and 20 µm. b, Immunofluorescence staining against TLR7, XCR1 and HLA-DR in a cohort of patients with melanoma described in a. Representative images are shown. The inset magnifies an area of interest. The white-dotted line shows tumor border. Scale bars, 50 µm and 10 µm. c, Quantification of TLR7-expressing cells positive for CD1a, CD1c, CD68 and CD141 (a) or double-positive for XCR1 and HLA-DR (b) in tumor parenchyma was performed in melanoma patients as described in a (n = 5 individuals). Data are plotted as dots and lines. Dots in c represent five individuals. P values were calculated using paired, two-tailed t-tests (c). Source data
Fig. 5
Fig. 5. TLR7-c-Jun signaling in DCs promotes IL-12 expression.
ac, UMAP plot of immune cells (CD45+) in B16-F10 tumors shows the distribution of IL-12B in the myeloid cell compartment. Treatment is indicated. Identified cell clusters are color-coded (top right). Fraction of cells positive for IL-12B (b). Cells are assigned to cell clusters (color) identified in UMAP plot. Percentage of type I or II DCs and pDCs positive for IL-12B (c). Classical gating (n= 6 mice per group; data are pooled from two independent experiments). d, Il-12b mRNA expression was quantified in murine BM-DCs generated from wild-type (control) and Tlr7−/− BM. BM-DCs were either pre-treated with IFNα (500 U ml−1) for 6 h and/or stimulated with IMQ (2.5 µg ml−1) over night. (n = 3 mice per group from one experiment). e, Il-12b mRNA expression was quantified by RT–qPCR in BM-DCs generated from c-Junfl/fl and c-Jun∆/∆Mx1-Cre BM. Treatments are as described in d. (c-Junfl/fl: control n = 9, IMQ n = 9, IFNα n = 9, IFNα + IMQ n = 8, c-Jun∆/∆Mx1-Cre n = 6 mice per group; data are pooled from three independent experiments). f, IL-12 protein levels were determined by ELISA in the supernatants of BM-DCs from mice of indicated genotype and treated as described in d. c-Junfl/fl n = 8 mice per group, c-Jun∆/∆Mx1-Cre n = 6 mice per group; data are pooled from two independent experiments. g, Tlr7, c-Jun, and Il-12b mRNA expression was analyzed by RT–qPCR in sorted DCs (CD45+CD64-CD11c+MHC-II+) isolated from B16-F10 tumors implanted in c-Junfl/fl and c-Jun∆/∆CD11c-Cre mice. Tumors were topically treated with IMQ and the mice received IFNα. Tlr7 mRNA: c-Junfl/fl n = 4 or IFNα + IMQ topical n = 6 mice and c-JunΔ/ΔCD11c-Cre n = 6 mice per group, c-Jun mRNA: n = 6 mice per group or c-Junfl/fl control n = 5 mice, Il-12b mRNA: c-Junfl/fl n = 6 mice and c-JunΔ/ΔCD11c-Cre n = 5 mice per group; data are pooled from two independent experiments. Data are plotted as mean ± s.e.m. Dots in cg represent biological replicates. P values were calculated using one-way ANOVA with Dunnett’s post-test (c) and two-way ANOVA with Sidak’s post-test (dg). Source data
Fig. 6
Fig. 6. The IMQ antitumor effect depends on c-Jun signaling in DCs.
ac, Tumor growth was monitored in c-Junfl/fl and c-JunΔ/ΔMx1-Cre mice (c-Junfl/f: n = 9, IMQ topical and oral n = 9, c-JunΔ/ΔMx1-Cre: n = 4, IMQ topical and oral n = 8) (a), in c-Junfl/fl and c-JunΔ/ΔCD11c-Cre (c-Junfl/f: n = 19, IMQ topical and oral n = 18, c-JunΔ/ΔCD11c-Cre: n = 19, IMQ topical and oral n = 17) (b) and wild-type and Ccl2−/− mice (C57BL/6J: n = 18, IMQ topical and oral n = 20, Ccl2−/−: n = 13, IMQ topical and oral n = 19) (c). n in ac is the number of mice pooled from two (a), four (b) and five (c) independent experiments. d, UMAP analysis was performed on tumor-infiltrating immune cells obtained from mice of indicated genotype, 1 day after IMQ therapy ended. Clustering with CD4, CD8, CD11b, CD64, Ly6-C, Ly6-G and TCRβ. The legend plot shows the identified populations. The fold change of each cluster to the control (c-Junfl/fl) is depicted. n = 3 mice per group from one experiment. eg, Frequency of monocytes, neutrophils and macrophages (e), CD4+ and CD8+ T cells (f) and pDCs (g) among tumor-infiltrating immune cells in c-Junfl/fl, c-JunΔ/ΔCD11c-Cre and Ccl2/− mice 1 d after IMQ therapy ended. c-Junfl/fl: n = 9 (monocytes and macrophages), n = 8 (neutrophils) (e), n = 5 (f), n = 9 (g), c-JunΔ/ΔCD11c-Cre: n = 8 (eg), Ccl2−/: n = 9 (monocytes and macrophages), n = 8 (neutrophils) (e), n = 9 (CD4+ T cells), n = 8 (CD8α T cells) (f), n = 8 (g); n in eg is the number of mice pooled from two (e,f) or three (g) independent experiments. h, Protein levels of VEGF-A were measured by ELISA in B16-F10 cells treated with IL-12B (10 ng ml−1) or IMQ (2.5 µg ml−1) for 24 h. IL-12B: n = 6 and IMQ: n = 12 technical replicates of B16-F10 cells per group pooled from two independent experiments. i, B16-F10 proliferation after treatment with IL-12B as described in h. n = 3 technical replicates of B16-F10 cells per group from one experiment. j, Tumor growth kinetics in wild-type mice implanted with B16-F10 melanoma cells. The mice received combination therapy and/or anti-IL-12 antibody (500 µg day−1). n = 4 mice per group or Ig control + IMQ topical and oral n = 6 mice; data are pooled from two independent experiments. k, Quantification of the necrotic area in tumors treated as described in j. Ig control n = 4, anti-IL-12 n = 5; n is the number of tumors pooled from two independent experiments. Data are shown as mean ± s.e.m. Dots represent biological replicates (eg) and technical replicates (h,i). P values were calculated using unpaired, two-tailed t-tests (h,i,k), one-way ANOVA (eg) or two-way ANOVA both with Tukey’s post-test (ac,j). Source data
Fig. 7
Fig. 7. Combination therapy promotes a distant CD8+ T cell response.
a, TriMap plot of immune cells (CD45+) in B16-F10 tumor-bearing mice (day 5) treated as indicated. Clusters are annotated in the top-left plot. The markers used were B220, BST-2, CD3, CD4, CD8a, CD11b, CD11c, CD64, CD103, Gr-1, Ly6-C, Ly6-G, MHC-II, NK1.1, TCRβ and XCR1. Differences in the immune cell composition to the control are shown as fold change for each cluster, and are summarized in the SI. n= 3 mice were concatenated per treatment condition. b, TriMap Plot of immune cells (CD45+) in B16-F10 tumor-bearing mice post-therapy (day 10) plotted as described in a. c, Frequency of CD4+ or CD8α T cells and NK cells was assessed by flow cytometry in B16-F10 tumors of mice (day 5) after treatment with IMQ: topical, oral and topical plus oral. n= 4 mice per group and n= 5 mice in the IMQ topical and oral group; data are from one experiment. d, Frequency of CD4+ or CD8α T cells and NK cells was analyzed by flow cytometry in B16-F10 tumors of mice (day 10) post-treatment with IMQ: topical, oral and topical plus oral. Control: n= 5, IMQ: topical n= 4, oral n= 3, topical and oral n= 5; n is the number of mice from one experiment. e, CD8α staining of B16-F10 colonized lungs at therapy end point (day 5) are shown. Metastasis was induced as described in Fig. 1i. Inset provides an enlarged view of the marked area. The black-dotted line shows the lung tissue border. Magnification, ×4 (left), ×10 (right). Scale bar, 100 µm. f, Enumeration of CD8α-positive cells in B16-F10 colonized lungs was performed by counting CD8α-stained sections, as shown in e. n= 6 mice per group; data are pooled from two independent experiment. Data are shown as mean ± s.e.m. Dots in c, d and f represent biological replicates. P values were calculated using unpaired, two-tailed t-test with Welch’s correction (f), Brown–Forsythe and Welch ANOVA test (c) and one-way ANOVA with Dunnett’s post-test (d). Source data
Fig. 8
Fig. 8. Combination therapy induces a memory CD8+ T cell response.
a, Survival curve depicting the tumor-free time after tumor rechallenge with B16-F10 melanoma, following the memory model described in Extended Data Fig. 10a. Control n= 5, IMQ topical and oral n= 6; n is the number of mice pooled from two independent experiments. b, Immunohistochemistry CD8α staining in re-challenged B16-F10 tumors as described in a. The black-dotted line demarcates the tumor from the dermis. The inset gives an enlarged view. Magnification, ×4 (left), ×10 (right). Scale bar, 100 µm. c, Quantification of CD8α-positive cells from b. Control n = 11, IMQ topical and oral n = 7; n is the number of mice pooled from two independent experiments. d, Survival curve depicting the tumor-free time after tumor rechallenge with B16-mOVA melanoma. Control n = 13, IMQ topical and oral n = 13; n is the number of mice pooled from two independent experiments. e, Representative flow cytometry plots show SIINFEKL-positive CD8α T cells in the spleen 2 days after rechallenge with B16-mOVA. Cells were pre-gated on CD19, TCRβ+, CD8α+. f, Quantification of splenic OVA-specific CD8α T cells from e. Control n = 11, IMQ topical and oral n = 13; n is the number of mice pooled from two independent experiments. g, Survival curve depicting the tumor-free time after tumor rechallenge with B16-F10 melanoma. Before resection mice received anti-PD-1 (200 µg) every other day (three times) and/or combination therapy (5 days). Ig control n = 4, anti-PD-1 n = 6; IMQ topical and oral: Ig control n = 6, anti-PD-1 n = 5; n is the number of mice pooled from two independent experiments. h, Graphical abstract: systemic IFN-I upregulates TLR7 expression on DCs/macrophages in the TME. Topical IMQ stimulates these sensitized cells to produce IL-12, which acts directly on tumor cells and blocks angiogenesis, resulting in necrosis. This two-hit treatment promotes CD8+ T cell antitumor immunity at distant sites, including memory formation and synergizes with PD-1 checkpoint blockade. Bar graphs are shown as mean ± s.e.m. Dots in c and f represent biological replicates. Survival curves are shown as percent, censored points only and no error bars. P values were calculated using unpaired, two-tailed t-test (f) and two-tailed Mann–Whitney U-test (c) or log-rank (Mantel–Cox) test (a,d,g). Source data
Extended Data Fig. 1
Extended Data Fig. 1. Oral and topical IMQ therapy induces tumor regression with necrosis.
a, b, Scheme of the murine orthotopic tumor models employed. B16-F10 (a) or 4T1 (b) tumor cells were intradermally injected. IMQ was administered for five consecutive days (Therapy). Tumors were monitored after treatment (Post-Therapy). c, Representative picture of a tumor-bearing mouse wearing a collar. d, e, B16-F10 tumor growth curves in mice treated with IMQ, comparing mice with or without an Elizabethan collar (d) (n = 7 mice per group and in the Control group n = 6) or in mice where IMQ treatment was started when tumors had a size of 200 mm³ (e). (Control n = 5, IMQ: oral n = 3, topical n = 3, topical &oral n = 5). n is the number of mice pooled from (d) 2 independent experiments or from 1 experiment (e). f, Tumor growth (B16-F10) was monitored in mice treated topically with IMQ, orally with R848, or with a combination of both. (Control n = 4, R848 n = 3, IMQ: topical n = 3, topical &R848 n = 4; n is the number of mice from 1 experiment). g, Representative pictures of B16-F10 tumors (Fig. 1e) stained with hematoxylin and eosin. The black-dotted line demarcates the tumor boarder and the yellow line the necrotic area. Magnification: 10x. Scale bar: 50 µm. h, Immunohistochemistry staining of Endomucin in B16-F10 tumors treated as indicated, and described in (Fig. 1f). Magnification: 10x. Scale bar: 50 µm. i, Representative pictures of 4T1 breast cancer tumors (Fig. 1g) stained with hematoxylin and eosin. The arrow indicates the necrotic area. Magnification: 4x. Scale bar: 500 µm. j, 2-flank tumor model. B16-F10 cells were injected in both flanks. (left: Treated and right: Untreated). k, Tumor volume for treated (left graph) and untreated (right graph) B16-F10 tumors in a 2-flank B16-F10 tumor model described in (j). (Control n = 3, IMQ: oral n = 3, topical n = 3, topical & oral n = 5; n is the number of mice from 1 experiment). l, Quantification of lung metastasis in B16-F10 melanoma-bearing mice as described in (Fig. 1i). (n = 3 mice per group from 1 experiment). Data are shown as mean ± SEM. Dots in l represent biological replicates. P‐values were calculated using unpaired, two-tailed t-test (l) and two-way ANOVA with Tukey´s (d–f) or Dunnett´s post-test (k). Source data
Extended Data Fig. 2
Extended Data Fig. 2. IFN-α induces maturation on myeloid cells across tissues.
a, pDC depletion in Bdca2-DTR mice treated with Diphtheria toxin (DT) for 5 consecutive days. Mice were administered DT (4.5 ng DT/g, i.p.) every day, starting one day prior to IMQ treatment. pDCs are shown as the percentage among immune cells (CD45+ cells) in tumor-draining (td-LN) and mesenteric lymph nodes (m-LN). (Control: n = 7 td-LN, n = 6 m-LN; Bdca2-DTR: n = 7 td-LN, n = 4 m-LN; n is the number of mice pooled from 2 independent experiments). b, Schematic representation of the murine orthotopic melanoma model employed for IFN-α treatment: 4.5 ×10⁵ B16-F10 tumor cells were subcutaneously injected. IMQ treatment topical was done for five consecutive days in combination with recombinant IFN-α (10.000 U, i.p.). c, Expression of CD80 on myeloid cells across tissues. B16-F10 tumor-bearing mice were treated as described in (Fig. 3c). Dot plot shows the fold change (dot size) in the geometric mean fluorescence intensity (gMFI) on myeloid cells of treated mice to the control. Dot color indicates statistical significance, calculated using two-way ANOVA. In c-e n = 3 mice per group from 1 experiment. d, Expression of CD86 on myeloid cells across tissues as described in (c). e, Expression of PD-L1 on myeloid cells across tissues as described in (c). Bar graphs are plotted as mean ± SEM. Dots in (a) represent biological replicates. P values were calculated using unpaired, two-tailed t-tests with Welch´s correction (a). Dot plot graphs are plotted as mean (dot size) + P values (dot color). Source data
Extended Data Fig. 3
Extended Data Fig. 3. IFN-α therapy induces TLR7/8 expression on myeloid cells.
a, Differential expression of Tlr7 in myeloid cells identified by scRNA-Seq in skin-draining lymph nodes after IFN-α treatment (10.000 U, 4 h, s.c.) of mice. Gene expression data extracted from https://www.immunedictionary.org/app/home. b, Tlr7 expression in sorted myeloid cells analyzed by Microarray. Gene expression data extracted from: http://rstats.immgen.org/Skyline_microarray/skyline.html?datagroup=IFN. IFN-α treatment: (10.000 U, 2 h). c, DCs were generated from bone marrow that was supplemented with FLT3L and Tlr8 mRNA expression was analyzed using qRT–PCR. Cells were treated for 24 h with IFN-α (500 or 5000 U/mL), or with IMQ (2.5 µg/mL). In c, d n = 3 mice per group from 1 experiment. d, Tlr8 mRNA expression was assessed in murine bone-marrow-derived macrophages using qRT–PCR. Macrophages were treated as described in (c). e, Heatmap depicts TLR7 expression on myeloid cells within tumor-draining lymph nodes. Treatments are indicated in color-coded rectangles above the heatmap. The fold change of the geometric mean fluorescence intensity (gMFI) of TLR7 on indicated myeloid cells of treated mice compared to the control is shown. In e–g n = 3 mice per group from 1 experiment. f, Spleens were analyzed for TLR7 expression. Heatmap was plotted as described in (e). g, Small intestines were analyzed for TLR7 expression. Heatmap was plotted as described in (e). h, Tlr8 mRNA expression plotted against a human myeloid cell signature gene (Cd1c) in a subset of melanoma patients included in the TCGA database. The subset consisted of patients who received IFN-α prior to biopsy (n = 29) and a control group who did not receive IFN-α (n = 14). i, Correlation plot of Tlr8 to Cd68 in a subset of melanoma patients from the TCGA database, as described in (h). Bar graphs are plotted as mean ± SEM. Dots in c and d represent biological replicates. Correlation is shown in a xy-plot with a linear regression. Heatmaps are color-coded (blue = low, red = high value). P values were calculated using unpaired, two-tailed t-tests (e–g), one-way ANOVA with Tukey´s post-test (c, d) and two-tailed Pearson´s correlation test (h, i). * P < 0.05, ** P < 0.01, *** P < 0.001 and **** P < 0.0001. Source data
Extended Data Fig. 4
Extended Data Fig. 4. IFN-α therapy induces TLR7 on myeloid cells in tumor stroma.
a, TLR7 immunohistochemistry staining of human skin. To the left: Representative pictures before and during IFN-α therapy. Insets show enlarged views of the marked areas. To the right: Quantification of TLR7-positive cells is presented as a percentage of total cells. Scale bar: 100 µm. In a, b n = 5 individuals. b, TLR8 staining of human skin of patients undergoing IFN-I therapy. On the left are representative pictures. Insets provide enlarged views of the marked areas. On the right is the quantification of TLR8-positive cells which is shown as percentage of total cells. Scale bar: 100 µm. c, Multiplex immunofluorescence analysis of melanoma samples from a cohort of five patients undergoing IFN-α therapy. The staining panel included antibodies against CD1a, CD1c, CD68, CD141, and TLR7. Representative images show the upper dermis of a patient before (upper panels) and during IFN-α therapy (lower panels). On the left, a full-color panel, and on the right TLR7 in combination with selected markers is shown. Insets show enlarged views of the marked areas, and highlight cells that are positive for TLR7 and/or one of the myeloid cell markers. Magnification: 10x (Zoom), Scale bar: 50 µm, Insets: 10 µm. In d n = 5 individuals. d, Quantification of TLR7-expressing cells positive for CD1a, CD1c, CD68 and CD141 was performed in the upper dermis in immunofluorescence staining’s described in (c). N.D. = not detectable. Data are plotted as dots and lines. Dots in a, b and represent individuals. P values were calculated using paired, two-tailed t-test (a, b and d). Source data
Extended Data Fig. 5
Extended Data Fig. 5. Dendritic cells are the primary source of IL-12 in IMQ-treated skin.
Uniform Manifold Approximation and Projection (UMAP) generated from a previously published scRNA-seq dataset (GSE150361) comparing immune cells in IMQ-treated skin to untreated control. Violin plots show the expression levels of indicated mRNA transcripts in the scRNA-Seq dataset described in (a). Signature genes that are associated with DCs (for example, Zbtb46 and Itgax) or macrophages (for example, Fcgr1, Cd68) are displayed in (b).
Extended Data Fig. 6
Extended Data Fig. 6. c-Jun modulates the immune response in DCs and macrophages downstream of TLR7.
a, c-Jun mRNA expression levels were measured in murine bone-marrow-derived DCs using qRT–PCR. Cells were pre-treated with IFN-α (6 h) and/or stimulated with IMQ over night. (n = 6 mice per group; Data are pooled from 2 independent experiments). b, Il-12a mRNA expression levels were assessed by qRT–PCR in BM-DCs as described in (a). (n = 6 mice, c-Junfl/fl: Control n = 5, IMQ n = 5, c-JunΔ/ΔMx1-Cre: IMQ n = 5, IFN-α + IMQ n = 5; n is the number of mice pooled from 2 independent experiments). c, Tlr7 and Mx1 mRNA expression levels were assessed by qRT–PCR in BM-DCs as described in (a). d, IL-12 protein levels were measured by ELISA in the supernatant of bone-marrow-derived macrophages following the indicated treatment. N.D.: Not detectable; (c-Junfl/fl n = 4 mice, c-JunΔ/ΔMx1-Cre; n = 3 mice; 1 experiment). e, Tlr7, c-Jun, and Il-12b mRNA expression levels were analyzed by qRT–PCR in tumor-infiltrating DCs (CD45+CD64-CD11c+MHC-II+) that were isolated from B16-F10 tumors of mice with the indicated genotype and treated with IMQ topically and orally. Tlr7: Control group n = 5, IMQ topical &oral: c-Junfl/fl n = 6, c-JunΔ/ΔMx1-Cre n = 7, c-Jun: Control group n = 5, IMQ topical &oral group n = 7, Il12-b: Control group: c-Junfl/fl n = 5, c-JunΔ/ΔMx1-Cre n = 4, IMQ topical &oral group n = 7; n is the number of mice pooled from 2 independent experiments. f, Tlr7, c-Jun, and Il-12b mRNA expression levels were analyzed by qRT–PCR in tumor-associated macrophages (CD45+CD64+CD11b+), as described in (e). Tlr7 and c-Jun: Control group n = 5, IMQ topical &oral n = 7, Il-12b: Control group: c-Junfl/fl n = 5, c-JunΔ/ΔCD11c-Cre n = 3, IMQ topical &oral: c-Junfl/fl n = 7, c-JunΔ/ΔCD11c-Cre n = 5; n is the number of mice pooled from 2 independent experiments. g, Tlr7, c-Jun, and Il-12b mRNA expression levels were analyzed by qRT–PCR in sorted macrophages (CD45+CD64+CD11b+). Macrophages were isolated from B16-F10 tumors that were implanted in c-Junfl/fl and c-Jun∆/∆CD11c-Cre mice. Tumors were treated with IMQ topically and mice received IFN-α (see Extended Data Fig. 2b). Tlr7 n = 6 mice per group, c-Jun and Il-12b: n = 6 mice per group and in the Control: c-JunΔ/ΔCD11c-Cre group n = 5 mice; n is the number of mice pooled from 2 independent experiments. Data are plotted as mean ± SEM. Dots in a-g represent biological replicates. P‐values were calculated using two-way ANOVA with Sidak´s post-test. (a-g). Source data
Extended Data Fig. 7
Extended Data Fig. 7. Impact of c-Jun-CCL2 signaling on the immune cell profile of IMQ-treated B16 tumors.
a, Gating strategy to identify pDCs and Type I (CD11b-CD24+XCR1+) and Type II DCs (CD11b+CD24-XCR1-) in B16-F10 tumor-bearing mice at therapy end point (Day 8). b, Frequency of Type I and Type II DCs identified as defined in (a). (c-Junfl/fl n = 9, c-JunΔ/ΔCD11c-Cre n = 6, Ccl2−/− n = 8; n is the number of mice pooled from 3 independent experiments). c, t-SNE plots show the distribution of DC subpopulations in B16-F10 tumors from (a). t-SNE analysis was performed on CD45+CD64-MHC-II+ immune cells (n = 3 mice per group; 1000 cells) with the surface markers for CD11b, CD11c, CD24 and XCR1. d, Heatmap shows expression of the maturation markers CD80, CD86 and PD-L1 on DCs within B16-F10 tumors at end of combination therapy (Day 5). The fold change of the geometric mean fluorescence intensity is shown. c-JunΔ/ΔCD11c-Cre or Ccl2−/− DC activation markers are compared to the control (c-Junfl/fl). (n = 3 mice per group from 1 experiment). *P< 0.05, ** P< 0.01 and *** P< 0.001. e, Gating strategy to identify T cells (TC; TCRβ+) positive for CD4 or CD8α, monocytes (CD11b+ Ly6-C+Ly6-G-), neutrophils (CD11b+ Ly6-CintLy6-G+) and γδ T cells (TCRγδint) in B16-F10 tumor-bearing mice on IMQ-therapy end point (Day 8). f, CCL2 expression levels were assessed in BM-DCs of the indicated genotype using qRT–PCR (left) and ELISA (right) assays. The cells were treated as described in Extended Data Fig. 6a. (Left: n = 6 mice per group from 3 independent experiments, Right: c-Junfl/fl: n = 4 mice per group, c-JunΔ/ΔCD11c-Cre n = 3 mice per group from 1 experiment). g, B16-F10 tumors were implanted in c-Junfl/fl and c-JunΔ/ΔCD11c-Cre mice treated topically with IMQ, and systemically with IFN-α (see Extended Data Fig. 2b). (c-Junfl/f: n = 6, IMQ topical + IFN-α n = 7, c-JunΔ/ΔCD11c-Cre: n = 8, IMQ topical + IFN-α n = 8, n is the number of mice pooled from 2 independent experiments). h, Tumor-immune cell infiltrate was analyzed by flow cytometry in B16-F10 tumors from (g). IMQ topical + IFN-α: c-Junfl/fl n = 4 CD4, n = 8 CD8 TC; c-JunΔ/ΔCD11c-Cre n = 3 CD4, n = 7 CD8 TC; n is the number of mice pooled from 2 independent experiments (CD8) or 1 experiment (CD4 TC). Data are plotted as mean ± SEM. Dots in b, f and h represent biological replicates. P‐values were calculated using unpaired, two-tailed t-tests with Welch´s correction (h), one-way ANOVA with Tukey´s post-test (b) and two-way ANOVA with Sidak´s post-test (d, f, g). Source data
Extended Data Fig. 8
Extended Data Fig. 8. Role of c-Jun in the development and function of pDCs.
a, Heatmap depicts AP-1 family member expression in c-Junfl/fl and c-JunΔ/ΔMx1-Cre bone-marrow-derived (BM) -pDCs stimulated with IMQ (4 h). The heatmap shows the fold change compared to LAL-treated c-Junfl/fl BM-pDCs as determined by qRT–PCR analysis. Asterisk shows significant differences in c-Junfl/fl IMQ versus c-Junfl/fl control BM-pDCs. Data are pooled from 5 independent experiments. b, Western blot of c-Jun protein in c-Junfl/fl and c-JunΔ/ΔMx1-Cre BM-pDCs stimulated with IMQ (16 h). c, Gzmb and Trail mRNA expression levels were analyzed by qRT–PCR in BM-pDCs stimulated with IMQ (4 h). (Gzmb: c-Junfl/fl n = 5 mice, c-JunΔ/ΔMx1-Cre n = 6 mice; Trail: LAL group n = 7 mice, IMQ group n = 8 mice; Data are pooled from 3 (Gzmb) and 4 (Trail) independent experiments). d, qRT–PCR detection of Il6 mRNA (4 h) and ELISA detection of IL-6 protein (12 h) was performed on IMQ-stimulated BM-pDCs. (mRNA: n = 6 and IMQ: c-Junfl/fl n = 5, c-JunΔ/ΔMx1-Cre n = 7; Protein: n = 5 and c-JunΔ/ΔMx1-Cre: n = 7, IMQ n = 9; n is the number of mice pooled from 3 independent experiments). e, Ifnb mRNA and IFN- β protein levels were determined in BM-pDCs as described in (d). (mRNA: n = 7 and c-Junfl/fl n = 8, Protein: n = 5 and c-JunΔ/ΔMx1-Cre: n = 5, IMQ n = 9; n is the number of mice pooled from 4 independent experiments). f, pDC migration assay: BM-pDCs were allowed to migrate towards rCCL2 (3 h). g, Migration index of c-Junfl/fl and c-JunΔ/ΔMx1-Cre BM-pDCs in a migration assay performed as described in (f). (n = 4 per group and c-Junfl/fl: n = 8, rCCL2 n = 4; n is the number of mice pooled from 5 independent experiments). h, Flow cytometric analysis of CCR2 expression on BM-pDCs. Left: Mean Fluorescence Intensity of CCR2. Right: Representative histograms. (n = 4 per group and c-Junfl/fl: Isotype n = 10, CCR2 n = 9; n is the number of mice from 4 independent experiments). i, j, k, l Splenic pDCs (i) or lymph node pDCs (k) in c-Junfl/fl and c-JunΔ/ΔCD11c-Cre mice treated with IMQ topically and orally (12 h) are shown in flow cytometry plots. Frequency of splenic pDCs (j) and lymph node pDCs (l) is shown among live, single cells. (n = 6 mice per group and n = 5 in the c-Junfl/fl: IMQ group (j, l); n is the number of mice pooled from 2 (j, l) independent experiments). Data are shown as mean ± SEM. Dots in c-e, g, h, j and l represent biological replicates. P‐values were calculated by unpaired, two-tailed t-test (a), and two-way ANOVA with Tukey´s post-test (c-e, g, h, j and l). Source data
Extended Data Fig. 9
Extended Data Fig. 9. Myeloid cell composition in B16-F10 tumors after IMQ therapy.
a, Flow cytometric gating strategy for lymphoid cells (see Fig. 7c, d) and myeloid cells (see Extended Data Fig. 9b–h). Cells were gated as follows: Within the viable cell gate: Immune cells (CD45+), T cells (CD3+, TCRβ+) CD4 or CD8α positive, B cells (-T cells, CD19+, B220+), Neutrophils (-B cells, Ly6-G+, CD11b+), Macrophages (-Neutrophils, CD64+, CD11b+, F4/80+), Monocytes (-Macrophages, Ly6-C+, CD11b+), pDCs (-Monocytes, BST-2+, B220+), DCs (-pDC, CD11c+, MHC-II+) XCR1 (Type I) or CD11b (Type II) positive and NK cells (-DC, NK1.1+). b, Stacked bar graph (horizontal) shows the frequency of myeloid cells in B16-F10 tumors after indicated treatment (Day 5). *P < 0.05. In b-e Control n = 5, IMQ: oral n = 4, topical n = 4, topical &oral n = 5; n is the number of mice from 1 experiment. c, Percentage of pDCs expressing PD-L1, CD80 or CD86, as assessed by flow cytometry in B16-F10 tumors treated as described in (b). d, Percentage of Type II DCs expressing PD-L1, CD80 or CD86, as assessed by flow cytometry at therapy end point (Day 5) as described in (b). e, Percentage of Type I DCs expressing PD-L1, CD80 or CD86, as assessed by flow cytometry, in B16-F10 tumors treated as described in (b). f, Frequency of CD8α T cells, positive for CD44 or PD-1 and TIM-3, was assessed by flow cytometry in B16-F10 at the ethical end point (Day 10). Mice were treated with IMQ orally or topically or both for 5 days. In f-h Control n = 5, IMQ: oral n = 3, topical n = 4, topical & oral n = 5; n is the number of mice from 1 experiment. g, Stacked bar graph (horizontal) shows the frequency of myeloid cells in B16-F10 tumors at the ethical end point (Day 10), as described in (f). h, Percentage of pDCs expressing PD-L1, CD80 or CD86, as assessed by flow cytometry in B16-F10 tumors treated as described in (f). Data are plotted as mean ± SEM. Dots in c-f and h represent biological replicates. P‐values were calculated using one-way ANOVA with Dunnett´s post-test (b-h). Source data
Extended Data Fig. 10
Extended Data Fig. 10. Antitumor effects of anti-PD-1 combined with IMQ on B16-F10 melanoma.
a, Schematic representation of the murine model used to test the antitumor effect of anti-PD-1 therapy and memory formation after combination therapy. To test anti-PD-1 therapy mice were treated with anti-PD-1 antibody (200 µg, i.p.) every other day (3 times). To test memory formation: B16 tumors were surgically resected after five days of consecutive IMQ treatment (topical and oral), and mice were re-challenged at the indicated time-point. b, Tumor growth was monitored in B16-F10 melanoma-bearing mice. Mice were treated with anti-PD-1 antibody (every other day, 3 times), and/or IMQ topically and orally (5 consecutive days). (Vehicle: Ig Control and anti-PD-1 n = 6, IMQ topical &oral: Ig Control and anti-PD-1 n = 5; n is the number of mice from 1 experiment). c, Tumor growth was monitored in B16-mOVA melanoma-bearing mice during Therapy (5 days) and after treatment termination (post-Therapy). Therapy included treatment with anti-PD-1 antibody (every other day, 3 times), and/or IMQ topically and orally (5 consecutive days). In c-e n = 4 mice per group; 1 experiment. d, Frequency of CD8α T cells and of OVA-specific (SIINFEKL) CD8α T was assessed by flow cytometry in tumors described in (c). e, Percentage of Type I and Type II DCs and pDCs was analyzed by flow cytometry in tumors described in (c). Data are shown as mean ± SEM. Dots in d and e represent biological replicates. P‐values were calculated by unpaired, two-tailed t-test (d, e) and two-way ANOVA with Tukey´s post-test (b, c). Source data

References

    1. Esfahani, K. et al. A review of cancer immunotherapy: from the past, to the present, to the future. Curr. Oncol.27, S87–s97 (2020). - PMC - PubMed
    1. Pasare, C. & Medzhitov, R. Toll-like receptors: linking innate and adaptive immunity. Adv. Exp. Med. Biol.560, 11–18 (2005). - PubMed
    1. Hemmi, H. et al. Small anti-viral compounds activate immune cells via the TLR7 MyD88-dependent signaling pathway. Nat. Immunol.3, 196–200 (2002). - PubMed
    1. Hadley, G., Derry, S. & Moore, R. A. Imiquimod for actinic keratosis: systematic review and meta-analysis. J. Investig. Dermatol.126, 1251–1255 (2006). - PubMed
    1. Vacchelli, E. et al. Trial watch: FDA-approved Toll-like receptor agonists for cancer therapy. Oncoimmunology1, 894–907 (2012). - PMC - PubMed

MeSH terms