. 2025 Jan 23;15(1):2964.
doi: 10.1038/s41598-025-87235-w.

An amplification mechanism for weak ELF magnetic fields quantum-bio effects in cancer cells

Affiliations

An amplification mechanism for weak ELF magnetic fields quantum-bio effects in cancer cells

Amirali Zandieh et al. Sci Rep. .

Abstract

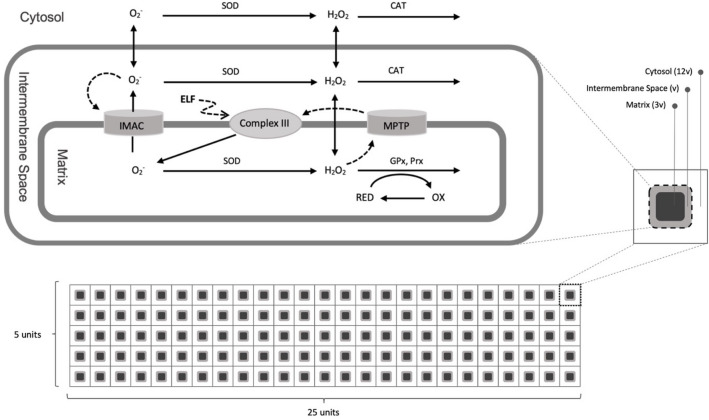
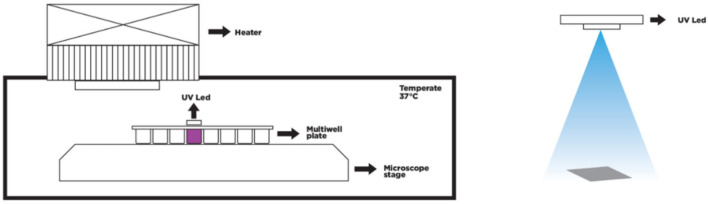
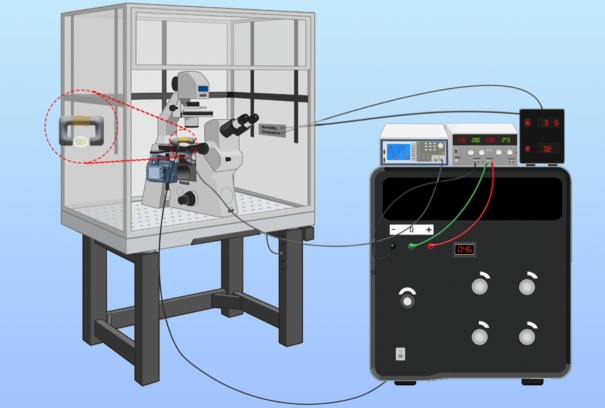
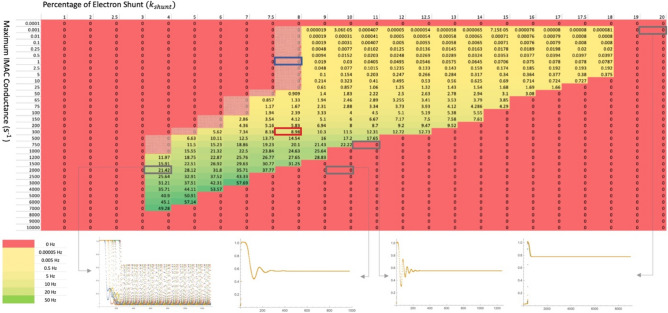
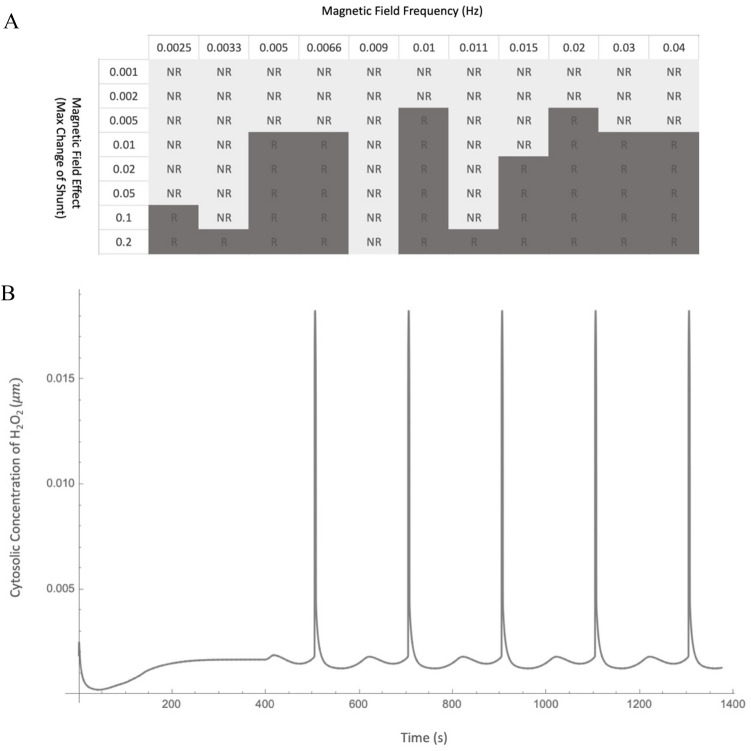
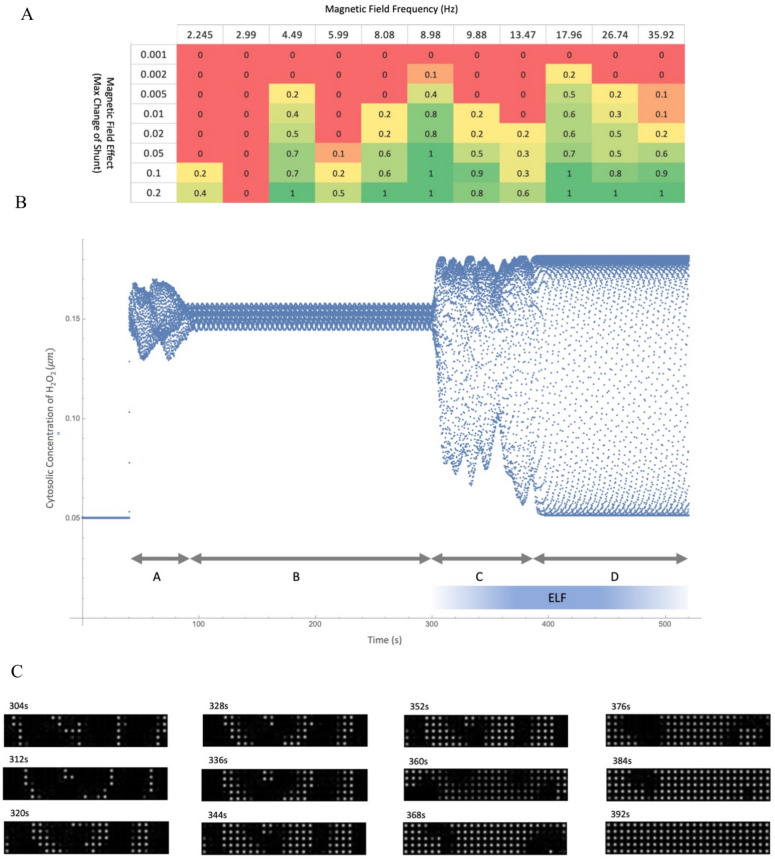
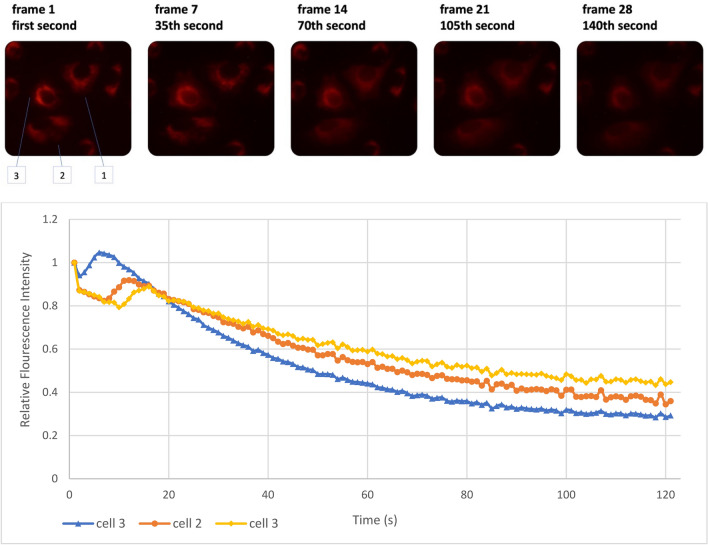
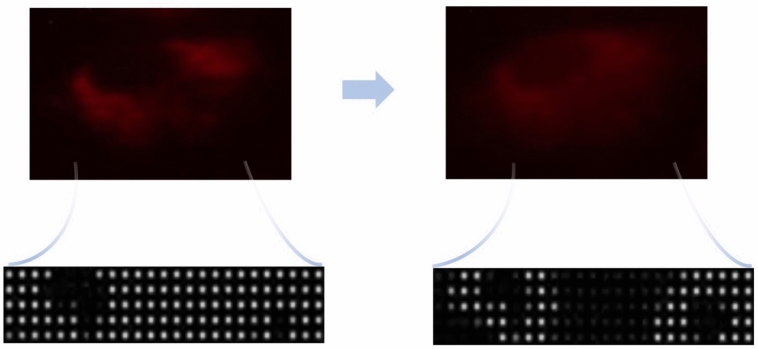
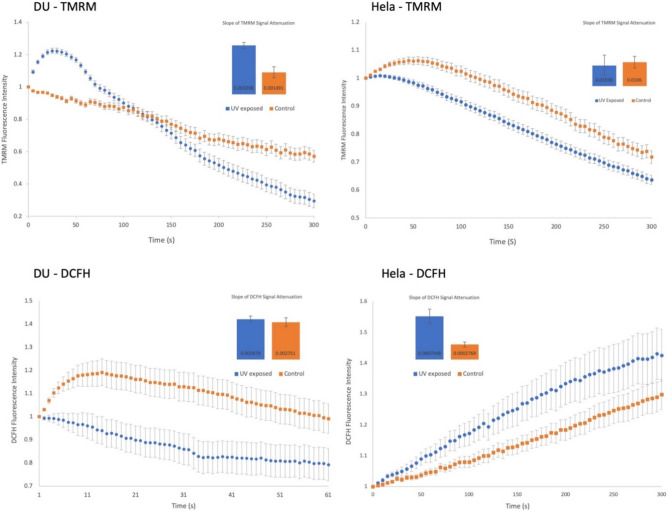
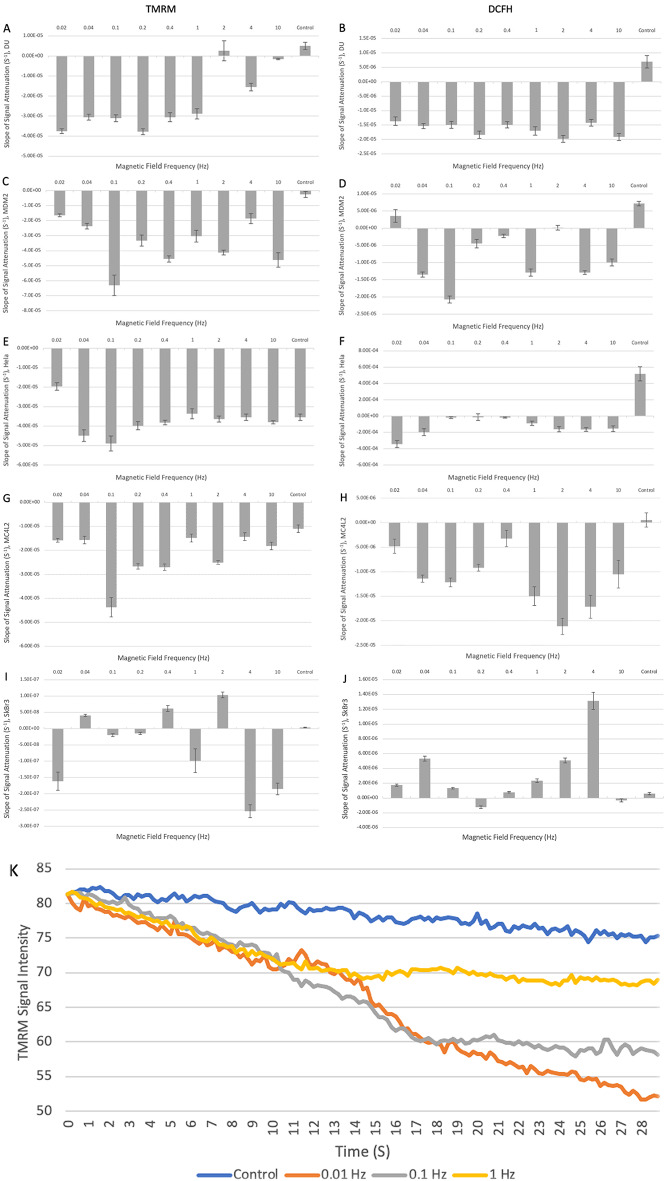
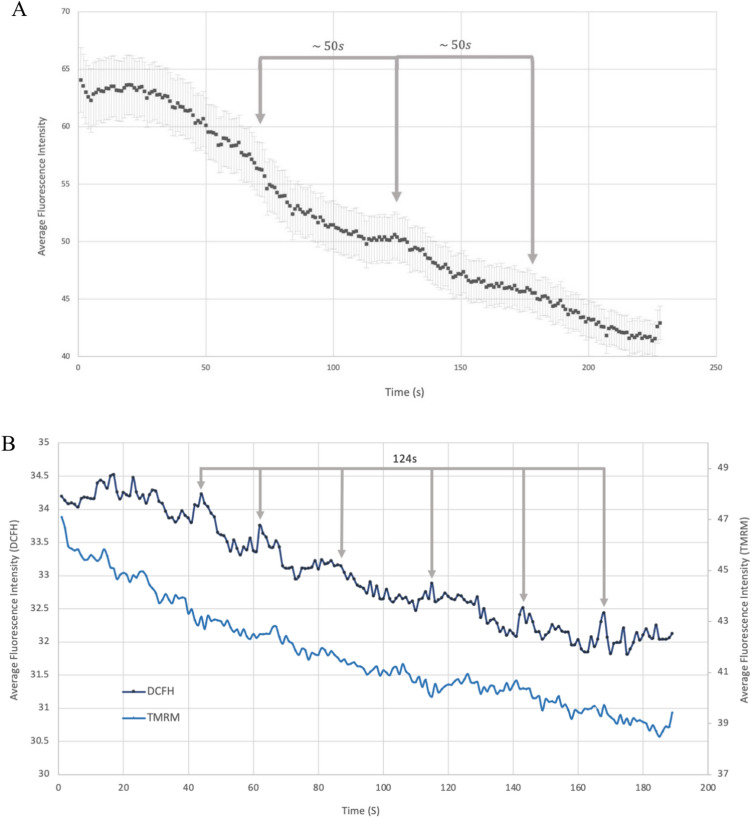
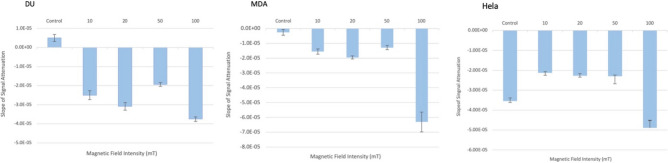
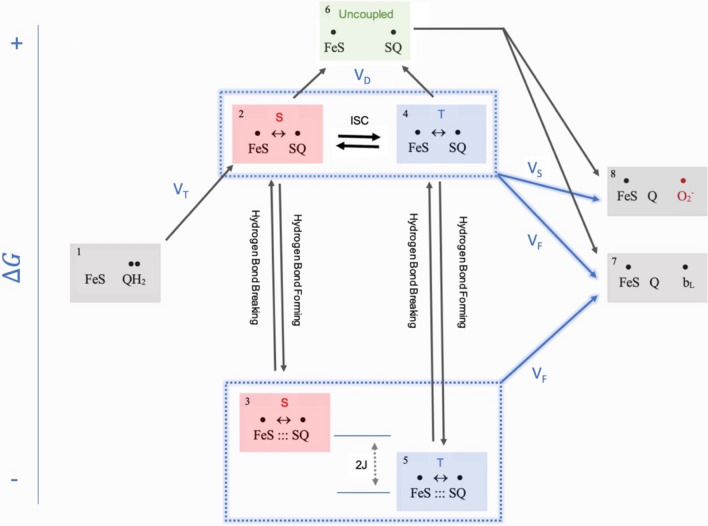
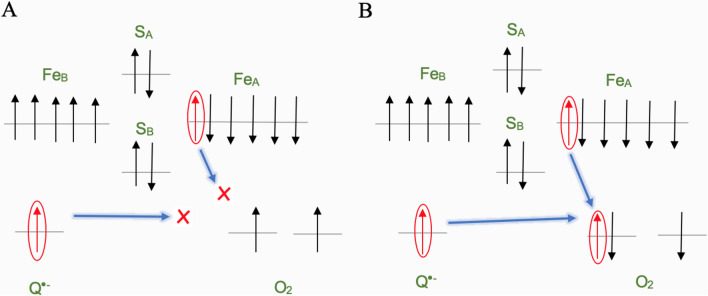
Observing quantum mechanical characteristics in biological processes is a surprising and important discovery. One example, which is gaining more experimental evidence and practical applications, is the effect of weak magnetic fields with extremely low frequencies on cells, especially cancerous ones. In this study, we use a mathematical model of ROS dynamics in cancer cells to show how ROS oscillatory patterns can act as a resonator to amplify the small effects of the magnetic fields on the radical pair dynamics in mitochondrial Complex III. We suggest such a resonator can act in two modes for distinct states in cancer cells: (1) cells at the edge of mitochondrial oscillation and (2) cells with local oscillatory patches. When exposed to magnetic fields, the first group exhibits high-amplitude oscillations, while the second group synchronizes to reach a whole-cell oscillation. Both types of amplification are frequency-dependent in the range of hertz and sub-hertz. We use UV radiation as a positive control to observe the two states of cells in DU and HELA cell lines. Application of magnetic fields shows frequency-dependent results on both the ROS and mitochondrial potential which agree with the model for both type of cells. We also observe the oscillatory behavior in the time-lapse fluorescence microscopy for 0.02 and 0.04 Hz magnetic fields. Finally, we investigate the dependence of the results on the field strength and propose a quantum spin-forbidden mechanism for the effect of magnetic fields on superoxide production in QO site of mitochondrial Complex III.


Conflict of interest statement

Declarations. Competing interests: The authors declare no competing interests.

Figures

Fig. 1
Fig. 1
The three-compartment model for a single mitochondrion unit (top) in the network. A lattice of formula image units (bottom) illustrates the mitochondrial network.
Fig. 2
Fig. 2
Setup for fluorescent microscopy of a 96-well plate under the emission of UV.
Fig. 3
Fig. 3
A schematic overview of the devices for real-time fluorescent microscopy of cells under the exposure of the alternating magnetic field.
Fig. 4
Fig. 4
Frequencies of mitochondrial oscillation for systems with different values of percentage superoxide shunt and maximum superoxide conductance through IMAC channels. Zero values indicate no oscillation. The bottom plots show the dynamic of an IMAC open probability for the cell with the set of parameters highlighted.
Fig. 5
Fig. 5
(A) Effect of Frequency and Intensity of the applied magnetic field on triggering mitochondrial oscillation in the border systems. Simulations were performed for shunt = 8 and kIMAC = 1 s−1 where a frequency of 0.01 Hz was obtained by extrapolating the frequency values of neighboring cells. Dark gray (R) cells indicate triggered oscillation while the light gray cells (NR) denote that the applied field failed to induce whole cell oscillation. (B) The oscillation of cytosolic concentration of H2O2 when a 10 percent fluctuation in superoxide production by a 0.01 Hz magnetic field is applied. Magnetic field is applied from 400 s. The vertical axis indicates the spatial average of H2O2 concentration throughout the cytosolic units in the system. About 8 folds increase in maximum level of cytosolic H2O2 can be observed compared to the baseline concentration (formula imageformula image to formula image formula image M).
Fig. 6
Fig. 6
Time series depiction of superoxide concentration in each unit of the mitochondrial network model. Several patches of mitochondria with simultaneous release of superoxide into the cytosol are evident. The first and the second rows show two successive periods of the oscillation. The brightness of each white dot corresponds to the IMAC open probability of its respective mitochondrion which correlates with the superoxide efflux into the intermembrane space.
Fig. 7
Fig. 7
Synchronization of mitochondrial oscillatory patches under the effect of magnetic field. (A) Effect of Frequency and Intensity of applied magnetic field on synchronization of mitochondrial oscillation in the network. Numbers in the cells indicate the proportion of synchronized network out of 10 simulations. Simulations were performed for shunt = 8 and kIMAC = 300 s−1 where an unsynchronized oscillation with intrinsic Frequency of 8.98 Hz was observed (cell with red border in Fig. 4). (B) The dynamic of cytosolic H2O2 concentration (averaged over all cytosolic units in the system) when a 10 percent fluctuation of superoxide production under 8.98 Hz magnetic field is applied. After several asynchronous periods of oscillations (part A), a number of synchronous patches of mitochondria emerges in the network (part B). By applying the oscillatory magnetic field, the patches start to merge into a synchronized oscillatory unit (part C) until the whole network reaches a fully synchronized state (part D). The apparently convoluted diagram in the figure is due to the two very different dynamic time scales of oscillations and synchronization states. (C) Time series depiction of superoxide concentration in each unit of the mitochondrial network model under the effect of alternating magnetic field. An 8.98 Hz magnetic field is synchronizing the out of patches of oscillatory mitochondria progressively.
Fig. 8
Fig. 8
Different simulated topologies of the model with varying levels of connectedness in the mitochondrial network. White cells represent the mitochondrial matrix, while black cells represent either the mitochondrial intermembrane space or cytosol. All structures have the same average mitochondrial density across the whole cell.
Fig. 9
Fig. 9
Three cases of transient increase in TMRE emission for the UV treated cells of DU cell-line. The upper panel depicts an increase in signal in the second picture (second 35) (see videos in the supplementary). The same is evident in the lower panel in which an elevated signal emission in one of the cells is followed by same phenomenon for the other two adjacent cells.
Fig. 10
Fig. 10
Sudden change in signal intensity of TMRE in certain parts of a cell may indicate patchy structure of mitochondrial network oscillation.
Fig. 11
Fig. 11
Fluorescence intensity of TMRE (upper plots) and DCFH (lower plots) for DU and Hela after a 60s UV exposure. Slope of signal reduction is shown for each plot.
Fig. 12
Fig. 12
(AJ) The rows illustrate the rate of signal attenuation of TMRE and DCFH emissions for DU, MDA, Hela, MC4L2 and SkBr3 cell line, respectively. The rates were averaged for 70 randomly selected cells for each experiment. (G) Fluorescence intensity for four DU cells exposed to magnetic field with different frequencies. Each series indicate a single cell.
Fig. 13
Fig. 13
Oscillatory behavior of fluorescent signals. (A) Average TMRM signal of intensity of DU cells (number of cells: 70) under the effect of alternating magnetic field (0.02 Hz and 100 mT). Three periods of oscillation are apparent in the plot (roughly 50 s/0.02 Hz). (B) Average signal intensity of TMRM and DCFH for 70 randomly selected MC4L2 cells exposed to a 0.04 Hz alternating magnetic field.
Fig. 14
Fig. 14
Slope of TMRE attenuation for two cell lines while exposed to the magnetic fields with different field intensities. The frequencies are 0.01 Hz for DU and 0.05 Hz for MDA and Hela cells. The table of p-values resulted from t tests for each pair of groups (control and tested intensities) are available in supplementary.
Fig. 15
Fig. 15
A simplified schematic of the stages of electron transfer in the QO site of Complex III. Each box represents an electronic state. In contrast to states 2 and 4, the semiquinone in states 3 and 5 are attached to histidine of Rieske cluster which leads to large exchange value for the radical pair.
Fig. 16
Fig. 16
Transfer of electron to the Oxygen molecule in the triplet state. In contrast to right section (B), a spin forbidden condition prevents the transfer of electron from either species of the Semiquinone/Iron-Sulfur radical pair to the oxygen molecule when electron spins aligned in the same direction (A).

Similar articles

Cited by

References

    1. Blackman, C. F. et al. Induction of calcium-ion efflux from brain tissue by radio-frequency radiation: Effects of modulation frequency and field strength. Radio Sci.14(6S), 93–98 (1979).
    1. Goodman, R., Bassett, C. A. & Henderson, A. S. Pulsing electromagnetic fields induce cellular transcription. Science220(4603), 1283–1285 (1983). - PubMed
    1. Reiter, R. J. Melatonin in the context of the reported bioeffects of environmental electromagnetic fields. Bioelectrochem. Bioenerg.47(1), 135–142 (1998).
    1. Adair, R. K. Constraints on biological effects of weak extremely-low-frequency electromagnetic fields. Phys. Rev. A43(2), 1039 (1991). - PubMed
    1. Binhi, V. N. & Rubin, A. B. Magnetobiology: the kT paradox and possible solutions. Electromagn. Biol. Med.26(1), 45–62 (2007). - PubMed

LinkOut - more resources