. 2025 Mar;39(3):577-589.
doi: 10.1038/s41375-024-02491-5. Epub 2025 Jan 23.

Targeting LMO2-induced autocrine FLT3 signaling to overcome chemoresistance in early T-cell precursor acute lymphoblastic leukemia

Affiliations

Targeting LMO2-induced autocrine FLT3 signaling to overcome chemoresistance in early T-cell precursor acute lymphoblastic leukemia

Cedric S Tremblay et al. Leukemia. 2025 Mar.

Abstract

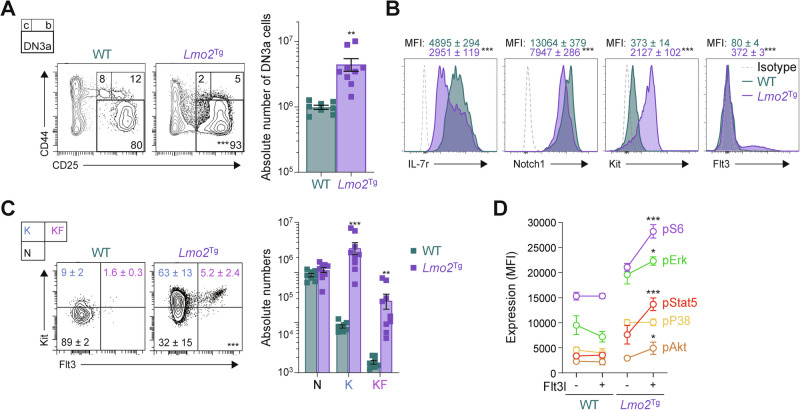
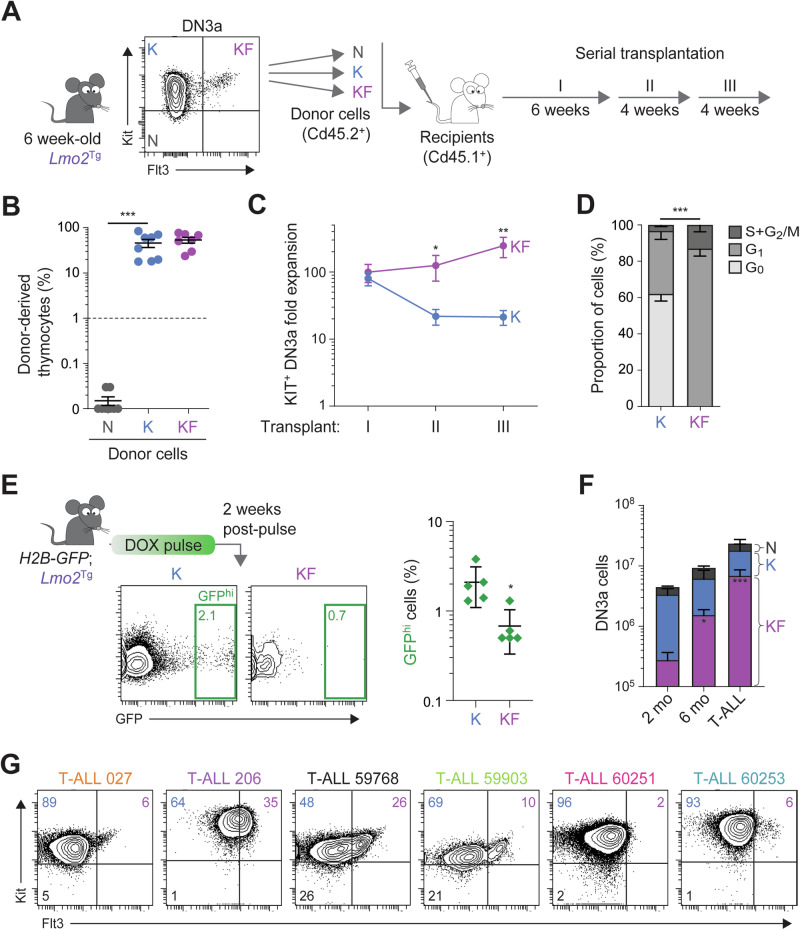
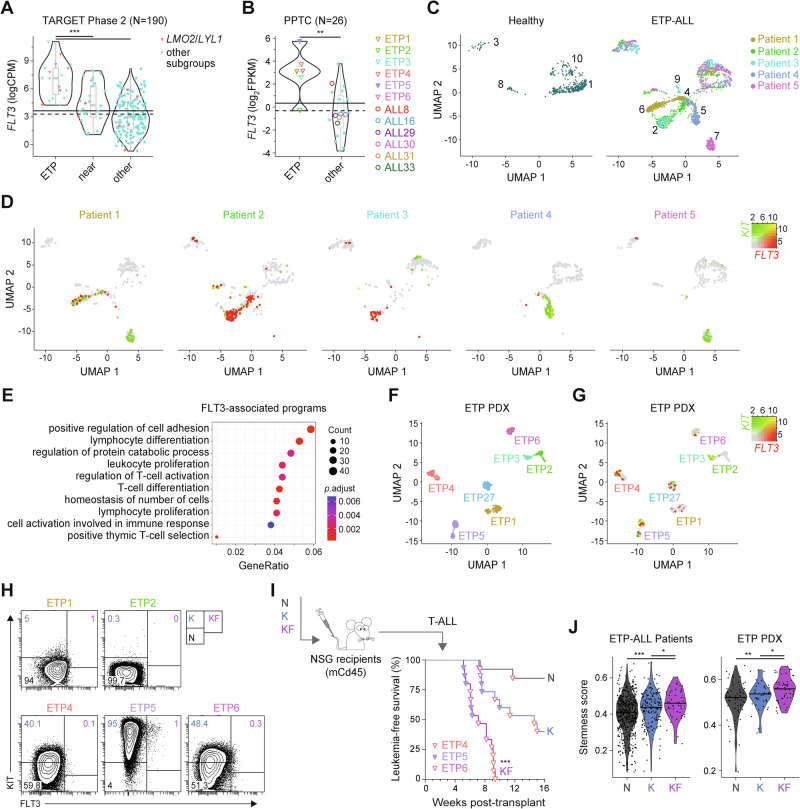
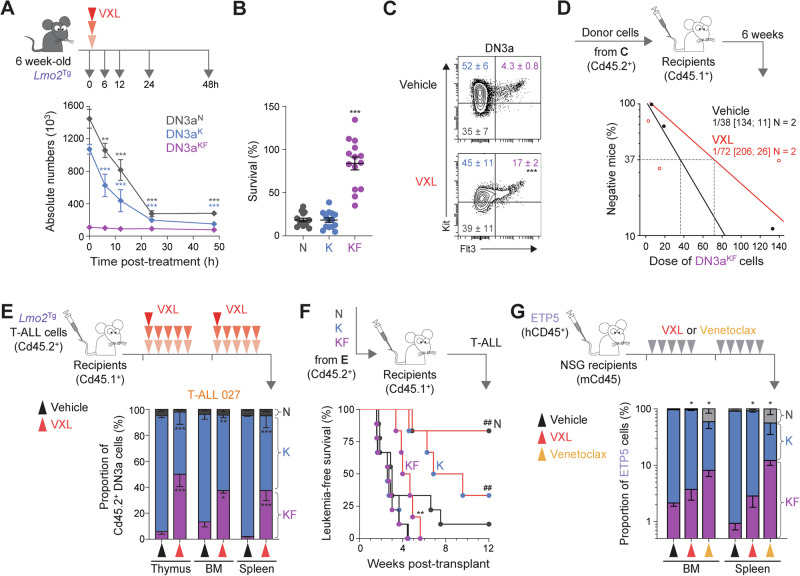
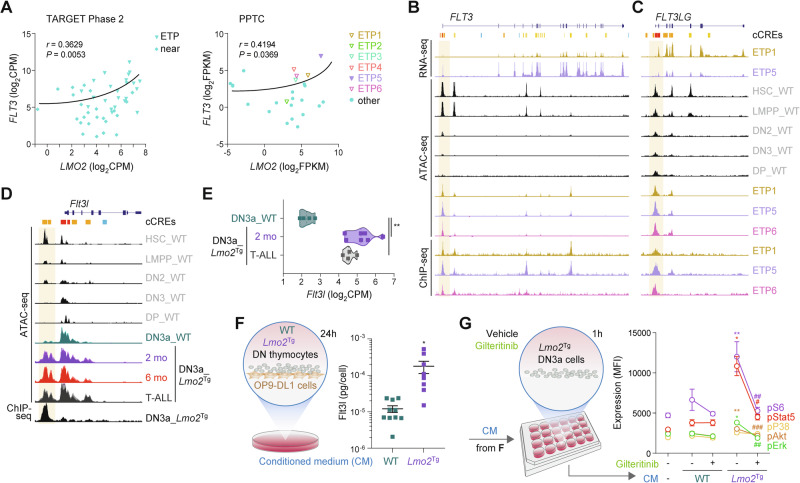
Early T-cell Precursor Acute Lymphoblastic Leukemia (ETP-ALL) is an immature subtype of T-cell acute lymphoblastic leukemia (T-ALL) commonly show deregulation of the LMO2-LYL1 stem cell transcription factors, activating mutations of cytokine receptor signaling, and poor early response to intensive chemotherapy. Previously, studies of the Lmo2 transgenic mouse model of ETP-ALL identified a population of stem-like T-cell progenitors with long-term self-renewal capacity and intrinsic chemotherapy resistance linked to cellular quiescence. Here, analyses of Lmo2 transgenic mice, patient-derived xenografts, and single-cell RNA-sequencing data from primary ETP-ALL identified a rare subpopulation of leukemic stem cells expressing high levels of the cytokine receptor FLT3. Despite a highly proliferative state, these FLT3-overexpressing cells had long-term self-renewal capacity and almost complete resistance to chemotherapy. Chromatin immunoprecipitation and assay for transposase-accessible chromatin sequencing demonstrated FLT3 and its ligand may be direct targets of the LMO2 stem-cell complex. Media conditioned by Lmo2 transgenic thymocytes revealed an autocrine FLT3-dependent signaling loop that could be targeted by the FLT3 inhibitor gilteritinib. Consequently, gilteritinib impaired in vivo growth of ETP-ALL and improved the sensitivity to chemotherapy. Furthermore, gilteritinib enhanced response to the BCL2 inhibitor venetoclax, which may enable "chemo-free" treatment of ETP-ALL. Together, these data provide a cellular and molecular explanation for enhanced cytokine signaling in LMO2-driven ETP-ALL beyond activating mutations and a rationale for clinical trials of FLT3 inhibitors in ETP-ALL.


Conflict of interest statement

Competing interests: The authors declare no competing interests.

Figures

Fig. 1
Fig. 1. Aberrant response to Flt3l in preleukemic Lmo2-transgenic DN3a thymocytes.
A Representative flow cytometric analysis of DN3 thymocyte subsets (DN3a, b, and c) in 6-week old wild-type (WT) and Lmo2-transgenic (Lmo2Tg) mice. Median, 2-way ANOVA with Šídák correction test (DN3 subsets; complete data in Fig. S1A) and Student’s t-test (absolute number of DN3a cells); **P < 0.01, ***P < 0.001 compared to WT mice. B Levels of Il-7r, Notch1, Kit (CD117), and Flt3 (CD135) at the surface of DN3a T-cell progenitors from 6-week old WT and Lmo2Tg mice. Mean fluorescence intensity (MFI) ± S.E.M. of N > 5 individual mice. C Representative flow cytometry analysis (left) and absolute numbers (right) of DN3a thymocyte subpopulations in the thymus of 6-week old WT and Lmo2Tg mice, assessed by flow cytometry using the Kit and Flt3 surface markers. N (Kit-Flt3-), K (Kit+Flt3low), and KF (KithiFlt3hi) populations are indicated. Median ± S.E.M., 2-way ANOVA with Tukey’s correction test; **P < 0.01, ***P < 0.001 compared to WT mice. D Levels of activated Akt (pAkt), Erk (pErk), P38 (pP38), S6 (pS6), and Stat5 (pStat5) in DN3a thymocytes from 6-week-old mice stimulated with Flt3-ligand (Flt3l). MFI ± S.E.M. of N = 3 biological replicates are shown, ordinary 1-way ANOVA with Tukey’s correction test; *P < 0.05, **P < 0.01, ***P < 0.001 compared to basal levels.
Fig. 2
Fig. 2. Flt3 overexpression associated with proliferation and expansion of preLSCs.
A Scheme for serial transplantation of purified N, K, and KF DN3a T-cell progenitor populations into primary (I), secondary (II) and tertiary (III) recipients. B Repopulation capacity of donor-derived N, K, and KF populations of DN3a thymocytes enumerated in the thymus of primary recipient mice. Proportion (%) of donor-derived thymocytes, Median ± 95% CI, ordinary 1-way ANOVA with Tukey’s correction test. Minimal repopulation capacity (fold of 1) is indicated by a dashed line. C Fold expansion of donor-derived Lmo2-transgenic K and KF populations of DN3a thymocytes enumerated in the thymus of primary (I), secondary (II), and tertiary (III) recipients. Mean ± S.E.M., 2-way ANOVA with Tukey’s correction test; *P < 0.05 and **P < 0.01 compared to K donor cells. D Cell-cycle analysis in subpopulations of DN3a thymocytes from preleukemic Lmo2Tg mice. Mean ± S.E.M., Student’s t test; ***P < 0.001. E Scheme for H2B-GFP labeling followed by 2 weeks of chase without Doxycycline, with representative flow cytometric analysis of GFP expression in subpopulations of DN3a thymocytes from H2B-GFP; Lmo2Tg mice. Populations retaining high levels of H2B-GFP labeling (GFPhi) are framed, with the average proportion (%) indicated. Mean ± S.E.M., 2-way ANOVA with Tukey’s correction test; *P < 0.05 and ***P < 0.001. F Absolute numbers of DN3a T-cell populations in the thymus of Lmo2Tg mice at 2 months, 6 months, and at overt T-ALL. Median ± S.E.M., 2-way ANOVA with Tukey’s correction test; *P < 0.05 and ***P < 0.001. G Representative flow cytometry analysis of DN3a thymocyte subpopulations in primary Lmo2Tg leukemias. Average proportion of N, K, and KF populations are indicated for each T-ALL.
Fig. 3
Fig. 3. LSCs enriched in KF population from human ETP-ALL.
Expression levels of FLT3 in primary T-ALL samples from the A TARGET-ALL Phase 2 and B PPTC cohorts. Immunophenotypically-defined subtypes of T-ALL listed in the TARGET-ALL Phase 2 cohort as ETP, near-ETP (near) and more mature T-ALL subtypes (other). CPM counts per million mapped reads, FPKM fragments per kilo base of transcript per million mapped fragments, PPTC Pediatric Preclinical Testing Consortium. Solid line: mean; dashed line: median. #Wilcox P = 0.019; Student’s t test P < 0.05 compared to other subgroups. Two-dimension uniform manifold approximation, and projection (UMAP) of the processed single-cell RNA-seq gene expression data from 4–5 healthy individuals and 5 patients with refractory/relapsed ETP-ALL visualized in (C) distinct patient-specific clusters along with heterogeneous clusters, and (D) log-normalized FLT3 and KIT expression in these clusters for healthy donors (merged) and individual ETP-ALL patients. Expression of KIT in green and FLT3 in red, with co-expression in yellow (KF cells). E Gene Ontology (GO) enrichment of the top 500 differentially-expressed genes (DEGs) in KF compared to K cells from all ETP-ALL patients analyzed. The size of the circle represents the number of genes enriched in the pathway, the color of the circle represents the adjusted P value. Two-dimension UMAP visualization of single-cell RNA-seq data from 7 individual PDX of human ETP-ALL of (F) color-coded tumor cell clusters and (G) log-normalized FLT3 and KIT expression in these clusters. H Representative flow cytometry analysis of subpopulations of tumor cells in individual PDX of human ETP-ALL. Average proportion of N, K, and KF populations are indicated for each PDX models. I Flow sorting and schematic representation of the transplantation strategy of purified leukemic subpopulation of ETP4, ETP5, and ETP6 cells (top). Kaplan-Meier curves of mice injected with the purified populations (bottom). Log-rank (Mantel-Cox) test; ***P < 0.001 compared to K and N donor cell populations. J Stemness score inferred from the LMO2-associated preLSC gene signature for each tumor cell subpopulation in refractory/relapsed ETP-ALL samples and ETP PDXs.
Fig. 4
Fig. 4. Chemoresistance of FLT3-overexpressing preleukemic and leukemic repopulating cells.
A Treatment schematic and absolute numbers of DN3a thymocyte subpopulations in the thymus of 6-week old Lmo2Tg mice at the indicated time following administration of induction-like therapy for T-ALL (VXL: vincristine, dexamethasone, and L-asparaginase) [50]. Mean ± S.E.M., 2-way ANOVA with Tukey’s correction test; **P < 0.01 and ***P < 0.001 compared to untreated (0 h post-treatment). Survival (B) and representative flow cytometry analysis (C) of the DN3a T-cell progenitor subpopulations in the thymus of 6-week old Lmo2Tg mice, at 24 h following administration of vehicle or VXL chemotherapy. For survival analyses: Median ± S.E.M., ordinary 1-way ANOVA with Tukey’s correction test; ***P < 0.001 compared to other subpopulations. For the proportion of DN3a subpopulations: Median ± S.E.M., 2-way ANOVA with Tukey’s correction test; ***P < 0.001 compared to vehicle. D PreLSC frequency within the DN3aKF thymocyte population of Lmo2Tg mice treated with vehicle or VXL chemotherapy assessed by limiting dilution assays. Mice were scored positive when T-cell lineage reconstitution was >1%, as previously described [101]. PreLSC frequencies [95% confidence intervals] were calculated from 2 biological replicates. E Experimental setting for assessing the therapy-resistance of leukemic DN3a subpopulations in sublethally-irradiated Cd45.1+ recipients injected with Lmo2Tg primary T-ALL, treated with either vehicle and VXL chemotherapy (top) and proportion of leukemia-derived DN3a cell subpopulations in the thymus, bone marrow (BM) and spleen of recipients transplanted with the primary Lmo2Tg T-ALL 027, harvested 24 h after the last administration of VXL chemotherapy (bottom). F Schematic representation of the transplantation strategy of 5 × 104 purified leukemic DN3a subpopulations of T-ALL 027 cells harvested from the thymus of recipients, 24 h after the last administration of either vehicle or VXL chemotherapy into sublethally-irradiated secondary Cd45.1+ recipients (top). Kaplan-Meier curves of mice injected with the purified populations (bottom; Vehicle-treated DN3aN, N = 9; Vehicle-treated DN3aK, N = 9; Vehicle-treated DN3aKF, N = 9; VXL-treated DN3aN, N = 6; VXL-treated DN3aK, N = 6; VXL-treated DN3aKF, N = 6). Log-rank (Mantel-Cox) test; **P < 0.01 compared to Vehicle-treated DN3aKF; ##P < 0.01 compared to VXL-treated DN3aKF. G Experimental setting for testing the effect of VXL chemotherapy and venetoclax monotherapy on tumor burden in the ETP5 PDX model (top), and proportion of ETP5 cell subpopulations in the bone marrow (BM) and spleen of recipients harvested 24 h after the last dose of treatment (bottom). Sublethally-irradiated NSG recipients were transplanted with ETP5 cells, randomized, and subsequently treated when the average proportion of human leukemic cells reached 1% in the peripheral blood. Mean ± S.E.M., 2-way ANOVA with Tukey correction test; *P < 0.05 compared to vehicle.
Fig. 5
Fig. 5. Autocrine FLT3 signaling in LMO2-driven ETP-ALL.
A Correlative studies of FLT3 and LMO2 expression in (left) immunophenotypically-defined ETP and near-ETP (near) samples from the TARGET-ALL Phase 2 cohort, and (right) all samples from the PPTC cohort. CPM counts per million mapped reads, FPKM fragments per kilo base of transcript per million mapped fragments, PPTC Pediatric Preclinical Testing Consortium. Pearson correlation coefficient r is indicated. Student’s t-test. Integrative genomics viewer visualization of the FLT3 (B) and FLT3LG (C) loci in human ETP-ALL PDX samples. From top to bottom: candidate Cis-regulatory elements (cCREs) are indicated (red = promoter-like signature; orange = proximal enhancer-like signature, blue = CTCF-only); total messenger RNA (mRNA) analyzed by RNA-seq in ETP1 (mustard) and ETP5 (lavender) PDX tumors; chromatin accessibility from publicly available data (gray) in wild-type (WT) hematopoietic stem cells (HSC), FLT3-expressing lymphoid-primed multipotent progenitors (LMPP), DN2 and DN3 T-cell progenitors, DP mature T cells, as well as ATAC-seq data from ETP1 (mustard), ETP5 (lavender) and ETP6 (pink) PDX samples; LMO2 ChIP-seq signals in ETP1 (mustard), ETP5 (lavender) and ETP6 (pink) PDX tumors. D Integrative genomics viewer visualization of the Flt3l locus in mouse wild-type, preleukemic, and leukemic hematopoietic populations. From top to bottom: candidate Cis-regulatory elements (cCREs) are indicated (red = promoter-like signature; orange = proximal enhancer-like signature, blue = CTCF-only); chromatin accessibility from publicly available data (gray) in long-term HSCs (HSC), DN2a (DN2) and DN3 T-cell progenitors, DP mature T cells, as well as ATAC-seq data from WT (green), 2 month-old Lmo2Tg (2 mo; purple), 6 month-old Lmo2Tg (6 mo; red), leukemic Lmo2Tg (T-ALL; dark gray) DN3a thymocytes; ChIP-seq signals in Lmo2Tg DN3a thymocytes. E Expression levels of Flt3l in WT (green), 2-month-old Lmo2Tg (2 mo; purple), and leukemic Lmo2Tg (T-ALL; dark gray) DN3a thymocytes. CPM counts per million mapped reads. Median ± S.E.M., ordinary 1-way ANOVA with Tukey’s correction test; **P < 0.01 compared to WT. Levels of F Flt3-ligand (Flt3l) in conditioned media (CM) generated from wild-type (WT) or Lmo2Tg DN3a thymocytes co-cultured on OP9-DL1 cells for 24 h measured by ELISA, and G growth factor-mediated signaling effectors in Lmo2Tg DN3a cells stimulated with CM from WT or Lmo2Tg DN3a thymocytes for 1 h in presence of vehicle (DMSO) or gilteritinib, assessed by flow cytometry. For ELISA: Student’s t-test; *P < 0.05 compared to CM from WT DN thymocytes. For stimulation assays: Mean Fluorescence Intensity (MFI) ± of N = 4 individual animals analyzed in duplicate are shown. Mann-Whitney test; *P < 0.05 and **P < 0.01 compared to no stimulation; #P < 0.05, ##P < 0.01 and ###P < 0.001 compared to vehicle.
Fig. 6
Fig. 6. Targeting FLT3 signaling enhances response to chemotherapy in ETP-ALL.
A Experimental setting for testing the efficacy of gilteritinib monotherapy in several PDX models of human ETP-ALL (top). NSG recipients were randomized and subsequently treated when the average proportion of human leukemic cells reached 1% in the peripheral blood. Kaplan-Meier curves of sublethally-irradiated recipients injected with 5 ETP-ALL PDX models administered with either vehicle or gilteritinib (bottom). Log-rank (Mantel-Cox) test; **P < 0.01 and ***P < 0.0001 compared to vehicle. The period of administration is indicated in light gray. B Correlative studies between the gilteritinib-induced leukemia growth delay (LGD) in days and FLT3 expression (MFI). Pearson correlation coefficient r is indicated. Student’s t-test. C Experimental setting for testing the efficacy of gilteritinib, VXL chemotherapy, venetoclax, and combination therapy in the ETP5 xenograft model of human ETP-ALL. NSG recipients were randomized after engraftment was confirmed in the peripheral blood, and subsequently treated when the average proportion of human leukemic cells in the peripheral blood reached 1%. D Absolute number of KF tumor cells in the bone marrow (BM) and spleen of ETP5 xenografted recipients, analyzed 24 h after the last drug administration. Mean ± S.E.M., 2-way ANOVA with Tukey correction test; *P < 0.05, **P < 0.01 and ***P < 0.001 as compared to vehicle; #P < 0.05 compared to VXL chemotherapy or venetoclax monotherapy. E Kaplan-Meier curves of ETP5 xenografted recipients, administered with either vehicle or gilteritinib, in combination with VXL chemotherapy or venetoclax. Log-rank (Mantel-Cox) test; ***P < 0.0001 compared to vehicle (Fig. S10D); #P < 0.05 and ###P < 0.01 compared to VXL chemotherapy or venetoclax monotherapy. The period of administration is indicated in light gray, with the number of recipients for each cohort indicated. F Correlation between between the onset of leukemia (days since randomization) in the and the numbers of KF cells in the BM and spleen of ETP5 xenografted recipients treated with either vehicle, gilteritinib, VXL chemotherapy, venetoclax or the combination therapies. Pearson correlation coefficient r is indicated. Student’s t-test.

Similar articles

Cited by

References

    1. Bonnet D, Dick JE. Human acute myeloid leukemia is organized as a hierarchy that originates from a primitive hematopoietic cell. Nat Med. 1997;3:730–7. - PubMed
    1. Lapidot T, Sirard C, Vormoor J, Murdoch B, Hoang T, Caceres-Cortes J, et al. A cell initiating human acute myeloid leukaemia after transplantation into SCID mice. Nature. 1994;367:645–8. - PubMed
    1. Chiu PP, Jiang H, Dick JE. Leukemia-initiating cells in human T-lymphoblastic leukemia exhibit glucocorticoid resistance. Blood. 2010;116:5268–79. - PubMed
    1. Morisot S, Wayne AS, Bohana-Kashtan O, Kaplan IM, Gocke CD, Hildreth R, et al. High frequencies of leukemia stem cells in poor-outcome childhood precursor-B acute lymphoblastic leukemias. Leukemia. 2010;24:1859–66. - PMC - PubMed
    1. Kamel AM, Elsharkawy NM, Kandeel EZ, Hanafi M, Samra M, Osman RA. Leukemia stem cell frequency at diagnosis correlates with measurable/minimal residual disease and impacts survival in adult acute myeloid leukemia. Front Oncol. 2022;12:867684. - PMC - PubMed

MeSH terms

LinkOut - more resources