

Metabolic resistance to pyrethroids with possible involvement of non-coding ribonucleic acids in Anopheles funestus, the major malaria vector in western Kenya
- PMID: 39849377
- PMCID: PMC11755866
- DOI: 10.1186/s12864-025-11260-2
Metabolic resistance to pyrethroids with possible involvement of non-coding ribonucleic acids in Anopheles funestus, the major malaria vector in western Kenya
Abstract
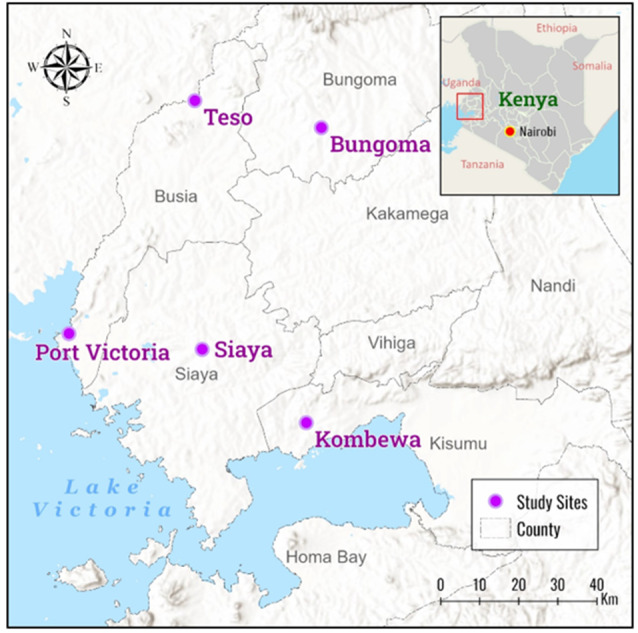
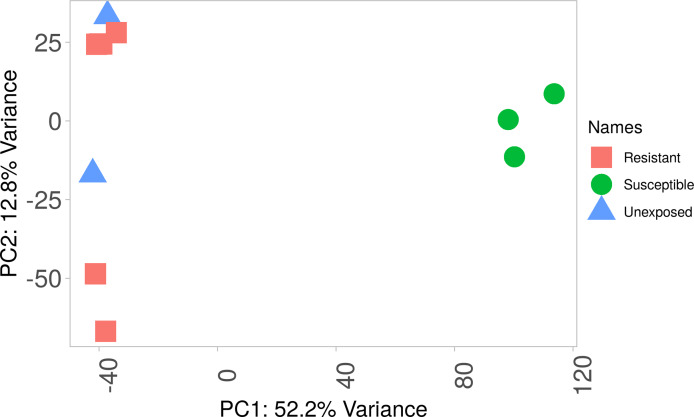
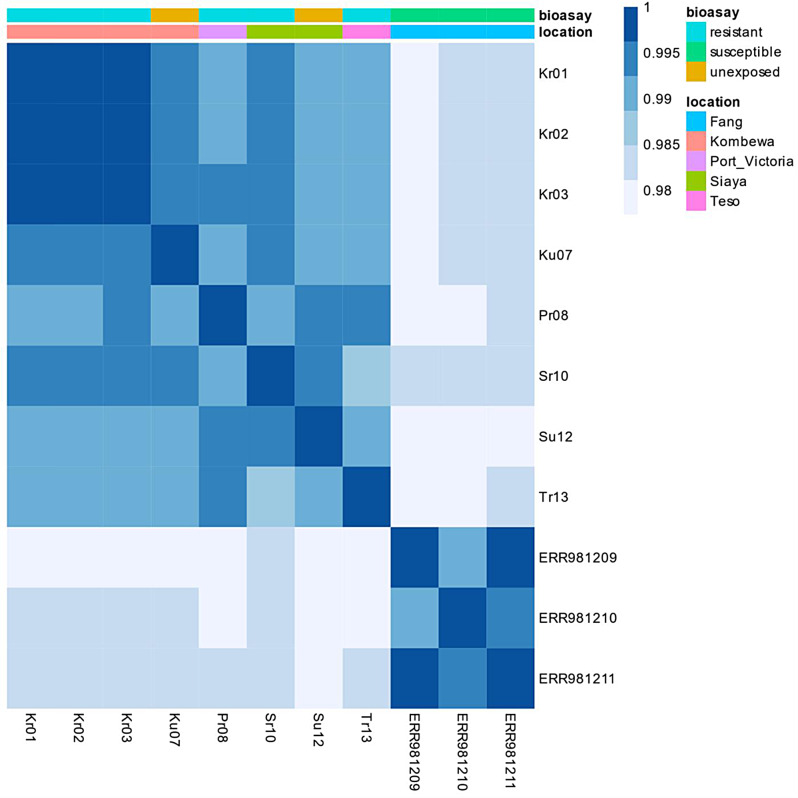
Background: The resurgence of Anopheles funestus, a dominant vector of human malaria in western Kenya was partly attributed to insecticide resistance. However, evidence on the molecular basis of pyrethroid resistance in western Kenya is limited. Here, we reported metabolic resistance mechanisms and demonstrated that multiple non-coding Ribonucleic Acids (ncRNAs) could play a potential role in An. funestus resistance to pyrethroid in western Kenya. Anopheles funestus mosquitoes were sampled using aspiration methods in Bungoma, Teso, Siaya, Port Victoria and Kombewa in western Kenya. The F1 progenies were exposed to deltamethrin (0.05%), permethrin (0.75%), DDT (4%) and pirimiphos-methyl (0.25%) following WHO test guidelines. A synergist assay using piperonyl butoxide (PBO) (4%) was conducted to determine cytochrome P450s' role in pyrethroid resistance. RNA-seq was conducted on a combined pool of specimens that were resistant and unexposed, and the results were compared with those of the FANG susceptible reference strain. This approach aimed to uncover the molecular mechanisms underlying the observed phenotypic pyrethroid resistance.
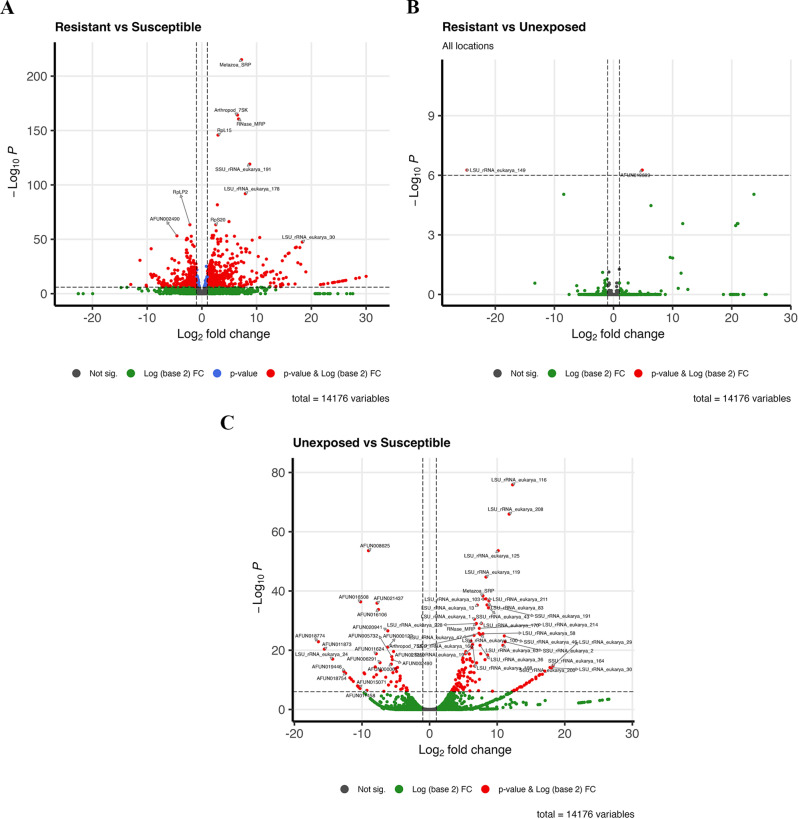
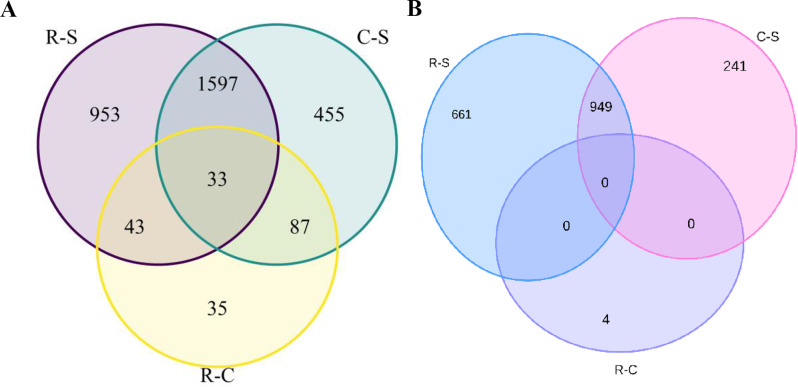
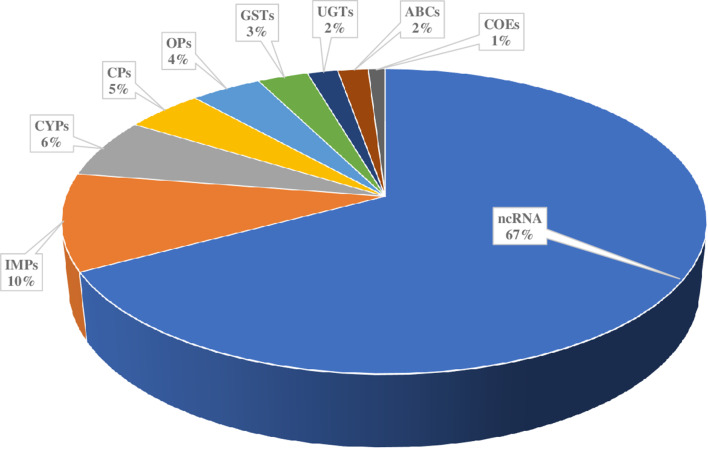
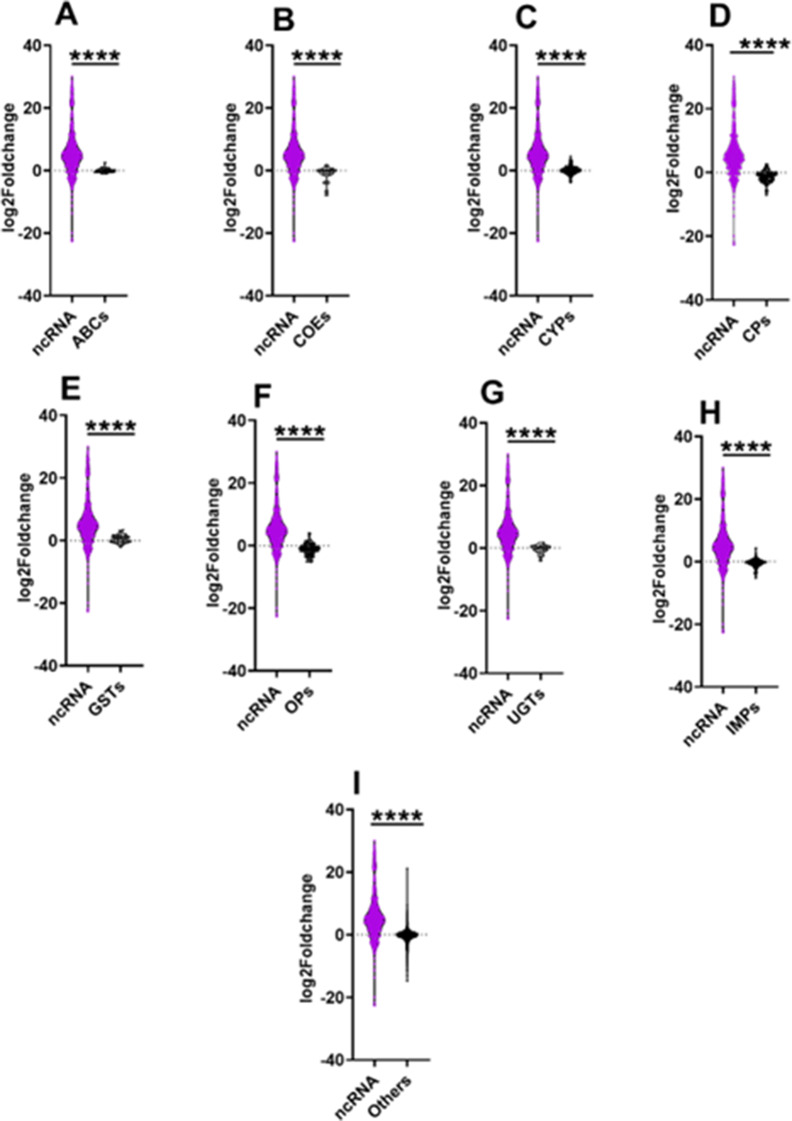
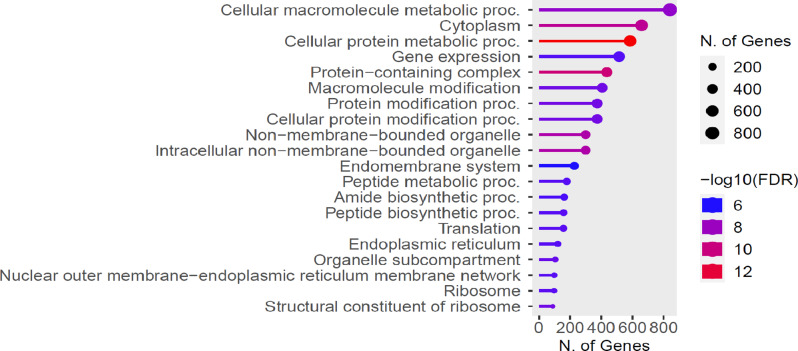
Results: Pyrethroid resistance was observed in all sites with an average mortality rate (MR) of 57.6%. Port Victoria had the highest level of pyrethroid resistance to permethrin (MR = 53%) and deltamethrin (MR = 11%. Teso had the lowest level of resistance to permethrin (MR = 70%) and deltamethrin (MR = 87%). Resistance to DDT was observed only in Kombewa (MR = 89%) and Port Victoria (MR = 85%). A full susceptibility to P-methyl (0.25%) was observed in all sites. PBO synergist assay revealed high susceptibility (> 98%) to pyrethroids in all the sites except for Port Victoria (MR = 96%). Whole transcriptomic analysis showed that most gene families associated with pyrethroid resistance comprised non-coding RNAs (67%), followed by immunity proteins (10%), cytochrome P450s (6%), cuticular proteins (5%), olfactory proteins (4%), glutathione S-transferases (3%), UDP-glycosyltransferases (2%), ATP-binding cassettes (2%) and carboxylesterases (1%).
Conclusion: This study unveils the molecular basis of insecticide resistance in An. funestus in western Kenya, highlighting for the first time the potential role of non-coding RNAs alongside metabolic detoxification in pyrethroid resistance. Targeting non-coding RNAs for intervention development could help in insecticide resistance management.
Keywords: Anopheles Funestus; Insecticide resistance; Non-coding RNAs; RNA-seq; Western Kenya.
© 2025. This is a U.S. Government work and not under copyright protection in the US; foreign copyright protection may apply.
Conflict of interest statement
Declarations. Ethics approval and consent: This study was approved by Maseno University’s Ethics Review Committee (MUERC/00778/19). Verbal consent was sought from owners of households before mosquitoes were collected inside the living rooms. Consent for publication: Not applicable. Competing interests: The authors declare no competing interests.
Figures
Update of
-
Non-Coding RNAs Potentially Involved in Pyrethroid Resistance of Anopheles funestus Population in Western Kenya.Res Sq [Preprint]. 2024 Feb 29:rs.3.rs-3979432. doi: 10.21203/rs.3.rs-3979432/v1. Res Sq. 2024. Update in: BMC Genomics. 2025 Jan 23;26(1):64. doi: 10.1186/s12864-025-11260-2. PMID: 38464038 Free PMC article. Updated. Preprint.
Similar articles
-
Non-Coding RNAs Potentially Involved in Pyrethroid Resistance of Anopheles funestus Population in Western Kenya.Res Sq [Preprint]. 2024 Feb 29:rs.3.rs-3979432. doi: 10.21203/rs.3.rs-3979432/v1. Res Sq. 2024. Update in: BMC Genomics. 2025 Jan 23;26(1):64. doi: 10.1186/s12864-025-11260-2. PMID: 38464038 Free PMC article. Updated. Preprint.
-
Evidence of microbiome contribution to the escalation of pyrethroid resistance in the major malaria vectors Anopheles gambiae s.s. and Anopheles funestus s.s.BMC Microbiol. 2025 Jul 2;25(1):384. doi: 10.1186/s12866-025-04114-0. BMC Microbiol. 2025. PMID: 40604391 Free PMC article.
-
Novel insecticide resistance mutations associated with variable PBO synergy in Anopheles gambiae s.l. from the Democratic Republic of Congo.Sci Rep. 2025 Jul 29;15(1):27618. doi: 10.1038/s41598-025-09016-9. Sci Rep. 2025. PMID: 40730828 Free PMC article.
-
Indoor residual spraying for preventing malaria in communities using insecticide-treated nets.Cochrane Database Syst Rev. 2022 Jan 17;1(1):CD012688. doi: 10.1002/14651858.CD012688.pub3. Cochrane Database Syst Rev. 2022. PMID: 35038163 Free PMC article.
-
Larvivorous fish for preventing malaria transmission.Cochrane Database Syst Rev. 2017 Dec 11;12(12):CD008090. doi: 10.1002/14651858.CD008090.pub3. Cochrane Database Syst Rev. 2017. PMID: 29226959 Free PMC article.
References
-
- Trape J-F, Tall A, Sokhna C, Ly AB, Diagne N, Ndiath O, et al. The rise and fall of malaria in a west African rural community, Dielmo, Senegal, from 1990 to 2012: a 22 year longitudinal study. Lancet Infect Dis. 2014;14:476–88. - PubMed
-
- O’Meara WP, Mangeni JN, Steketee R, Greenwood B. Changes in the burden of malaria in sub-saharan Africa. Lancet Infect Dis. 2010;10:545–55. - PubMed
MeSH terms
Substances
Grants and funding
LinkOut - more resources
Full Text Sources
Miscellaneous
