

Evolutionary constrained genes associated with autism spectrum disorder across 2,054 nonhuman primate genomes
- PMID: 39849619
- PMCID: PMC11755938
- DOI: 10.1186/s13229-024-00633-1
Evolutionary constrained genes associated with autism spectrum disorder across 2,054 nonhuman primate genomes
Abstract
Background: Significant progress has been made in elucidating the genetic underpinnings of Autism Spectrum Disorder (ASD). However, there are still significant gaps in our understanding of the link between genomics, neurobiology and clinical phenotype in scientific discovery. New models are therefore needed to address these gaps. Rhesus macaques (Macaca mulatta) have been extensively used for preclinical neurobiological research because of remarkable similarities to humans across biology and behaviour that cannot be captured by other experimental animals.
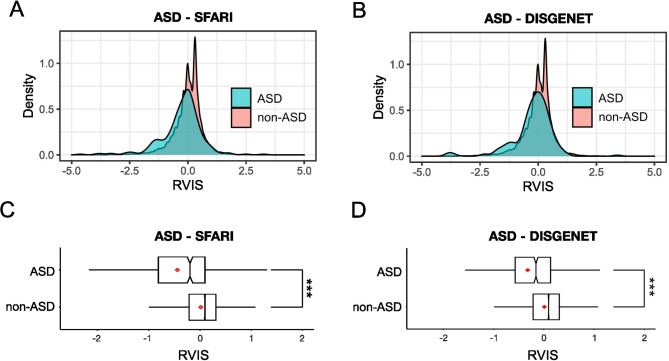
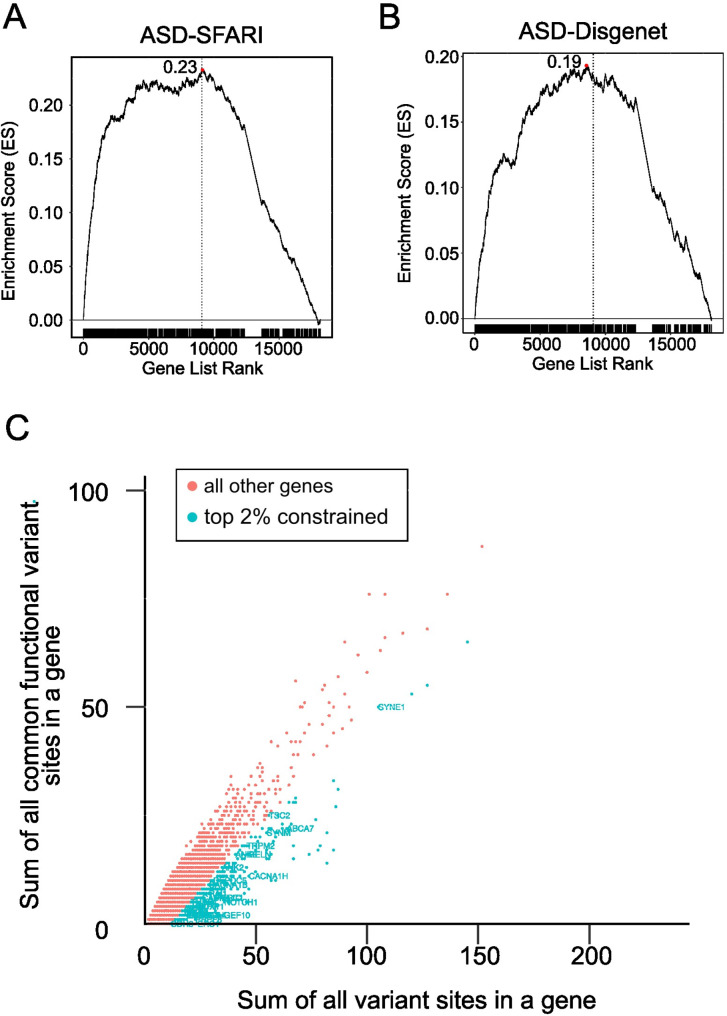
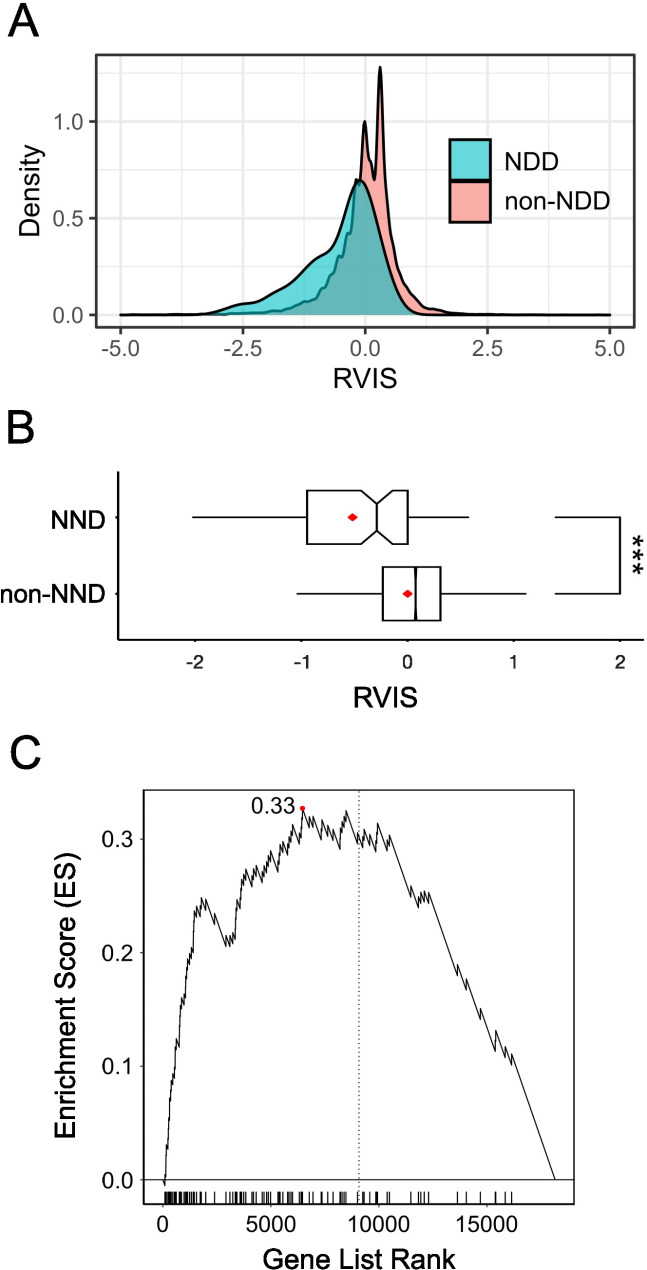
Methods: We used the macaque Genotype and Phenotype (mGAP) resource consisting of 2,054 macaque genomes to examine patterns of evolutionary constraint in known human neurodevelopmental genes. Residual variation intolerance scores (RVIS) were calculated for all annotated autosomal genes (N = 18,168) and Gene Set Enrichment Analysis (GSEA) was used to examine patterns of constraint across ASD genes and related neurodevelopmental genes.
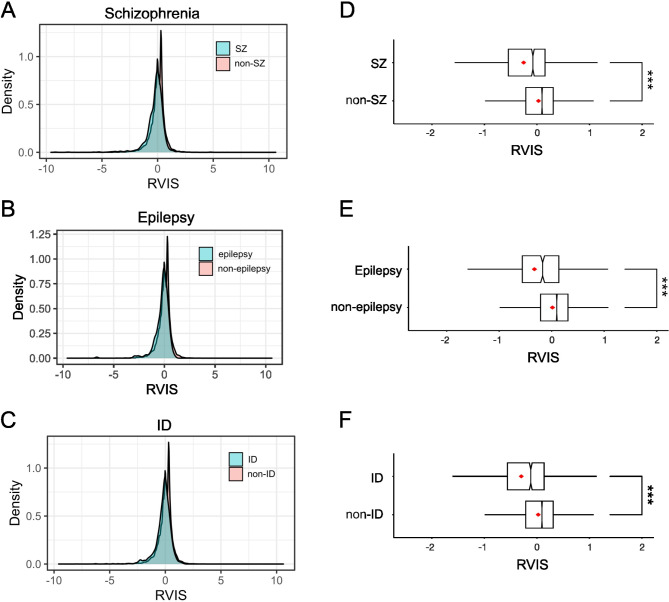
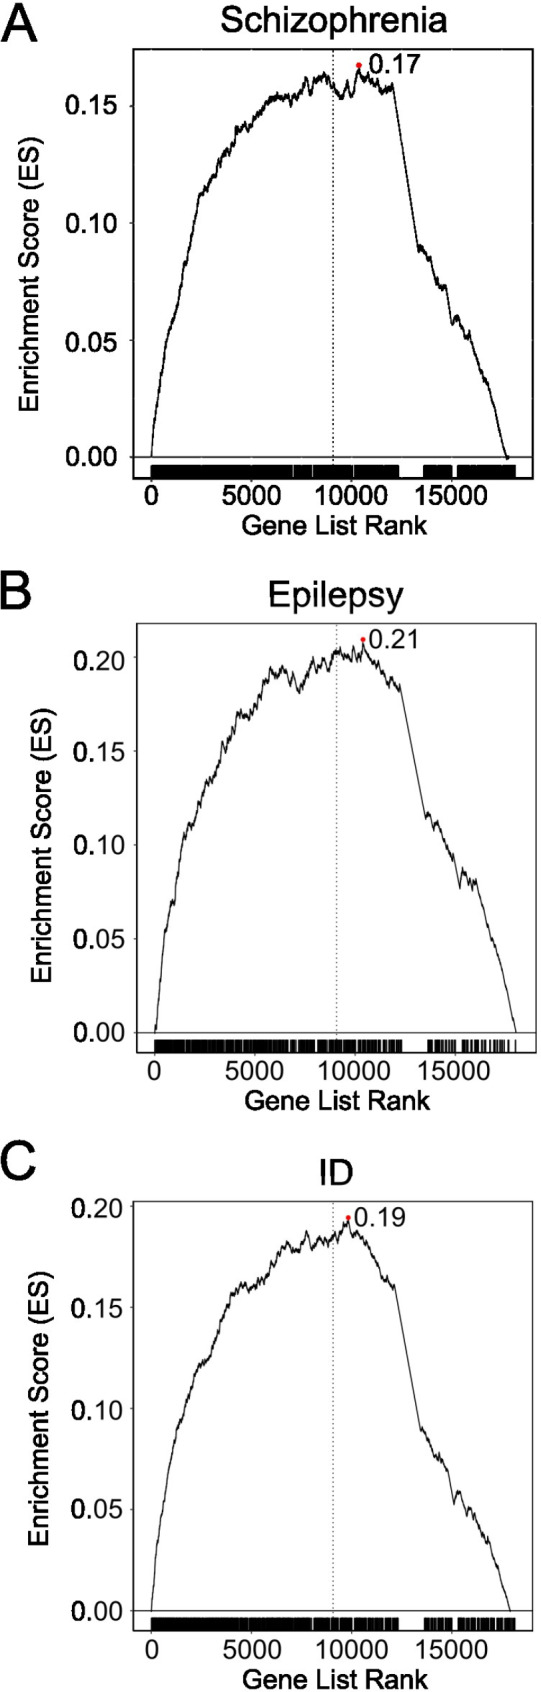
Results: We demonstrated that patterns of constraint across autosomal genes are correlated in humans and macaques, and that ASD-associated genes exhibit significant constraint in macaques (p = 9.4 × 10- 27). Among macaques, many key ASD-implicated genes were observed to harbour predicted damaging mutations. A small number of key ASD-implicated genes that are highly intolerant to mutation in humans, however, showed no evidence of similar intolerance in macaques (CACNA1D, MBD5, AUTS2 and NRXN1). Constraint was also observed across genes associated with intellectual disability (p = 1.1 × 10- 46), epilepsy (p = 2.1 × 10- 33) and schizophrenia (p = 4.2 × 10- 45), and for an overlapping neurodevelopmental gene set (p = 4.0 × 10- 10).
Limitations: The lack of behavioural phenotypes among the macaques whose genotypes were studied means that we are unable to further investigate whether genetic variants have similar phenotypic consequences among nonhuman primates.
Conclusion: The presence of pathological mutations in ASD genes among macaques, along with evidence of similar genetic constraints to those in humans, provides a strong rationale for further investigation of genotype-phenotype relationships in macaques. This highlights the importance of developing primate models of ASD to elucidate the neurobiological underpinnings and advance approaches for precision medicine and therapeutic interventions.
Keywords: Autism spectrum disorder; GSEA; Genetic constraint; Primate model; Whole genome sequencing.
© 2024. The Author(s).
Conflict of interest statement
Declarations. Ethics approval and consent to participate: All data collection for mGAP database protocols adhered to the NIH and the Guide for Use and Care of Laboratory Animals and were approved by the Oregon Health & Sciences University Animal Utilization and Care Committee [22]. Consent for publication: Not applicable. Competing interests: The authors declare no competing interests.
Figures
Similar articles
-
Heritability of social behavioral phenotypes and preliminary associations with autism spectrum disorder risk genes in rhesus macaques: A whole exome sequencing study.Autism Res. 2022 Mar;15(3):447-463. doi: 10.1002/aur.2675. Epub 2022 Jan 29. Autism Res. 2022. PMID: 35092647 Free PMC article.
-
mGAP: the macaque genotype and phenotype resource, a framework for accessing and interpreting macaque variant data, and identifying new models of human disease.BMC Genomics. 2019 Mar 6;20(1):176. doi: 10.1186/s12864-019-5559-7. BMC Genomics. 2019. PMID: 30841849 Free PMC article.
-
The population genomics of rhesus macaques (Macaca mulatta) based on whole-genome sequences.Genome Res. 2016 Dec;26(12):1651-1662. doi: 10.1101/gr.204255.116. Epub 2016 Oct 17. Genome Res. 2016. PMID: 27934697 Free PMC article.
-
Genetic architecture of autism spectrum disorder: Lessons from large-scale genomic studies.Neurosci Biobehav Rev. 2021 Sep;128:244-257. doi: 10.1016/j.neubiorev.2021.06.028. Epub 2021 Jun 21. Neurosci Biobehav Rev. 2021. PMID: 34166716 Review.
-
Advances in nonhuman primate models of autism: Integrating neuroscience and behavior.Exp Neurol. 2018 Jan;299(Pt A):252-265. doi: 10.1016/j.expneurol.2017.07.021. Epub 2017 Aug 1. Exp Neurol. 2018. PMID: 28774750 Free PMC article. Review.
Cited by
-
The Evolving Landscape of Functional Models of Autism Spectrum Disorder.Cells. 2025 Jun 16;14(12):908. doi: 10.3390/cells14120908. Cells. 2025. PMID: 40558535 Free PMC article. Review.
References
-
- Gibbs RA, Rogers J, Katze MG, Bumgarner R, Weinstock GM, Mardis ER, et al. Evolutionary and Biomedical Insights from the Rhesus Macaque Genome. Science. 2007;316(5822):222–34. - PubMed
MeSH terms
Grants and funding
LinkOut - more resources
Full Text Sources
Medical
