

Global, regional, and national burden of heart failure and its underlying causes, 1990-2021: results from the global burden of disease study 2021
- PMID: 39849627
- PMCID: PMC11755835
- DOI: 10.1186/s40364-025-00728-8
Global, regional, and national burden of heart failure and its underlying causes, 1990-2021: results from the global burden of disease study 2021
Abstract
Background: Heart failure (HF) remains a significant public health challenge globally. This study aims to systematically analyze the global HF disease burden from 1990 to 2021 across temporal, spatial, and demographic dimensions to provide evidence for targeted prevention and control strategies.
Methods: Using data from the Global Burden of Disease (GBD) 2021 study, we analyzed the global HF burden through prevalent cases, years lived with disability (YLDs), and age-standardized rates per 100,000 population. Temporal trends were evaluated using estimated annual percentage change (EAPC) and joinpoint regression analysis. The relationship between the Socio-demographic Index (SDI) and disease burden was explored through Pearson correlation analysis, while attribution analysis identified the main causes of HF. When appropriate, analyses were stratified by 5 SDI regions, 21 GBD regions, 204 countries and territories, 20 age groups, and both sexes.
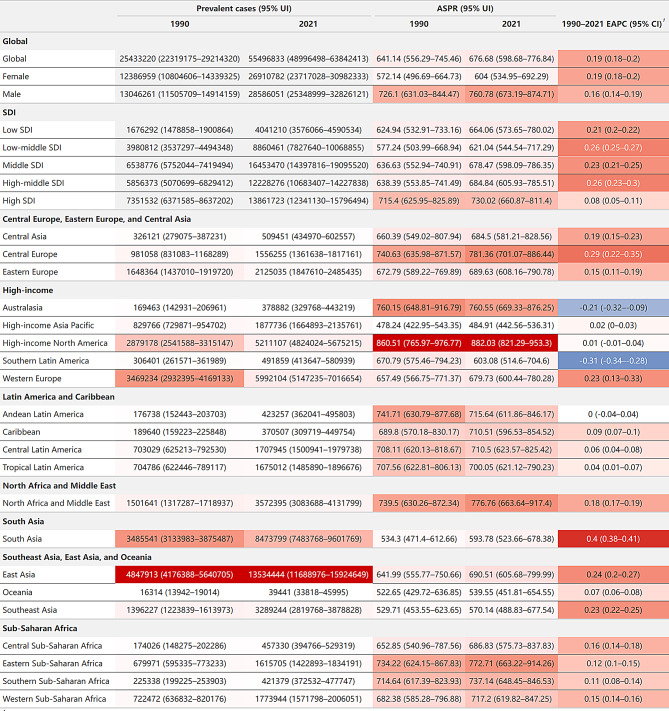
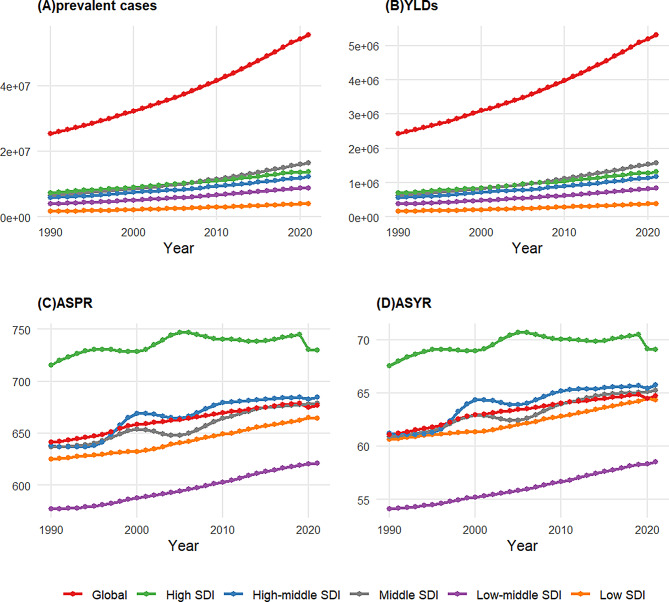
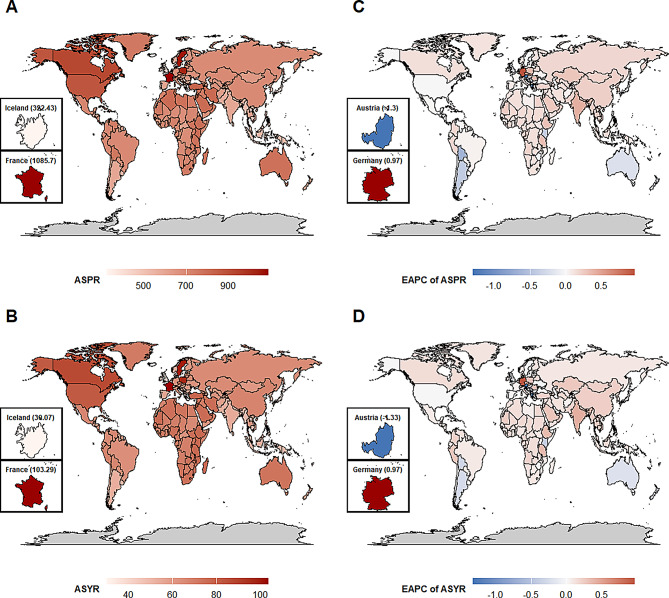
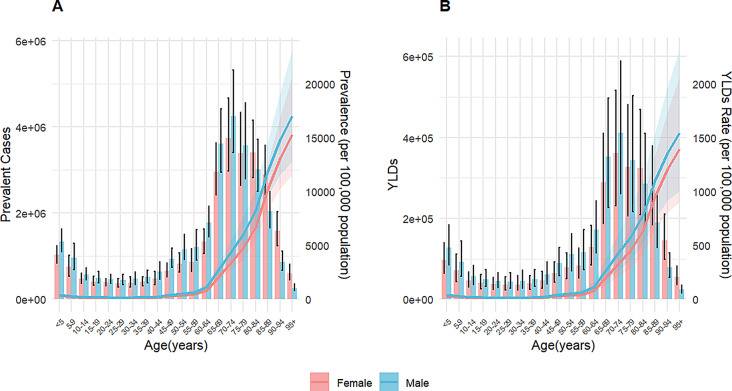
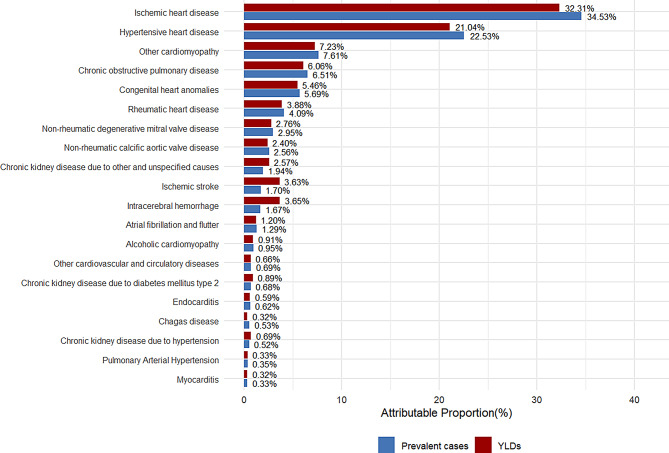
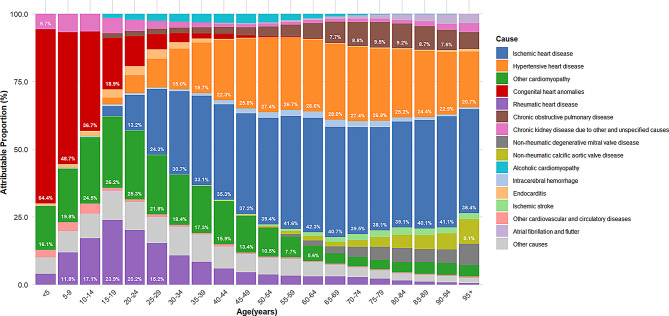
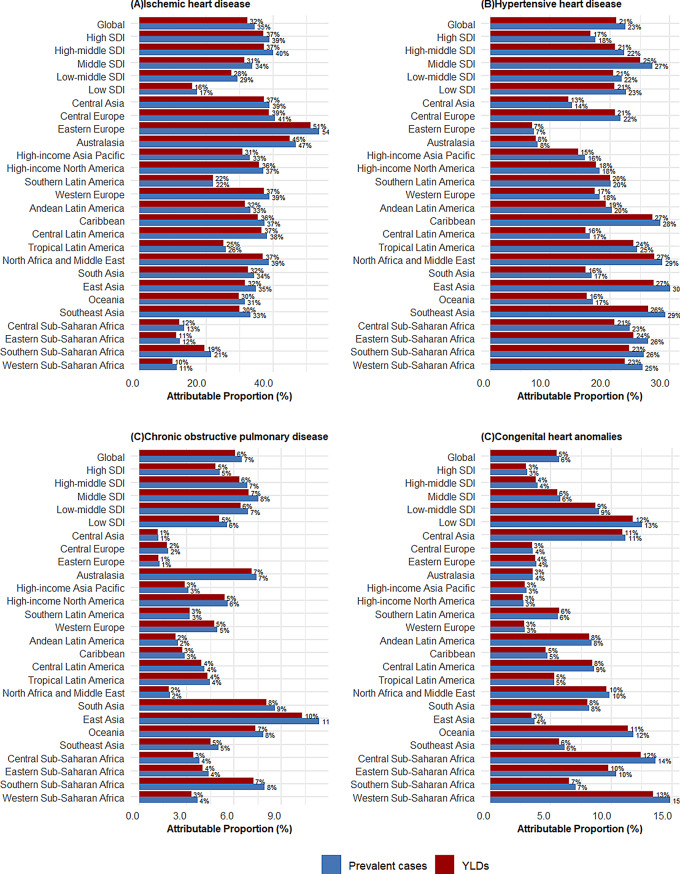
Results: Global HF prevalence and YLDs burden showed substantial increases from 1990 to 2021, with age-standardized prevalence increasing from 641.14 to 676.68 per 100,000 population. Notably, high-SDI regions exhibited a declining burden since 2019, indicating a potential global turning point. High-income North America bears the heaviest burden while South Asia shows the fastest growth rate. The correlation between disease burden and SDI level was negligible. The disease burden in males consistently exceeded that in females, with prevalence and YLDs rates rising sharply after age 60. The main causes and their attributable proportions were: ischemic heart disease (34.53%), hypertensive heart disease (22.53%), other cardiomyopathies (7.61%), chronic obstructive pulmonary disease (6.51%), and congenital heart anomalies (5.69%), with their distribution patterns differing across age groups and regions.
Conclusion: Global burden of HF increased significantly over recent decades, with a potential turning point in 2019 and marked regional disparities. It is essential to prioritize regions with heavy burdens or rapid growth rates, strengthen the management of major causes, and monitor HF burden trends in the post-COVID era.
Keywords: Epidemiology; Global burden of disease; Heart failure; Prevalence; Socio-demographic Index; Years lived with disability.
© 2025. The Author(s).
Conflict of interest statement
Declarations. Ethics approval and consent to participate: For GBD studies, the Institutional Review Board of the University of Washington reviewed and approved a waiver of informed consent. Consent for publication: Not applicable. Competing interests: The authors declare no competing interests.
Figures

References
-
- Bozkurt B, Coats AJ, Tsutsui H, Abdelhamid M, Adamopoulos S, Albert N, et al. Universal Definition and classification of Heart failure: a report of the Heart Failure Society of America, Heart Failure Association of the European Society of Cardiology, Japanese Heart Failure Society and Writing Committee of the Universal Definition of Heart failure. J Card Fail. 2021;27:387–413.
-
- Solomon SD, McMurray JJV, Claggett B, De Boer RA, DeMets D, Hernandez AF, et al. Dapagliflozin in Heart failure with mildly reduced or preserved ejection fraction. N Engl J Med. 2022;387:1089–98. - PubMed
-
- Anker SD, Butler J, Filippatos G, Ferreira JP, Bocchi E, Böhm M, et al. Empagliflozin in Heart failure with a preserved ejection fraction. N Engl J Med. 2021;385:1451–61. - PubMed
-
- Armstrong PW, Pieske B, Anstrom KJ, Ezekowitz J, Hernandez AF, Butler J, et al. Vericiguat in patients with heart failure and reduced ejection fraction. N Engl J Med. 2020;382:1883–93. - PubMed
-
- Solomon SD, Vaduganathan M, Claggett L, Packer B, Zile M, Swedberg M. Sacubitril/Valsartan across the Spectrum of Ejection Fraction in Heart failure. Circulation. 2020;141:352–61. - PubMed
Grants and funding
LinkOut - more resources
Full Text Sources
Research Materials
Miscellaneous
