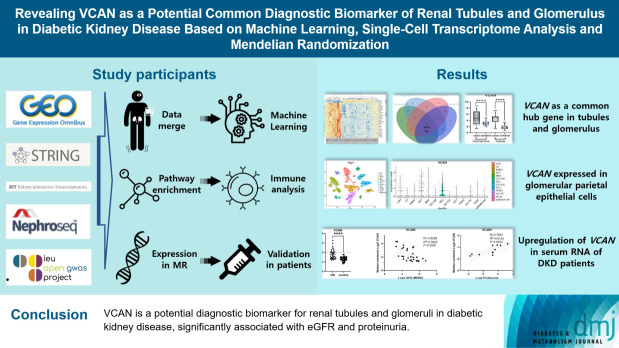
Revealing VCAN as a Potential Common Diagnostic Biomarker of Renal Tubules and Glomerulus in Diabetic Kidney Disease Based on Machine Learning, Single-Cell Transcriptome Analysis and Mendelian Randomization
- PMID: 39849979
- PMCID: PMC12086553
- DOI: 10.4093/dmj.2024.0233
Revealing VCAN as a Potential Common Diagnostic Biomarker of Renal Tubules and Glomerulus in Diabetic Kidney Disease Based on Machine Learning, Single-Cell Transcriptome Analysis and Mendelian Randomization
Abstract
Backgruound: Diabetic kidney disease (DKD) is recognized as a significant complication of diabetes mellitus and categorized into glomerular DKDs and tubular DKDs, each governed by distinct pathological mechanisms and biomarkers.
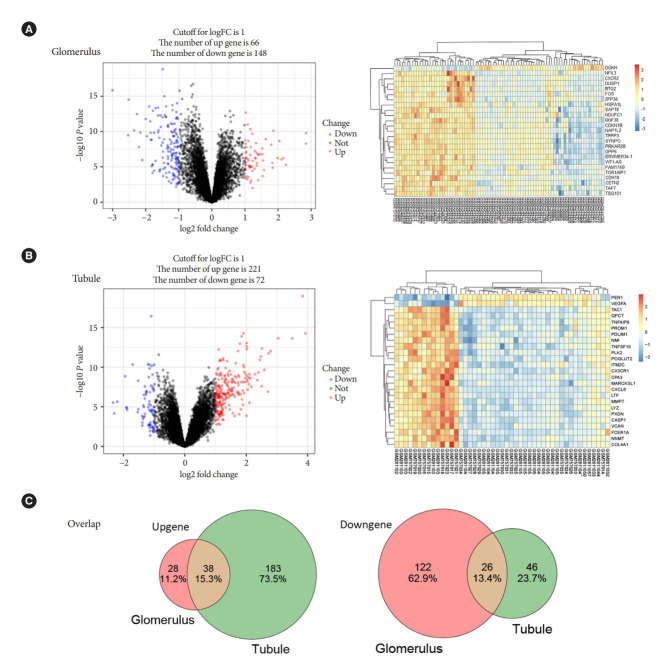
Methods: Through the identification of common features observed in glomerular and tubular lesions in DKD, numerous differentially expressed gene were identified by the machine learning, single-cell transcriptome and mendelian randomization.
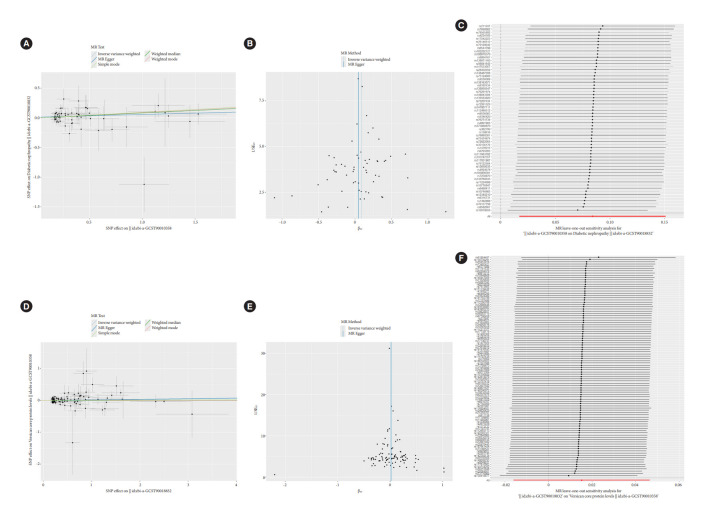
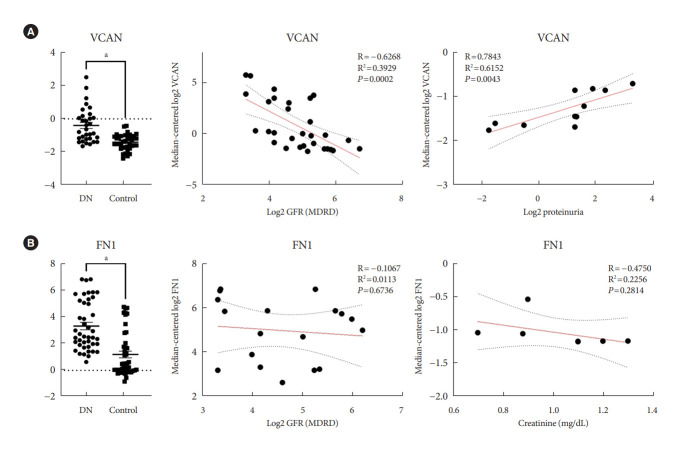
Results: The diagnostic markers versican (VCAN) was identified, offering supplementary options for clinical diagnosis. VCAN significantly highly expressed in glomerular parietal epithelial cell and proximal convoluted tubular cell. It was mainly involved in the up-regulation of immune genes and infiltration of immune cells like mast cell. Mendelian randomization analysis confirmed that serum VCAN protein levels were a risky factor for DKD, while there was no reverse association. It exhibited the good diagnostic potential for estimated glomerular filtration rate and proteinuria in DKD.
Conclusion: VCAN showed the prospects into DKD pathology and clinical indicator.
Keywords: Diabetic nephropathies; Kidney glomerulus; Kidney tubules; Machine learning; Mendelian randomization analysis; Single-cell gene expression analysis; VCAN protein, human.
Conflict of interest statement
No potential conflict of interest relevant to this article was reported.
Figures


References
MeSH terms
Substances
Grants and funding
LinkOut - more resources
Full Text Sources
Medical