. 2025 Jan 24;9(2):vlae007.
doi: 10.1093/immhor/vlae007.

Combination adjuvant improves influenza virus immunity by downregulation of immune homeostasis genes in lymphocytes

Affiliations

Combination adjuvant improves influenza virus immunity by downregulation of immune homeostasis genes in lymphocytes

Emmanuel Dollinger et al. Immunohorizons. .

Abstract

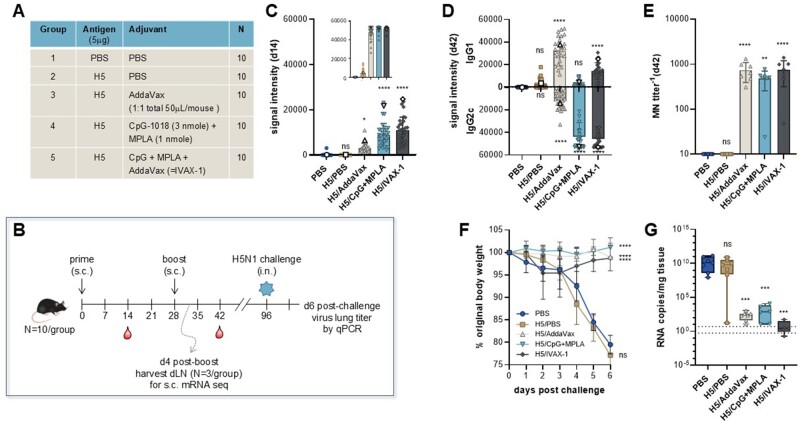
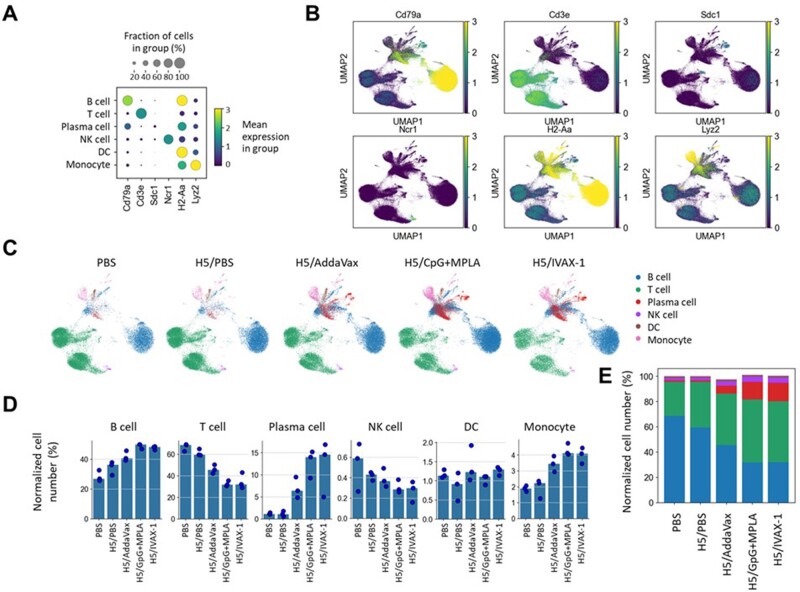
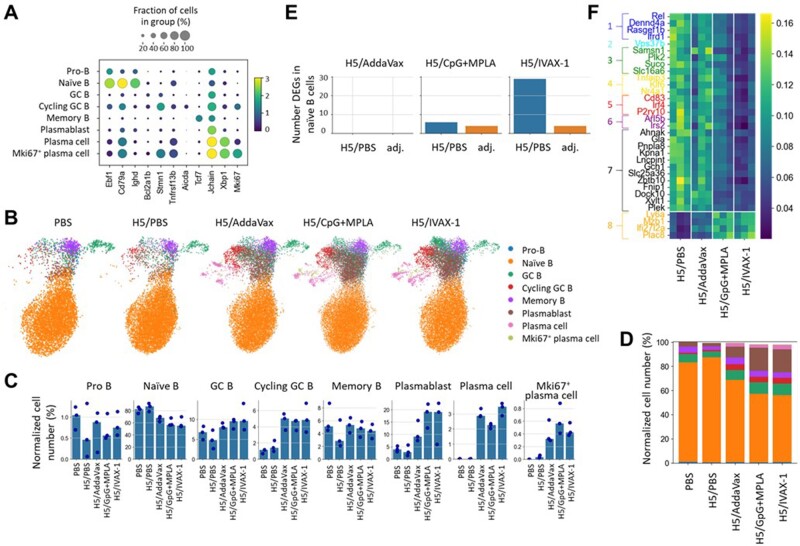
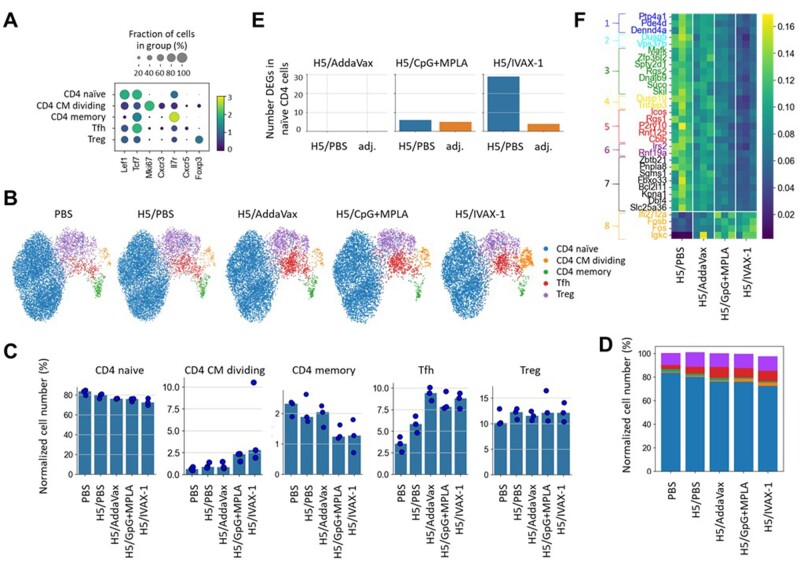
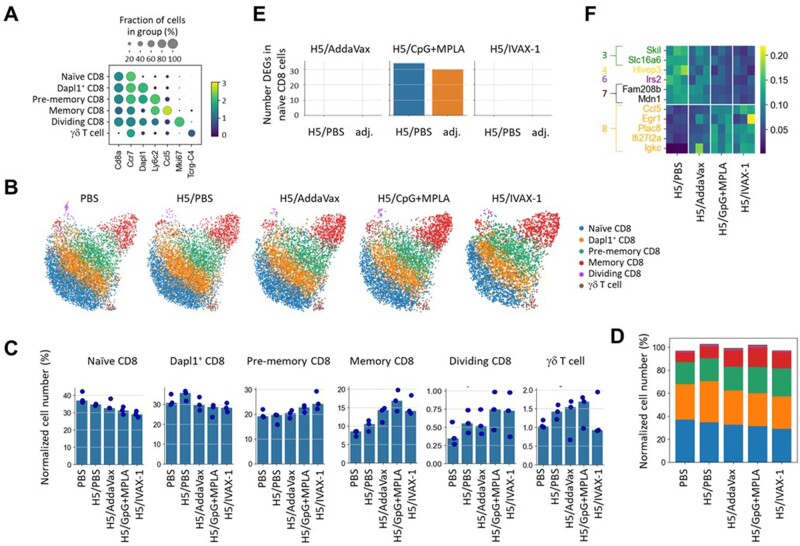
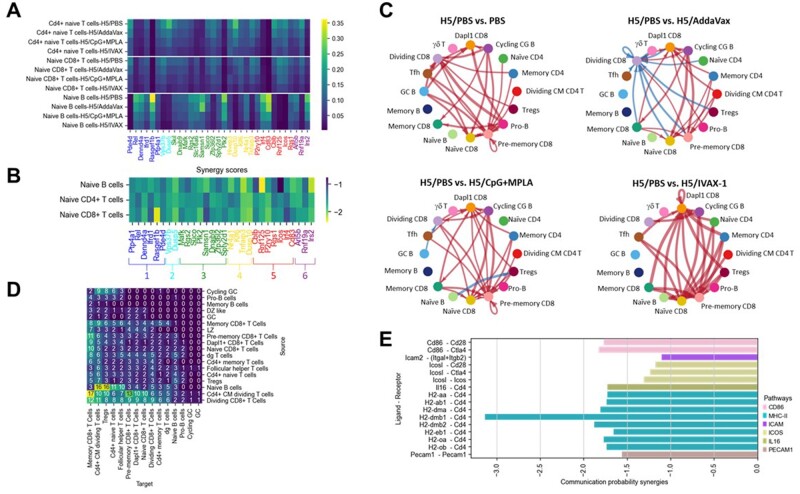
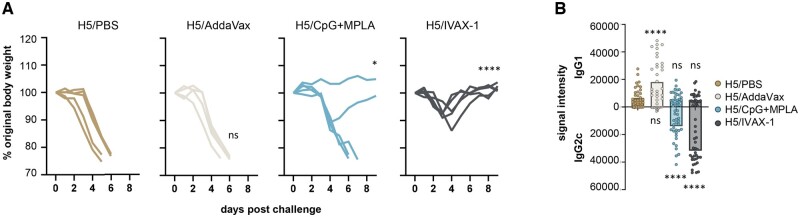
Adjuvants play a central role in enhancing the immunogenicity of otherwise poorly immunogenic vaccine antigens. Combining adjuvants has the potential to enhance vaccine immunogenicity compared with single adjuvants, although the cellular and molecular mechanisms of combination adjuvants are not well understood. Using the influenza virus hemagglutinin H5 antigen, we define the immunological landscape of combining CpG and MPLA (TLR-9 and TLR-4 agonists, respectively) with a squalene nanoemulsion (AddaVax) using immunologic and transcriptomic profiling. Mice immunized and boosted with recombinant H5 in AddaVax, CpG+MPLA, or AddaVax plus CpG+MPLA (IVAX-1) produced comparable levels of neutralizing antibodies and were equally well protected against the H5N1 challenge. However, after challenge with H5N1 virus, H5/IVAX-1-immunized mice had 100- to 300-fold lower virus lung titers than mice receiving H5 in AddaVax or CpG+MPLA separately. Consistent with enhanced viral clearance, unsupervised expression analysis of draining lymph node cells revealed the combination adjuvant IVAX-1 significantly downregulated immune homeostasis genes, and induced higher numbers of antibody-producing plasmablasts than either AddaVax or CpG+MPLA. IVAX-1 was also more effective after single-dose administration than either AddaVax or CpG+MPLA. These data reveal a novel molecular framework for understanding the mechanisms of combination adjuvants, such as IVAX-1, and highlight their potential for the development of more effective vaccines against respiratory viruses.

Keywords: combination adjuvant; influenza; lymphocytes; single-cell transcriptomics; synergy.


Conflict of interest statement

None declared.

Figures

Figure 1.
Figure 1.
Adjuvant screen in mice. (A) Groups of 10 C57BL/6 female mice were administered H5 (VN04) formulated in IVAX-1 or AddaVax or CpG+MPLA separately, as shown. (B) Timeline; mice received vaccine on d0 and d28 via the subcutaneous route; blood was collected on d14 and d42 for serological analysis. Three mice were withdrawn from each group 4 d postboost for subcutaneous mRNA sequencing analysis of draining lymph nodes (Figs. 3–7) and the remaining 7 mice were challenged on d96 with 50 μL 104 TCID50 /ml of H5N1 virus matched to the H5 in the vaccine. (C) Magnitude of IgG responses on d14 (preboost) to different H5 drift variants as determined by protein microarray in which each spot is a different H5 drift variant; inset, magnitude of response on d42 (2 weeks postboost); open symbols are the immunizing antigen. (D) IgG1/IgG2c (Th2/Th1) profiles on d42 determined by protein microarray, in which each spot is a different H5 drift variant; open symbols are the immunizing antigen. (E) Microneutralization titers on d42. (F) Normalized body weights (mean ± SD) postchallenge; animals were sacrificed 6 d postchallenge and lungs harvested for virus titers. (G) Lung titers by qPCR. Limit of detection is 10 copies RNA per PCR reaction, which ranges from 0.55 to 5 copies/mg/lung (hashed lines). Significance was calculated using 1-way analysis of variance between the PBS group and each of the other groups using Dunnett’s multiple comparisons test. **P ≤ 0.01; ***P ≤ 0.001; ****P < 0.0001. i.n., intranasal; ns, nonsignificant, s.c., subcutaneous, s.c. mRNA seq, single-cell messenger RNA sequencing.
Figure 2.
Figure 2.
Major immune cell types identified by transcriptomic profiling. (A) Bubble plot showing markers used to identify main immune cell subsets, with expression level and proportion of each marker in each cell subset represented by shade and size of the bubble, respectively. (B) UMAP plots showing major cell subsets and vaccine groups pooled. (C) Location of cell subsets in UMAPs broken out by vaccine group. (D) Bar charts of normalized cell numbers (% of total number of lymph node cells) by vaccine group; each spot represents an individual mouse. (E) Stacked plots of normalized cell counts as shown in panel (C), median of 3 mice.
Figure 3.
Figure 3.
Analysis of B cells. (A) Bubble plot showing markers used to define B cell subsets, with shading and size of bubble representing mean expression in each group, and the proportion of each marker expressed in each B cell subset, respectively. (B) UMAPs of B cell subsets according to vaccine group. (C) Bar charts of normalized cell counts (expressed as % of total B cells) of each subset associated with each vaccine group; each dot represents an individual mouse. (D) Stacked plots of normalized cell counts shown in panel B, median of 3 mice. (E) Number of DEGs meeting cutoffs (Benjamini-Hochberg–corrected P values <0.2, log2 fold change >1) with log fold change higher in H5/PBS or adjuvanted formulations. Only naïve B cells in H5/CpG+MPLA and H5/IVAX had DEGs meeting the cutoff. See the main text for statistical test details. (F) Heatmap of the expression of the top DEGs in naïve B cells in IVAX/H5 vs PBS/H5. Downregulated gene groups correspond to genes related to NF-κB signaling (1), tumor suppressor (3), immune suppression (5), or combinations thereof (NF-κB and tumor suppressor (2), tumor suppressor and immune suppression (4), NF-κB and immune suppression (6), other down-regulated DEGs (black). Upregulated genes are group 8.
Figure 4.
Figure 4.
Analysis of CD4 T cells. (A) Bubble plot showing markers used to define CD4 T cell subsets, with shading and size of bubble representing mean gene expression in group and proportion of each marker expressed in each T cell subset, respectively. (B) UMAPs of CD4 T cell subsets according to vaccine group. (C) Bar charts of normalized cell counts (expressed as % of total CD4 cells) of each subset associated with each vaccine group; each spot represents an individual mouse. (D) Stacked plot of normalized cell counts as shown in panel B; median of 3 mice. (E) Number of DEGs meeting cutoffs (Benjamini-Hochberg–corrected P values <0.2, log2 fold change >1) with log fold change higher in H5/PBS or adjuvanted (adj.) formulations. Only the naïve CD4+ T cell population had DEGs meeting cutoff in CpG+MPLA and in IVAX compared with H5/PBS. (F) Heatmap of the expression of DEGs in naïve CD4 T cells in H5/IVAX compared with H5/PBS. Gene groups annotated as per Fig. 3.
Figure 5.
Figure 5.
Analysis of CD8 T cells. (A) Bubble plot showing markers used to define CD8 T cell subsets, with shading and size of bubble representing gene expression level and proportion of each marker expressed in each T cell subset, respectively. (B) UMAPs of CD8 T cell subsets according to vaccine group. (C) Bar charts of normalized cell counts (expressed as % of total CD8 cells) of each subset associated with each vaccine group; each dot represents an individual mouse. (D) Stacked plot of normalized cell counts as shown in panel B, median of 3 mice. (E) Number of DEGs meeting cutoffs (Benjamini-Hochberg–corrected P values <0.2, log2 fold change >1) with log fold change higher in H5/PBS or adjuvanted formulations. Only the naïve, memory, prememory, and Dapl1+ CD8 T cell populations had DEGs meeting cutoff in H5/CpG+MPLA compared with H5/PBS; (F) Heatmap of the expression of the DEGs in naïve CD8 T cells in H5/CpG+MPLA versus H5/PBS.Gene groups annotated as per Fig. 3.
Figure 6.
Figure 6.
IVAX induces synergistic downregulation of both immune homeostasis genes and immune suppressive signaling. (A) Psuedobulked expression of naïve CD4 and CD8 T cells, and naïve B cells of immune homeostasis genes (see main text). (B) Synergy scores for immune homeostasis genes (logged quotient of IVAX-1 expression to the sum of CpG+MPLA and AddaVax expression separately, in which a score of <−1 implies synergistic effect; see main text for details); gene groups annotated as per Fig. 3. (C) Cumulative strength of T and B cell signaling in the H5/PBS group versus other groups; the width of edges indicates the strength of signaling. (D) The number of synergistic signaling pathways in each source/target pair of different cell types. (E) The synergistic signaling pathways along with signaling synergy score (calculated the same as synergy score, see the main text) from naïve B cells to Treg cells.
Figure 7.
Figure 7.
IVAX-1 shows efficacy from a single dose. Groups of 5 C57BL/6 female mice were administered 5 µg H5 (VN04) formulated in PBS, AddaVax, CpG+MPLA, or IVAX-1 on d0 via the subcutaneous route and challenged on d28 with 50 μL 104 TCID50 /ml of H5N1 virus. (A) normalized body weights postchallenge; each line represents an individual mouse. (B) IgG1/IgG2c (Th2/Th1) profiles on d23 determined by protein microarray, in which each spot is a different H5 drift variant. Two-way analysis of variance between H5/PBS and other groups; Dunnett’s multiple comparisons test. *P < 0.05; ****P < 0.0001. ns, nonsignificant.

Similar articles

References

    1. Singleton KL, Joffe A, Leitner WW. Review: current trends, challenges, and success stories in adjuvant research. Front Immunol. 2023;14:1105655. - PMC - PubMed
    1. Firdaus FZ, Skwarczynski M, Toth I. Developments in vaccine adjuvants. Methods Mol Biol. 2022;2412:145–178. 10.1007/978-1-0716-1892-9_8. - DOI - PubMed
    1. Raponi A, Brewer JM, Garside P, Laera D. Nanoalum adjuvanted vaccines: small details make a big difference. Semin Immunol. 2021;56:101544. 10.1016/j.smim.2021.101544. - DOI - PubMed
    1. He P, Zou Y, Hu Z. Advances in aluminum hydroxide-based adjuvant research and its mechanism. Hum Vaccin Immunother. 2015;11:477–488. 10.1080/21645515.2014.1004026. - DOI - PMC - PubMed
    1. Del Giudice G, Rappuoli R, Didierlaurent AM. Correlates of adjuvanticity: a review on adjuvants in licensed vaccines. Semin Immunol. 2018;39:14–21. 10.1016/j.smim.2018.05.001. - DOI - PubMed

Publication types

MeSH terms