. 2025 Jan 2:46:386-405.
doi: 10.1016/j.bioactmat.2024.12.017. eCollection 2025 Apr.

bFGF-Chitosan "brain glue" promotes functional recovery after cortical ischemic stroke

Affiliations

bFGF-Chitosan "brain glue" promotes functional recovery after cortical ischemic stroke

Jiao Mu et al. Bioact Mater. .

Abstract

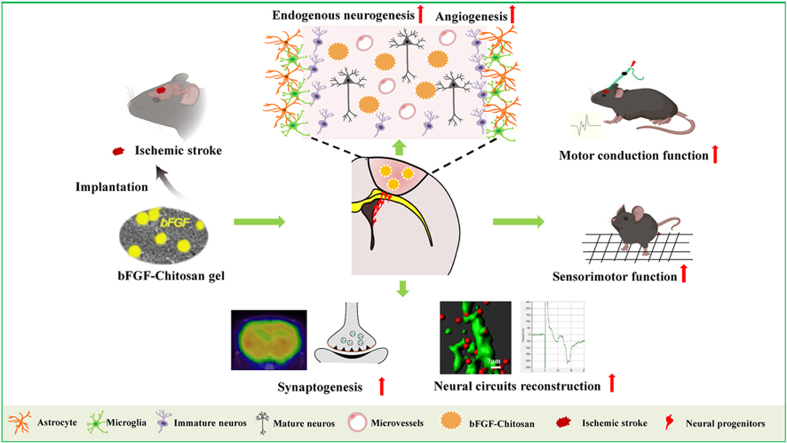
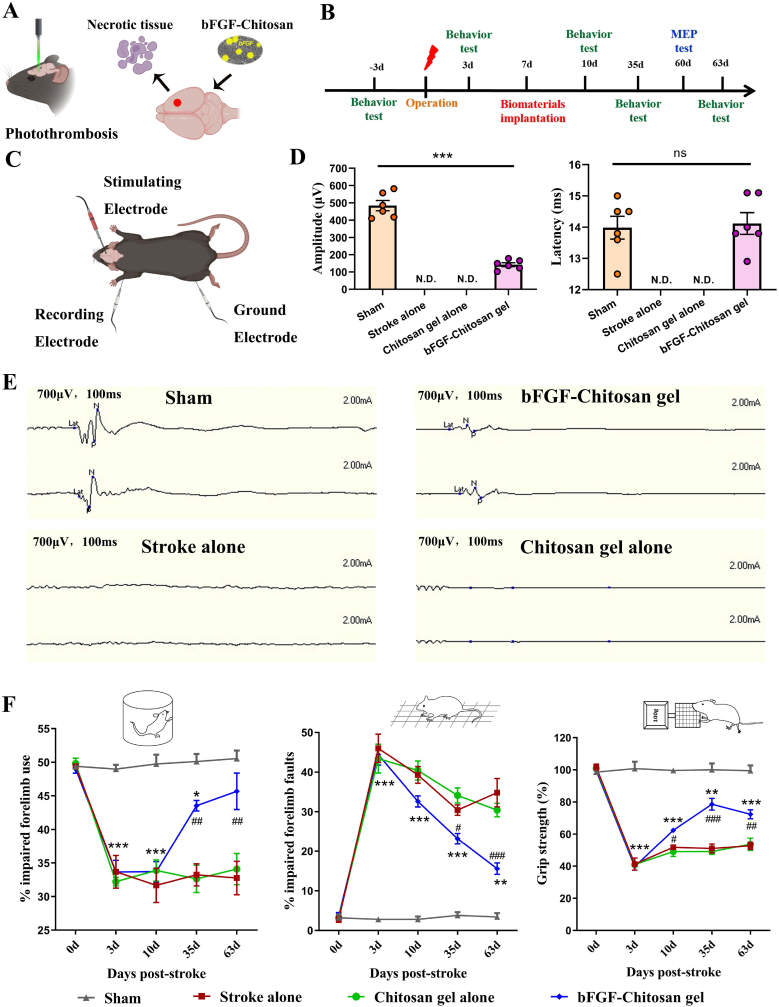
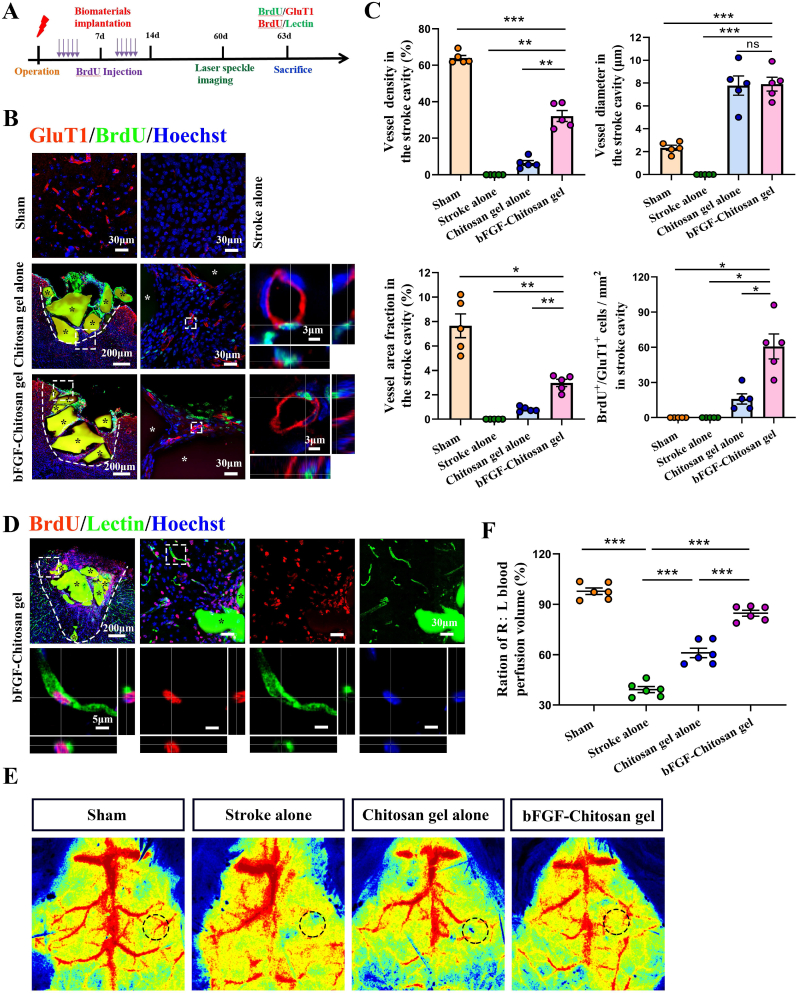
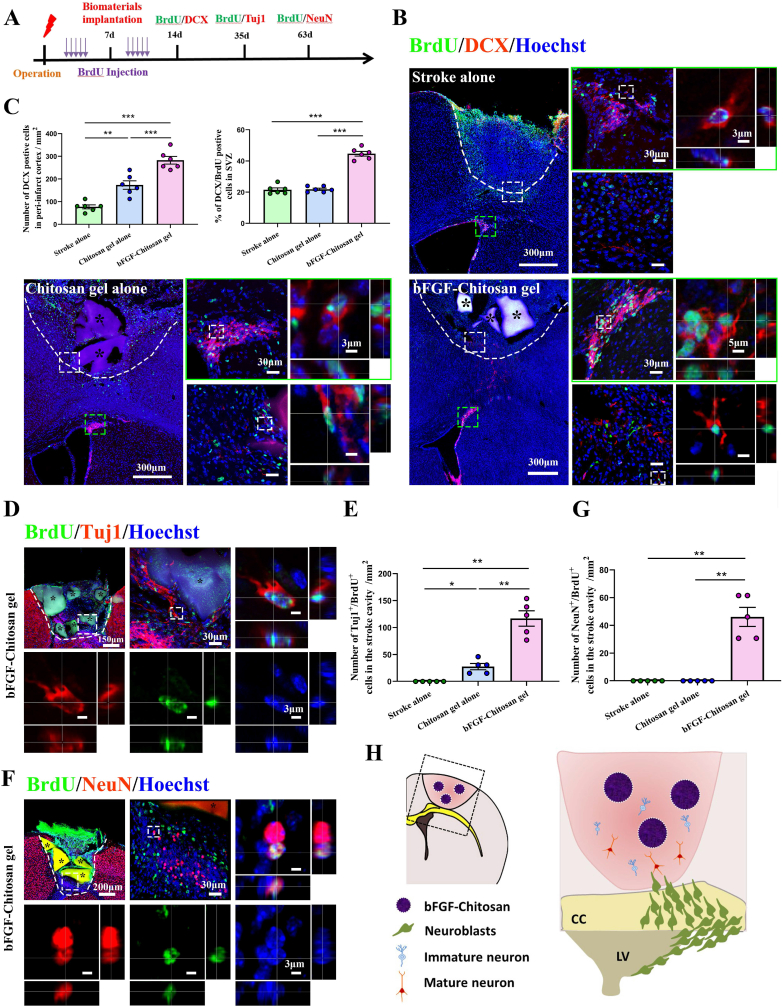
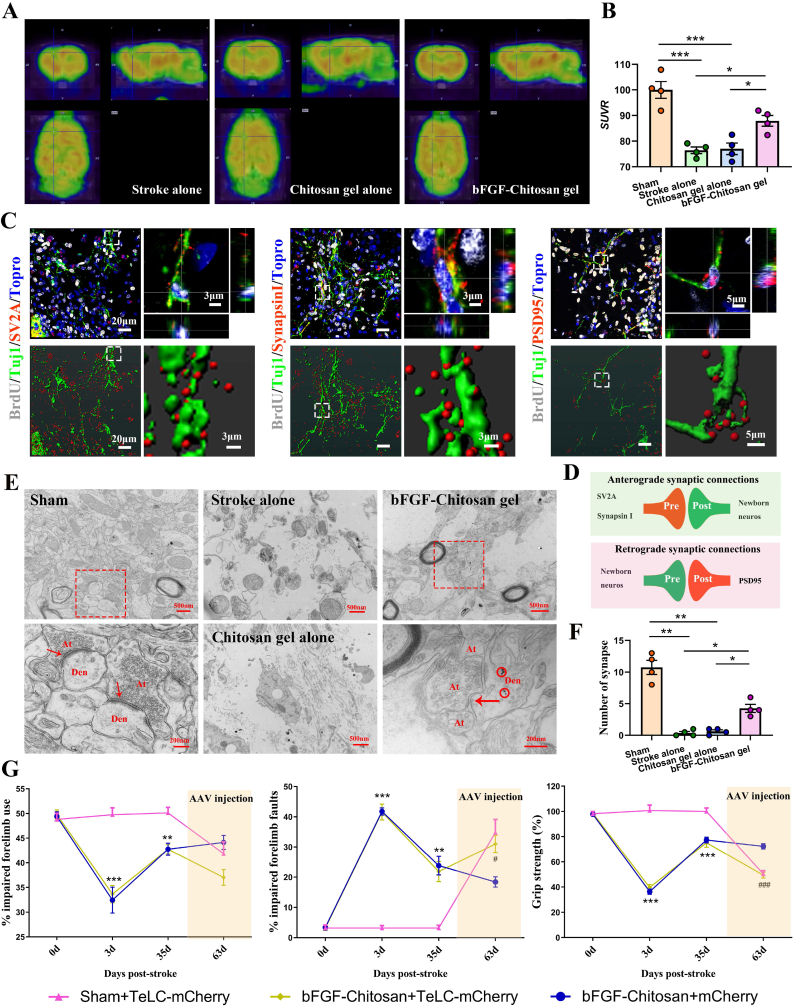
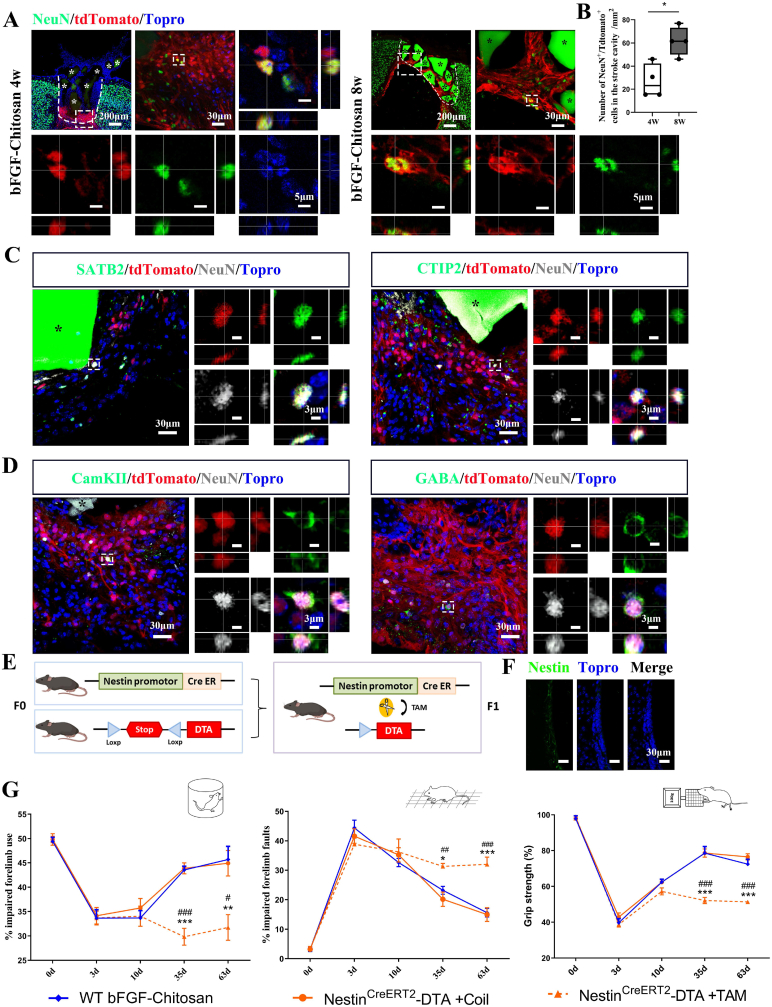
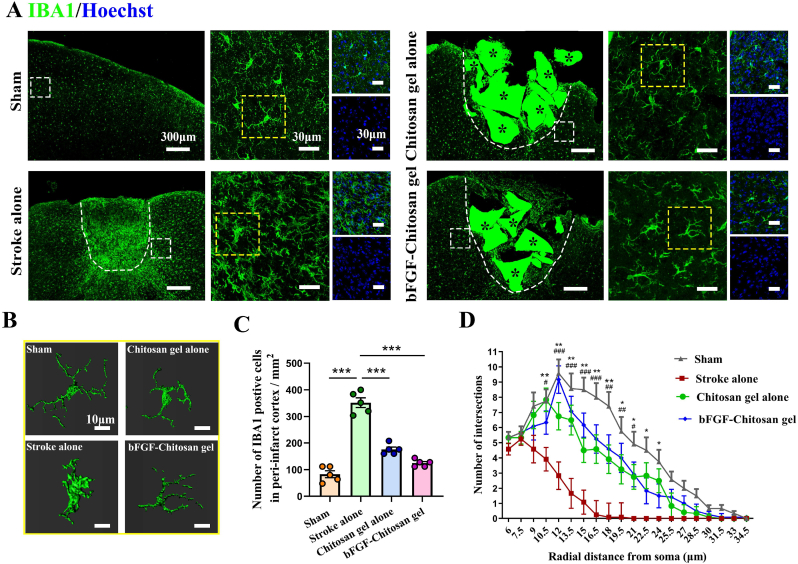
The mammalian brain has an extremely limited ability to regenerate lost neurons and to recover function following ischemic stroke. A biomaterial strategy of slowly-releasing various regeneration-promoting factors to activate endogenous neurogenesis represents a safe and practical neuronal replacement therapy. In this study, basic fibroblast growth factor (bFGF)-Chitosan gel is injected into the stroke cavity. This approach promotes the proliferation of vascular endothelial cell, the formation of functional vascular network, and the final restoration of cerebral blood flow. Additionally, bFGF-Chitosan gel activates neural progenitor cells (NPCs) in the subventricular zone (SVZ), promotes the NPCs' migration toward the stroke cavity and differentiation into mature neurons with diverse cell types (inhibitory gamma-aminobutyric acid neurons and excitatory glutamatergic neuron) and layer architecture (superficial cortex and deep cortex). These new-born neurons form functional synaptic connections with the host brain and reconstruct nascent neural networks. Furthermore, synaptogenesis in the stroke cavity and Nestin lineage cells respectively contribute to the improvement of sensorimotor function induced by bFGF-Chitosan gel after ischemic stroke. Lastly, bFGF-Chitosan gel inhibits microglia activation in the peri-infarct cortex. Our findings indicate that filling the stroke cavity with bFGF-Chitosan "brain glue" promotes angiogenesis, endogenous neurogenesis and synaptogenesis to restore function, offering innovative ideas and methods for the clinical treatment of ischemic stroke.

Keywords: Angiogenesis; Ischemic stroke; Neural circuit reconstruction; New-born neurons; Synaptogenesis; bFGF-Chitosan gel.


Conflict of interest statement

The authors affirm that they have no known financial or interpersonal conflicts that could have appeared to have an impact on the research presented in this study.

Figures

Image 1
bFGF-Chitosan “brain glue” promotes angiogenesis, endogenous neurogenesis and synaptogenesis to improve sensorimotor function recovery after cortical ischemic stroke in rodents.
Fig. 1
Fig. 1
bFGF-Chitosan gel promotes recovery of sensorimotor function after ischemic stroke. (A) Schematic diagram of the photothrombotic model and gel implantation. (B) Timeline of experimental procedure for functional test in C57BL/6J mice. MEP, Motor evoked potentials. (C) Schematic diagram of the MEP test. (D) Quantification of MEP amplitude and latency on day 60 post-stroke. ∗∗∗P < 0.001, ns, no significant difference, independent-samples T test, n = 6 in each group. (E) Representative MEP signal in each group. (F) bFGF-Chitosan gel promotes recovery of sensorimotor function. ∗P < 0.05, ∗∗P < 0.01, ∗∗∗P < 0.001, bFGF-Chitosan gel group compared with the sham group. #P < 0.05, ##P < 0.01, ###P < 0.001, bFGF-Chitosan gel group compared with the stroke alone group, two-way ANOVA, n = 5 in each group. Data are presented as mean ± SEM. Schematic diagram was created with BioRender.com.
Fig. 2
Fig. 2
bFGF-Chitosan gel enhances angiogenesis, revascularization and restoration of cerebral blood flow in and about stroke cavity. (A) Timeline of experimental procedure for angiogenesis examination. (B) Representative immunofluorescence images of new-born vascular endothelial cells in and around stroke cavity (GluT1/BrdU/Hoechst) on day 63 post-stroke. (C) Quantification of vessel area fraction, vessel density, vessel diameter and cell density of BrdU/GluT1 in stroke cavity on day 63 post-stroke. ∗P < 0.05, ∗∗P < 0.01, ∗∗∗P < 0.001, ns, no significant difference, one-way ANOVA and post-hoc Dunnett's T3 test, n = 5. (D) Representative immunofluorescence images of new-born functional vessel in the stroke cavity of bFGF-Chitosan gel mice (Lectin/BrdU/Hoechst) on day 63 post-stroke. (E) Representative blood flow maps on day 60 post-stroke. (F) Quantification of cerebral blood flow in and around the stroke cavity in each group on day 60 post-stroke. ∗∗∗P < 0.001 one-way ANOVA and post-hoc Bonferroni tests. n = 6 in each group. Data are presented as mean ± SEM.
Fig. 3
Fig. 3
bFGF-Chitosan gel facilitates production and long-term survival of new-born neurons in stroke cavity. (A) Timeline of experimental procedure for neurogenesis examination. (B) bFGF-Chitosan gel promotes ectopic migration of neuroblasts toward the peri-infarct cortical region (white box) and increases neuroblast production in the SVZ (green box) on day 14 post-stroke. (C) Quantification of the number of neuroblasts in the peri-infarct cortical region and percentage of proliferated neuroblast in SVZ on day 14 post-stroke. ∗∗P < 0.01, ∗∗∗P < 0.001, one-way ANOVA and post-hoc Bonferroni tests. n = 6 in each group. (D) Representative immunofluorescence images of new-born immature neurons in the stroke cavity on day 35 post-stroke (Tuj1/BrdU/Hoechst). (E) Quantification of new-born immature neurons in the stroke cavity on day 35 post-stroke. ∗P < 0.05, ∗∗P < 0.01, one-way ANOVA and post-hoc Dunnett's T3 test. n = 5 in each group. (F) Representative immunofluorescence images of new-born mature neurons in the stroke cavity (NeuN/BrdU/Hoechst) on day 63 post-stroke. (G) Quantification of new-born mature neurons in the stroke cavity on day 63 post-stroke. ∗∗P < 0.01, one-way ANOVA and post-hoc Dunnett's T3 test. n = 5 in each group. Data are presented as mean ± SEM. (H) Schematic diagram of the neuroblasts migrating from the SVZ toward the stroke cavity and differentiated into mature neurons. Schematic diagram was created with BioRender.com.
Fig. 4
Fig. 4
Synaptogenesis induced by bFGF-Chitosan gel in stroke cavity contributes to restoration of sensorimotor function after ischemic stroke. (A) Representative image of SV2A PET/CT in each group on day 63 post-stroke. (B) Quantification of SUVR in each group on day 63 post-stroke. ∗P < 0.05, ∗∗∗P < 0.001, one-way ANOVA and post-hoc Bonferroni tests, n = 4. (C) Anterograde synapses identified by the co-localization of new-born neurons with SV2A/synapsinI, and retrograde synapses identified by co-localization of new-born neurons with PSD95 in stroke cavity on day 63 post-stroke. (D) Schematic diagram of the anterograde and retrograde synaptic connection. (E) Representative ultra-structures images of synapses in the stroke cavity on day 63 post-stroke. At, axonal terminal; Den, dendrite; Red arrows, synaptic cleft; Red circle, gold particles. (F) Quantification of synapses in the stroke cavity in per field on day 63 post-stroke. ∗P < 0.05, ∗∗P < 0.01, one-way ANOVA and post-hoc Dunnett's T3 test. n = 4 in each group. (G) Disruption of synaptic function in the stroke cavity prevents some degree of sensorimotor recovery after stroke. ∗∗P < 0.01, ∗∗∗P < 0.001, bFGF-chitosan + TeLC-mCherry group compared with the sham + TeLC-mCherry group. #P < 0.05, ###P < 0.001, bFGF-chitosan + TeLC-mCherry group compared with the bFGF-chitosan + mCherry, two-way ANOVA. n = 5 in each group. Data are presented as mean ± SEM.
Fig. 5
Fig. 5
bFGF-Chitosan gel reconstructs functional neural circuits after ischemic stroke. (A) Electro-physiological recordings demonstrate the formation of intra-nascent neural networks on day 63 post-stroke. MED64 array was placed on the motor cortex in sham group. When stimulated the motor cortex (blue star), multiple places were activated in the adjacent area (red triangle). (B) MED64 array was partly on the host's uninjured cortex and partly on the stroke cavity in the bFGF-Chitosan gel group. When stimulated the host's uninjured area (blue star), multiple places were activated in the regenerated area (red triangle), indicative of functional connection between nascent neural network with host. Red triangle, a fEPSP recorded at electrode 46, could be suppressed by TTX (0.5 mM), and CNQX (10 mM). (C) Timeline of experimental procedure for anterograde tracing to detect cortical connections between new-born neurons in the stroke cavity and the contralateral motor cortex. (D) mCherry positive fibers form close contact (likely synaptic) with BrdU+/Tuj1+ new-born neurons in the stroke cavity in the bFGF-Chitosan gel group on day 77 post-stroke. (E) Schematic diagram of the electrophysiological test in vivo on day 63 post-stroke. (F) When stimulated the host's contralateral motor cortex, typical fPSPs were recorded in the ipsilateral motor cortex in the sham group and the stroke cavity in the bFGF-Chitosan gel group, while no fPSPs was recorded in the stroke alone group or the chitosan gel alone group. fPSPs, field postsynaptic potentials. (G) Quantification of fPSPs amplitude in each group on day 63 post-stroke. ∗∗∗P < 0.001, independent-samples T test, n = 5 in each group. Schematic diagram was created with BioRender.com.
Fig. 6
Fig. 6
bFGF-Chitosan gel induces migration of neural precursors derived from Nestin lineage toward peri-infract cortex. (A) Schematic diagram of NestinCreERT2-tdTomato transgenic mice. (B) Representative immunofluorescence images showed tdTomato + cells express Nestin in SVZ (tdTomato/Nestin/topro). (C) Representative immunofluorescence images from peri-infarct cortex of tdTomato + cells with various neuronal progenitor markers CD133, SOX2, and MASH1 on day 14 post-stroke. (D) Schematic of differentiation stages as defined by marker expression. Neural stem cells (NSC) produce neuronal progenitor cells (NPCs), which give rise to neurons. (E) Quantitative analyses of cell density of tdTomato+, tdTomato+/CD133+, tdTomato+/SOX2+, and tdTomato+/MASH1+ in peri-infarct cortex on day 14 post-stroke. ∗P < 0.05, ∗∗P < 0.01, independent-samples T test, n = 4 in each group. (F) Quantitative analyses of differential rate of NPCs among tdTomato + cells on day 14 post-stroke. Independent-samples T test, n = 4 in each group. Schematic diagram was created with BioRender.com.
Fig. 7
Fig. 7
New-born neurons in stroke cavity partly derived from Nestin lineage in SVZ and contribute to functional restoration. (A) Representative immunofluorescence images from the stroke cavity showing expression of the NeuN in tdTomato+ cells at 4w and 8w of bFGF-Chitosan gel implantation (tdTomato/NeuN/topro). (B) Quantitative analyses of cell density of tdTomato+/NeuN+. P < 0.05, independent-samples T test, n = 4 in each group. (C) Representative immunofluorescence images from stroke cavity showing expression of SATB2 and CTIP2 in tdTomato+ cells at 8w of bFGF-Chitosan implantation. (D) Representative immunofluorescence images from stroke cavity showing expression of CAMKIIα and GABA in tdTomato+ cells at 8w of bFGF-Chitosan implantation. (E) Schematic diagram of NestinCreERT2-DTA transgenic mice. (F) After injection with tamoxifen in Nestin-DTA mice, Nestin lineage cells were eliminated. (G) Ablation of Nestin lineage cells prevents some degree of sensorimotor recovery after stroke. ∗P < 0.05, ∗∗P < 0.01, ∗∗∗P < 0.001, the NestinCreERT2-DTA + TAM group compared with the WT bFGF-Chitosan gel group. #P < 0.05, ##P < 0.01, ###P < 0.001, the NestinCreERT2-DTA + TAM group compared with the NestinCreERT2-DTA + Coil mice, two-way ANOVA. n = 5 in each group. Data are presented as mean ± SEM. Schematic diagram was created with BioRender.com.
Fig. 8
Fig. 8
bFGF-Chitosan gel suppress the activation of microglia in peri-infarct area. (A) Representative immunofluorescence images of microglia in the peri-infarct cortex on day 63 post-stroke (IBA1/Hoechst). (B) Representative 3D-reconstructions of microglia in each group. (C) Quantitative analyses of cell density of IBA1+ in the peri-infarct cortex on day 63 post-stroke. ∗∗∗P < 0.001, one-way ANOVA and post-hoc Bonferroni tests. n = 5 in each group. Data are presented as mean ± SEM. (D) Sholl analysis of microglia in the peri-infarct cortex on day 63 post-stroke. ∗P < 0.05, ∗∗P < 0.01, the chitosan gel alone group compared with the stroke alone group. #P < 0.05, ##P < 0.01, ####P < 0.001, the bFGF-Chitosan gel group compared with the stroke alone group, two-way ANOVA, n = 12 in each group. Data are presented as mean ± SEM.

References

    1. Campbell B.C.V., De Silva D.A., Macleod M.R., et al. Ischaemic stroke. Nat. Rev. Dis. Prim. 2019;5(1):70. - PubMed
    1. Jiang Y., Liu Z., Liao Y., et al. Ischemic stroke: from pathological mechanisms to neuroprotective strategies. Front. Neurol. 2022;13 - PMC - PubMed
    1. Moretti A., Ferrari F., Villa R.F. Neuroprotection for ischaemic stroke: current status and challenges. Pharmacol. Ther. 2015;146:23–34. - PubMed
    1. Du Y., Huo Y., Yang Q., et al. Ultrasmall iron-gallic acid coordination polymer nanodots with antioxidative neuroprotection for PET/MR imaging-guided ischemia stroke therapy. Explorations. 2023;3(1) - PMC - PubMed
    1. Tang L., Yin Y., Liu H., et al. Blood-brain barrier-penetrating and lesion-targeting nanoplatforms inspired by the pathophysiological features for synergistic ischemic stroke therapy. Adv. Mater. 2024;36(21) - PubMed

LinkOut - more resources