. 2025;28(2):264-272.
doi: 10.22038/ijbms.2024.78085.16880.

Protective effect of Lavandula angustifolia essential oil inhalation on neuromodulators regulating the sleep/wake cycle in rats with total sleep deprivation

Affiliations

Protective effect of Lavandula angustifolia essential oil inhalation on neuromodulators regulating the sleep/wake cycle in rats with total sleep deprivation

Arzu Yalcin et al. Iran J Basic Med Sci. 2025.

Abstract

Objectives: This study aimed to investigate the potential effects of different doses of Lavender angustifolia essential oil (Lavender EO) administered by inhalation on sleep latency and neuromodulators regulating the sleep/wake cycle in rats with total sleep deprivation (TSD).

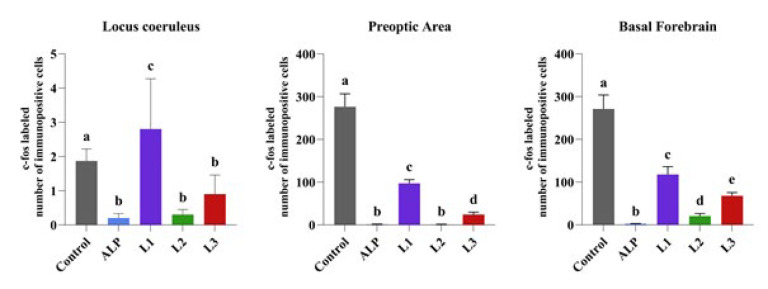
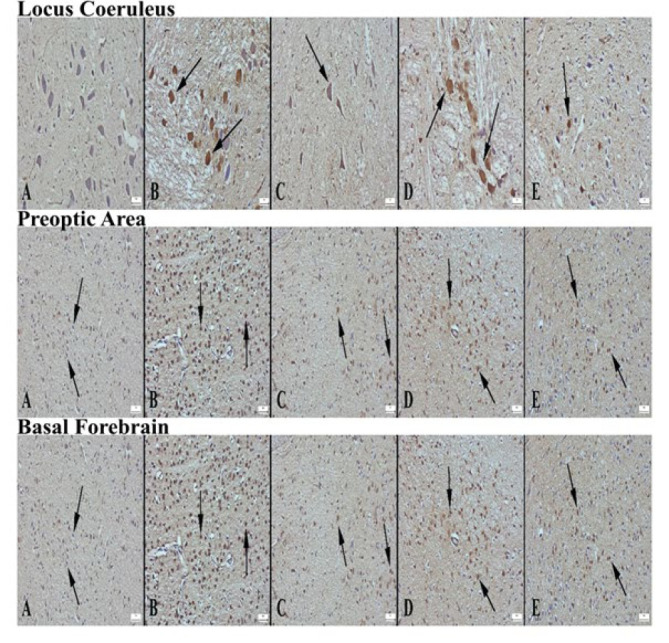
Materials and methods: Forty-eight male Sprague-Dawley rats were divided into five groups: Control, Alprazolam (ALP, 0.25 mg/kg given intraperitoneally), L1 (Lavender EO, 0.3 ml given by inhalation), L2 (Lavender EO, 0.5 ml given by inhalation), and L3 (Lavender EO, 1 ml given by inhalation); TSD was applied to all groups. Rats in SD groups were kept on a platform surrounded by water for 18 hr for 20 days, and for the remaining time, the animals were exposed to Lavender EO for 1 hr (11:00-12:00) and then were kept in their home cage for 5 hr (12:00-17:00). Their brain and brainstem were removed for histopathological and immunohistochemical analyses (c-Fos, ChAT, GAD, and ADRB2 expression) in the locus coeruleus (LC), basal forebrain (BF), and preoptic area (PO).

Results: The groups ranked by the severity of edema, hyperemia, and neurodegeneration in LC, BF, and PO areas were control, L3, L1, L2, and ALP. c-Fos expression significantly decreased in all brain regions in all groups except the L1 group. ChAT and GAD expressions increased dramatically in all brain regions. ADRB2 significantly increased in LC in ALP and L2 groups; in the PO area in ALP, L1, and L2 groups; and in BF in all groups.

Conclusion: Lavender EO treatment ameliorated c-Fos, ChAT, GAD, and ADRB2 expression, similar to the effect of ALP.

Keywords: Basal forebrain; Deprivation; Lavender oil; Locus coeruleus; Neural protection; Preoptic area; Sleep.


Conflict of interest statement

The authors declare that they have no known competing financial interests or personal relationships that could have appeared to influence the work reported in this paper.

Figures

Figure 1
Figure 1
Experimental procedure testing the effects of lavender AEO inhalation in rats
Figure 2
Figure 2
Microscopic appearance of locus coeruleus according to groups of rats (A) Significant degenerative changes in neurons (arrows) in the control group, (B) Significant decrease in degenerative cells (arrow) in the alprazolam group, (C) Reduced degenerative neurons in L1 group compared to control (arrows), (D) markedly reduced degenerative neurons in L2 group (arrow), (E) appearance of mildly reduced degenerative neurons in L3 group compared to control, HE, Bars=50 µm. Microscopic appearance of the preoptic area of the groups (A) marked hyperemia in the vessels in the control group (arrows), (B) markedly decreased pathological findings in the Alprazolam group, (C) decreased findings in the L1 group, (D) similar appearance to Alprazolam in the L2 group, (E) appearance of reduced pathological findings in the L3 group compared to the control, HE, Bars=50 µm. Microscopic appearance of the basal forebrain areas of the groups (A) marked hyperemia in the vessels in the control group (arrows), (B) markedly decreased pathological findings in the Alprazolam group, (C) decreased findings in the L1 group compared to the control group, (D) markedly decreased appearance of pathological findings in the L2 group, (E) appearance of decreased pathological findings in the L3 group compared to the control group, HE, Bars=50µm
Figure 3
Figure 3
Appearance of c-fos expression in locus coeruleus areas of the groups of rats (A) Significantly increased expression in neurons in control group (arrows), (B) Negative expression in Alprazolam group, (C) Decreased expression in L1 group compared to control group (arrow), (D) Negative expression in L2 group, (E) Decreased expression in L3 group compared to control, Streptavidin biotin peroxidase method, Bars=50 µm. c-fos expression in the preoptic area of the groups (A) Severe expression in neurons in the control group (arrows), (B) Negative expression in the alprazolam group, (C) Significantly decreased expression in the L1 group compared to the control group (arrow), (D) Negative expression in the L2 group, (E) Decreased expression in neurons in the L3 group compared to the control group (arrow), Streptavidin biotin peroxidase method, Bars=50 µm. Appearance of c-fos expression in the basal forebrain regions of the groups (A) Very strong expression in a large number of neurons in the control group (arrows), (B) Negative expression in the alprazolam group, (C) Significantly decreased expression in neurons in the L1 group compared to the control group (arrows), (D) Mild expression in few neurons in L2 group (arrow), (E) Mild expression in fewer neurons in L3 group compared to control group (arrows), Streptavidin biotin peroxidase method, Bars=50 µm
Figure 4
Figure 4
Comparison between groups of rats was evaluated using the Duncan test
Figure 5
Figure 5
Appearance of ChAT expression in locus coeruleus area of the groups of rats (A) Decreased expression in the control group, (B) Significantly increased expression in the alprazolam group (arrows), (C) Increased expression in L1 neurons compared to control group (arrow), (D) markedly increased expression in L2 group (arrows), (E) increased expression in L3 group compared to control, Streptavidin biotin peroxidase method, Bars=50µm. Appearance of ChAT expression in preoptic area according to groups (A) Decreased expression in neurons in the control group (arrows), (B) Significantly increased expression in neurons in the alprazolam group (arrows), (C) Increased expression in L1 neurons compared to control group (arrows), (D) markedly increased expression in L2 group (arrows), (E) increased expression in L3 group compared to control, Streptavidin biotin peroxidase method, Bars=50 µm. Appearance of ChAT expression in the basal forebrain area of the groups (A) Decreased expression in the control group, (B) Significantly increased expression in the alprazolam group (arrows), (C) Increased expression in L1 neurons compared to control group (arrow), (D) markedly increased expression in L2 group (arrows), (E) increased expression in L3 group compared to control, Streptavidin biotin peroxidase method, Bars=50 µm
Figure 6
Figure 6
Comparison between groups of rats was evaluated using the Duncan test
Figure 7
Figure 7
Appearance of GAD expression in locus coeruleus area of the groups of rats (A) Decreased expression in the control group, (B) Significantly increased expression in the alprazolam group (arrows), (C) Increased expression in L1 neurons compared to control group (arrow), (D) Significantly increased expression in L2 group (arrows), (E) Increased expression in L3 group neurons compared to control, Streptavidin biotin peroxidase method, Bars=50 µm. Appearance of GAD expression in preoptic area according to groups (A) decreased expression in neurons in the control group, (B) Significantly increased expression in neurons in the alprazolam group (arrows), (C) Increased expression in neurons of L1 group compared to control group (arrows), (D) markedly increased expression in L2 group (arrows), (E) increased expression in L3 group compared to control, Streptavidin biotin peroxidase method, Bars=50 µm. Appearance of GAD expression in the basal forebrain area of the groups (A) Decreased expression in the control group, (B) Significantly increased expression in the alprazolam group (arrows), (C) Increased expression in L1 neurons compared to control group (arrow), (D) markedly increased expression in L2 group (arrows), (E) increased expression in L3 group compared to control, Streptavidin biotin peroxidase method, Bars=50 µm
Figure 8
Figure 8
Comparison between groups of rats was evaluated using the Duncan test
Figure 9
Figure 9
Appearance of ADRB2 expression in locus coeruleus area of the groups of rats (A) Decreased expression in the control group, (B) Significantly increased expression in the alprazolam group (arrows), (C) Increased expression in L1 neurons compared to the control group, (D) Significantly increased expression in L2 group (arrows), (E) Increased expression in L3 group neurons compared to control, Streptavidin biotin peroxidase method, Bars=50 µm. Appearance of ADRB2 expression in preoptic area according to groups (A) Decreased expression in neurons in the control group, (B) Significantly increased expression in neurons in the alprazolam group (arrows), (C) Increased expression in neurons of L1 group compared to control group (arrows), (D) markedly increased expression in L2 group (arrows), (E) increased expression in L3 group compared to control, Streptavidin biotin peroxidase method, Bars=50 µm. Appearance of ADRB2 expression in the basal forebrain area of the groups (A) Decreased expression in the control group, (B) Significantly increased expression in the alprazolam group (arrows), (C) Increased expression in L1 neurons compared to control group (arrow), (D) markedly increased expression in L2 group (arrows), (E) increased expression in L3 group compared to control, Streptavidin biotin peroxidase method, Bars=50 µm
Figure 10
Figure 10
Comparison between groups of rats was evaluated using the Duncan test

References

    1. Liew SC, Aung T. Sleep deprivation and its association with diseases- a review. Sleep Med. 2021;77:192–204. - PubMed
    1. Wang Z, Yuan K, Ji YB, Li SX, Shi L, Wang Z, et al. Alterations of the gut microbiota in response to total sleep deprivation and recovery sleep in rats. Nat Sci Sleep. 2022;14:121–133. - PMC - PubMed
    1. Tobaldini E, Costantino G, Solbiati M, Cogliati C, Kara T, Nobili L, et al. Sleep, sleep deprivation, autonomic nervous system and cardiovascular diseases. Neurosci Biobehav Rev. 2017;74:321–329. - PubMed
    1. Kiley JP, Twery MJ, Gibbons GH. The national center on sleep disorders research— progress and promise. Sleep. 2019;42:1–5. - PMC - PubMed
    1. Salfi F, Lauriola M, Tempesta D, Calanna P, Socci V, De Gennaro L, et al. Effects of total and partial sleep deprivation on reflection ımpulsivity and risk-taking in deliberative decision-making. Nat Sci Sleep. 2020;12:309–324. - PMC - PubMed

LinkOut - more resources