

In vivo efficacy and safety of systemically administered serinol nucleic acid-modified antisense oligonucleotides in mouse kidney
- PMID: 39850319
- PMCID: PMC11754010
- DOI: 10.1016/j.omtn.2024.102387
In vivo efficacy and safety of systemically administered serinol nucleic acid-modified antisense oligonucleotides in mouse kidney
Erratum in
-
Erratum: In vivo efficacy and safety of systemically administered serinol nucleic acid-modified antisense oligonucleotides in mouse kidney.Mol Ther Nucleic Acids. 2025 Feb 25;36(1):102497. doi: 10.1016/j.omtn.2025.102497. eCollection 2025 Mar 11. Mol Ther Nucleic Acids. 2025. PMID: 40083647 Free PMC article.
Abstract
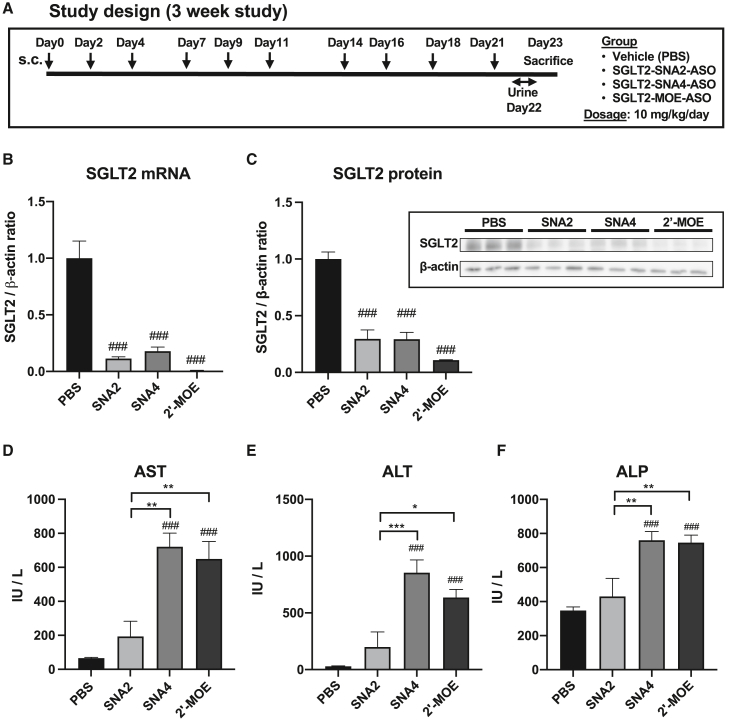
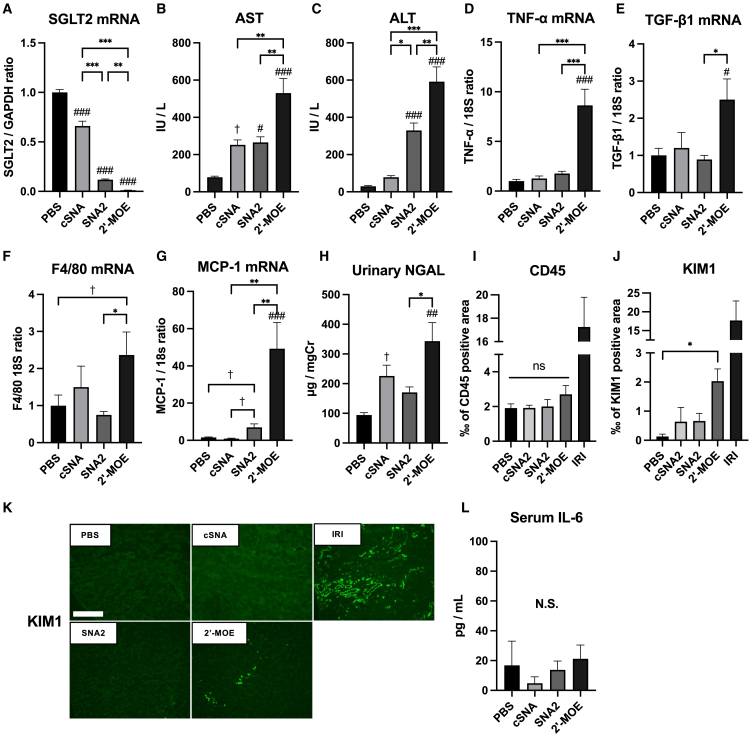
Nucleic acid medicine encompassing antisense oligonucleotides (ASOs) has garnered interest as a potential avenue for next-generation therapeutics. However, their therapeutic application has been constrained by challenges such as instability, off-target effects, delivery issues, and immunogenic responses. Furthermore, their practical utility in treating kidney diseases remains unrealized. Recently, we developed a serinol nucleic acid-modified ASO (SNA-ASO) that exhibits significant nuclease resistance. In this study, we evaluated the in vivo efficacy of SNA-ASOs in mouse kidney. We subcutaneously administered various types of phosphorothioate-modified gapmer ASOs with SNA or 2'-O-methoxyethyl (2'-MOE) modifications (MOE-ASO) targeting sodium glucose cotransporter 2 (SGLT2) in mice. The subcutaneous administration of SGLT2-SNA-ASO led to a dose-dependent reduction in renal SGLT2 expression and subsequent glucosuria. The inhibitory effects of SGLT2-SNA-ASO were more potent and prolonged than those of ASOs without SNA. Moreover, SGLT2-SNA-ASO did not cause severe liver damage, unlike SGLT2-MOE-ASO. The administration of Cy5-labeled-ASOs demonstrated an early increase in renal uptake, particularly in the renal proximal tubules, when modified with SNA. In conclusion, systemic administration of SGLT2-ASO modified with the artificial nucleic acid SNA effectively suppressed renal SGLT2 expression and induced urinary glucose excretion. These results suggest that SNA-modified ASOs show potential for application in developing nucleic acid therapeutics.
Keywords: ASO; MT: Oligonucleotides: Therapies and Applications; SGLT2; SNA; SNA-ASO; antisense oligonucleotide; kidney; nucleic acid therapeutics; serinol nucleic acid; serinol nucleic acid-modified antisense oligonucleotide.
© 2024 The Authors.
Conflict of interest statement
T.T., T.I., Y.K., and H.A. are listed as inventors on a patent application from Nagoya University (WO2021/039598, RNA ACTION INHIBITOR AND USE THEREOF).
Figures


Similar articles
-
SNA-modified antisense oligonucleotides: A new pathway for renal targeting?Mol Ther Nucleic Acids. 2025 Feb 17;36(1):102476. doi: 10.1016/j.omtn.2025.102476. eCollection 2025 Mar 11. Mol Ther Nucleic Acids. 2025. PMID: 40034209 Free PMC article.
-
Characterization of the Activity and Distribution of a 2'-O-Methoxyethyl-Modified Antisense Oligonucleotide in Models of Acute and Chronic Kidney Disease.Nucleic Acid Ther. 2018 Oct;28(5):297-306. doi: 10.1089/nat.2018.0723. Epub 2018 Aug 22. Nucleic Acid Ther. 2018. PMID: 30133341
-
Evaluation of the effect of 2'-O-methyl, fluoro hexitol, bicyclo and Morpholino nucleic acid modifications on potency of GalNAc conjugated antisense oligonucleotides in mice.Bioorg Med Chem Lett. 2018 Dec 15;28(23-24):3774-3779. doi: 10.1016/j.bmcl.2018.10.011. Epub 2018 Oct 10. Bioorg Med Chem Lett. 2018. PMID: 30342955
-
Assessment of the Effect of Organ Impairment on the Pharmacokinetics of 2'-MOE and Phosphorothioate Modified Antisense Oligonucleotides.J Clin Pharmacol. 2023 Jan;63(1):21-28. doi: 10.1002/jcph.2121. Epub 2022 Jul 26. J Clin Pharmacol. 2023. PMID: 35801818 Review.
-
Evolution of antisense oligonucleotides: navigating nucleic acid chemistry and delivery challenges.Expert Opin Drug Discov. 2025 Jan;20(1):63-80. doi: 10.1080/17460441.2024.2440095. Epub 2024 Dec 17. Expert Opin Drug Discov. 2025. PMID: 39653607 Review.
Cited by
-
Quercetin-Loaded Ginkgo Starch Nanoparticles: A Promising Strategy to Improve Bioactive Delivery and Cellular Homeostasis in Functional Foods.Foods. 2025 May 26;14(11):1890. doi: 10.3390/foods14111890. Foods. 2025. PMID: 40509418 Free PMC article.
-
SNA-modified antisense oligonucleotides: A new pathway for renal targeting?Mol Ther Nucleic Acids. 2025 Feb 17;36(1):102476. doi: 10.1016/j.omtn.2025.102476. eCollection 2025 Mar 11. Mol Ther Nucleic Acids. 2025. PMID: 40034209 Free PMC article.
References
-
- Burdick A.D., Sciabola S., Mantena S.R., Hollingshead B.D., Stanton R., Warneke J.A., Zeng M., Martsen E., Medvedev A., Makarov S.S., et al. Sequence motifs associated with hepatotoxicity of locked nucleic acid--modified antisense oligonucleotides. Nucleic Acids Res. 2014;42:4882–4891. - PMC - PubMed
-
- Bennett C.F., Swayze E.E. RNA targeting therapeutics: molecular mechanisms of antisense oligonucleotides as a therapeutic platform. Annu. Rev. Pharmacol. Toxicol. 2010;50:259–293. - PubMed
-
- Crooke S.T., Wang S., Vickers T.A., Shen W., Liang X.-H. Cellular uptake and trafficking of antisense oligonucleotides. Nat. Biotechnol. 2017;35:230–237. - PubMed
LinkOut - more resources
Full Text Sources
Research Materials
