. 2024 Dec 5;28(1):111494.
doi: 10.1016/j.isci.2024.111494. eCollection 2025 Jan 17.

Daily oscillation of the excitation/inhibition ratio is disrupted in two mouse models of autism

Affiliations

Daily oscillation of the excitation/inhibition ratio is disrupted in two mouse models of autism

Michelle C D Bridi et al. iScience. .

Erratum in

Abstract

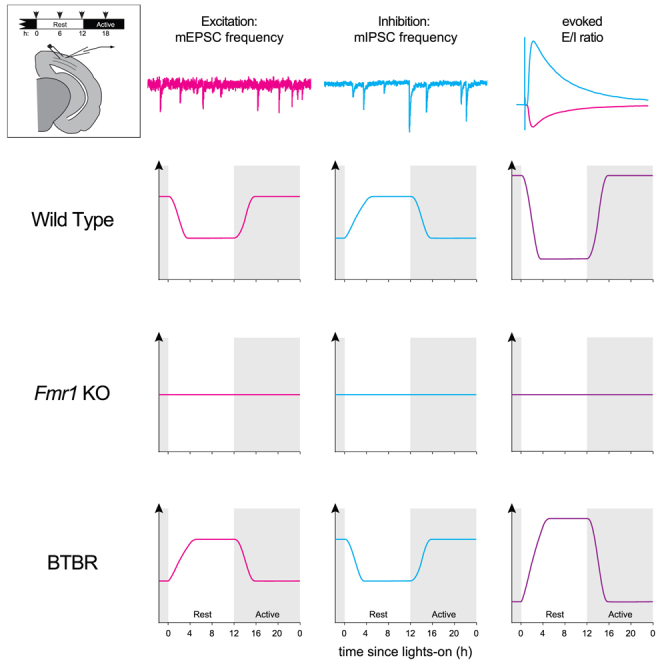
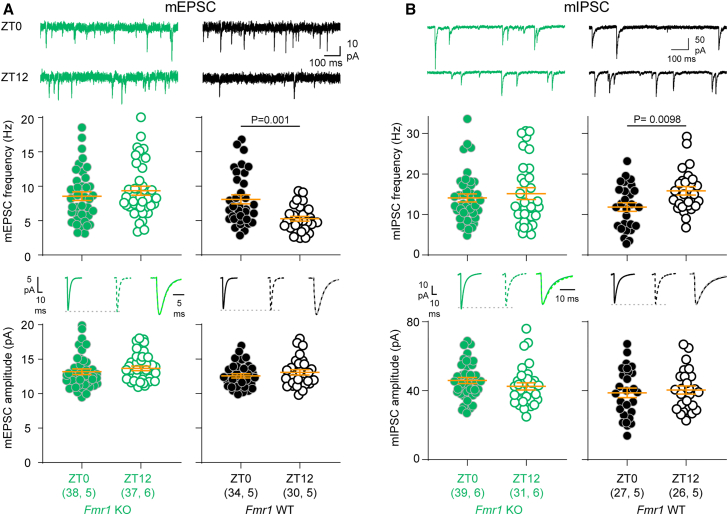
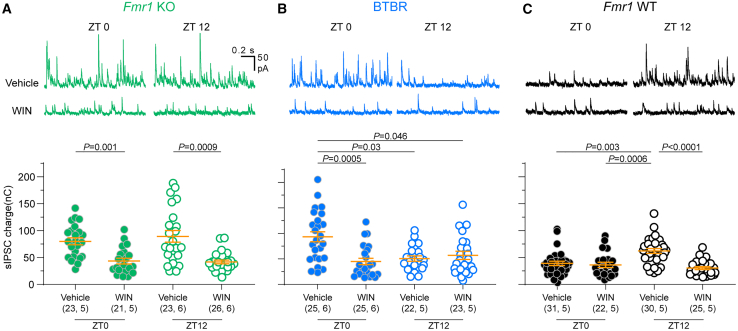
Alterations to the excitation/inhibition (E/I) ratio are postulated to underlie behavioral phenotypes in autism spectrum disorder (ASD) patients and mouse models. However, in wild type mice the E/I ratio is not constant, but instead oscillates across the 24-h day. Therefore, we tested whether E/I regulation, rather than the overall E/I ratio, is disrupted in two ASD-related mouse lines: Fmr1 KO and BTBR, models of syndromic and idiopathic ASD, respectively. The E/I ratio is dysregulated in both models, but in different ways: the oscillation is lost in Fmr1 KO and reversed in BTBR mice. Phenotypes in both models associate with differences the timing of excitatory and inhibitory synaptic transmission and endocannabinoid signaling compared to wild type mice, but not with altered sleep. These findings raise the possibility that ASD-related phenotypes may be produced by a mismatch between E/I and behavioral state, rather than alterations to overall E/I levels per se.

Keywords: Neuroscience; Sensory neuroscience.


Conflict of interest statement

The authors declare no competing interests.

Figures

None
Graphical abstract
Figure 1
Figure 1
E/I is dysregulated in two mouse models of autism (A) Left: Fmr1 KO/WT (green) and BTBR/B6 (blue) mice were sacrificed at the indicated times of day. Right: Acute brain slices containing V1 were obtained, and responses to layer 2/3 stimulation over a range of intensities were recorded using whole-cell patch clamp of layer 2/3 pyramidal neurons. Inhibitory (upward deflection) and excitatory (downward deflection) responses were recorded in the same cell and the E/I ratio was calculated using the stimulation intensities over which the E/I ratio was stable. (B) Oscillation of the E/I ratio across the day is absent in Fmr1 KO mice. Top: Fmr1 KO Kruskal-Wallis p = 0.65. Bottom: Fmr1 WT 1-way ANOVA Holm-Sidak post-hoc p values indicated. (C) BTBR mice exhibit E/I dysregulation, such that the E/I ratio is high at ZT12, contrasting with higher E/I at ZT0 in B6 mice. p values correspond to 2-tailed t tests. (B-C) Sample size is indicated as (cells, mice). Error bars indicate mean ± SEM. Example traces are normalized to peak inhibitory response. See also Figure S1. For detailed test statistics, see Tables S1 and S2.
Figure 2
Figure 2
Sleep timing is normal in Fmr1 KO and BTBR mice (A) Percent time Fmr1 mice spent awake (A1), in NREM sleep (A2), and in REM sleep (A3). There was no significant main effect of genotype or genotype × time of day interaction for any arousal state when data were broken into 1h bins (left) or averaged across the 12-h light and dark phases (right). There was a significant main time of day effect for all states (∗p < 0.05 vs. ZT0, Holm-Sidak post-hoc test). (B) Percent time BTBR and B6 mice spent in each arousal state. BTBR mice displayed grossly normal sleep timing (i.e., slept more during the light phase) and there was no significant main effect of genotype for any arousal state. There were small but significant interaction effects for wake (B1) and REM sleep (B3) when data were broken into 1h bins (left) and for REM sleep (B3) when data were averaged into 12h bins (right). There was a significant main time of day effect for all states (∗p < 0.05 vs. ZT0, Holm-Sidak post-hoc test). Data were averaged over 3 recording days for each mouse prior to statistical analysis. All data were analyzed using two-way repeated measures ANOVAs. Data are shown as mean ± SEM. N = number of mice. See also Figure S3. For detailed test statistics, see Table S3.
Figure 3
Figure 3
Oscillation of both excitation and inhibition is flattened in Fmr1 KO mice (A) mEPSC frequency does not change with time of day in Fmr1 KO mice (p = 0.35, Mann-Whitney test), but is higher at ZT0 in Fmr1 WT control mice (p = 0.001, Mann-Whitney test). Amplitude did not change with time of day in either genotype (KO: p = 0.19; WT: p = 0.39; Mann-Whitney test). (B) mIPSC frequency does not change with time of day in Fmr1 KO mice (U = 596, p = 0.93, Mann-Whitney test), but is higher at ZT12 in Fmr1 WT control mice (t(51) = 2.69, p = 0.0098, t test). Amplitude did not change with time of day in either genotype (KO: t(68) = 1.26, p = 0.21; WT: t(51) = 0.46, p = 0.65, t test). Data are presented as mean ± SEM. Sample size is indicated as (cells, mice). Averaged traces: solid lines indicate ZT0, dotted lines indicate ZT12; scaled, superimposed averaged traces illustrate that there was no difference in kinetics between the two times of day. For detailed mE/IPSC characteristics and test statistics, see Table S4.
Figure 4
Figure 4
Oscillation of both excitation and inhibition is reversed in BTBR mice (A) mEPSC frequency is higher at ZT12 in BTBR mice (U = 322, p = 0.016, Mann-Whitney test), and higher at ZT0 in B6 control mice (t(67) = 2.53, p = 0.014, t test). Amplitude did not change with time of day in either genotype (BTBR: t(61) = 1.08, p = 0.28; B6: t(67) = 0.11, p = 0.91; t test). (B) mIPSC frequency is higher at ZT0 in BTBR mice (U = 278, p = 0.026, Mann-Whitney test), and higher at ZT12 in B6 controls (U = 464, p = 0.017, Mann-Whitney test). Amplitude did not change with time of day in either genotype (BTBR: t(56) = 0.93, p = 0.36; B6: t(72) = 1.71, p = 0.09, t test). Data are presented as mean ± SEM. Sample size is indicated as (cells, mice). Averaged traces: solid lines indicate ZT0, dotted lines indicate ZT12; scaled, superimposed averaged traces illustrate that there was no difference in kinetics between the two times of day. For detailed mE/IPSC characteristics and test statistics, see Table S4.
Figure 5
Figure 5
eCB signaling is dysregulated in Fmr1 KO and BTBR mice Slices were obtained at ZT0 or ZT12 and incubated in the eCB agonist WIN (10μM) or vehicle. sIPSCs were recorded from both treatment conditions in each animal. (A) Example traces (top) and quantification (bottom) of sIPSCs recorded from Fmr1 KO slices. WIN significantly decreased sIPSC charge at both ZT0 and ZT12. sIPSC charge did not differ between times of day within vehicle or WIN treatment groups (p > 0.9999). Kruskal-Wallis ANOVA on ranks H = 28.73, p < 0.0001. (B) Example traces (top) and quantification (bottom) of sIPSCs recorded from BTBR slices. WIN suppressed inhibitory transmission only at ZT0. Kruskal-Wallis ANOVA on ranks H = 16.9, p = 0.0007. (C) Example traces (top) and quantification (bottom) of sIPSCs recorded from Fmr1 WT slices. sIPSC charge was elevated and sensitive to suppression by WIN at ZT12. Kruskal-Wallis ANOVA on ranks H = 27.9, p < 0.0001. Data are shown as mean ± SEM and sample size is indicated as (cells, mice). p values correspond to Dunn’s post-hoc test. See also Figure S4.
Figure 6
Figure 6
Altered timing or amplitude of the E/I oscillation preserves the WT E/I ratio at multiple times of day (A) Compared to WT (black), decreased amplitude (light green) or complete loss (dark green) of the E/I oscillation causes an apparent increase in E/I ratio during the light phase and/or decrease during the dark phase, but the E/I ratio is not different from WT at two times of day (stars). Our results are consistent with a loss of the E/I oscillation in Fmr1 KO mice. (B) Compared to WT, altered timing of the E/I oscillation, such as a phase shift (light blue) or phase reversal (dark blue) can cause an apparent increase in the E/I ratio during the light phase, but the E/I ratio is not different from WT at multiple times of day (stars). We observed altered timing of the oscillation in BTBR mice.

References

    1. Maenner M.J., Warren Z., Williams A.R., Amoakohene E., Bakian A.V., Bilder D.A., Durkin M.S., Fitzgerald R.T., Furnier S.M., Hughes M.M., et al. Prevalence and characteristics of autism spectrum disorder among children aged 8 years — Autism and Developmental Disabilities Monitoring Network, 11 sites, United States, 2020. MMWR. Surveill. Summ. 2023;72:1–14. - PMC - PubMed
    1. Geschwind D.H. Advances in autism. Annu. Rev. Med. 2009;60:367–380. doi: 10.1146/annurev.med.60.053107.121225. - DOI - PMC - PubMed
    1. Robertson C.E., Baron-Cohen S. Sensory perception in autism. Nat. Rev. Neurosci. 2017;18:671–684. doi: 10.1038/nrn.2017.112. - DOI - PubMed
    1. Goel A., Cantu D.A., Guilfoyle J., Chaudhari G.R., Newadkar A., Todisco B., de Alba D., Kourdougli N., Schmitt L.M., Pedapati E., et al. Impaired perceptual learning in a mouse model of Fragile X syndrome is mediated by parvalbumin neuron dysfunction and is reversible. Nat. Neurosci. 2018;21:1404–1411. doi: 10.1038/s41593-018-0231-0. - DOI - PMC - PubMed
    1. Berto S., Treacher A.H., Caglayan E., Luo D., Haney J.R., Gandal M.J., Geschwind D.H., Montillo A.A., Konopka G. Association between resting-state functional brain connectivity and gene expression is altered in autism spectrum disorder. Nat. Commun. 2022;13:3328. doi: 10.1038/s41467-022-31053-5. - DOI - PMC - PubMed

LinkOut - more resources