. 2025 Jan 9:15:1477705.
doi: 10.3389/fgene.2024.1477705. eCollection 2024.

Single-cell RNA sequencing elucidates cellular plasticity in esophageal small cell carcinoma following chemotherapy treatment

Affiliations

Single-cell RNA sequencing elucidates cellular plasticity in esophageal small cell carcinoma following chemotherapy treatment

Qinkai Zhang et al. Front Genet. .

Abstract

Small cell carcinoma of the esophagus (SCCE) is a rare and aggressively progressing malignancy that presents considerable clinical challenges.Although chemotherapy can effectively manage symptoms during the earlystages of SCCE, its long-term effectiveness is notably limited, with theunderlying mechanisms remaining largely undefined. In this study, weemployed single-cell RNA sequencing (scRNA-seq) to analyze SCCE samplesfrom a single patient both before and after chemotherapy treatment. Our analysisrevealed significant cellular plasticity and alterations in the tumormicroenvironment's cellular composition. Notably, we observed an increase intumor cell diversity coupled with reductions in T cells, B cells, and myeloid-likecells. The pre-treatment samples predominantly featured carcinoma cells in amiddle transitional state, while post-treatment samples exhibited an expandedpresence of cells in terminal, initial-to-terminal (IniTerm), and universally alteredstates. Further analysis highlighted dynamic interactions between tumor cells andimmune cells, with significant changes detected in key signaling pathways, suchas TIGIT-PVR and MDK-SDC4. This study elucidates the complex dynamics of cellplasticity in SCCE following chemotherapy, providing new insights and identifyingpotential therapeutic targets to enhance treatment efficacy.

Keywords: cell plasticity; chemotherapy; single-cell RNA sequencing; small cell carcinoma of the esophagus; tumor microenvironment.


Conflict of interest statement

The authors declare that the research was conducted in the absence of any commercial or financial relationships that could be construed as a potential conflict of interest.

Figures

FIGURE 1
FIGURE 1
Comprehensive Analysis of Cellular Composition and Clustering in SCCE Across Treatment Regimens (A). Timeline of treatments and scRNA-seq sampling for a 66-year-old male diagnosed with SCCE, detailing the sequence of therapeutic interventions and corresponding sampling points. (B) Computed tomography (CT) scan image at diagnosis, displaying a prominent lesion located between 24 and 28 cm from the incisors on the anterior esophagus, highlighted within a red circle. (C) CT scan image from 31 October 2022, following the completion of five chemotherapy cycles with irinotecan and cisplatin, showing a reduction in tumor size, indicated by the area within the red circle. (D) CT scan from 27 September 2023, showing progressive disease (PD) despite the patient undergoing concurrent chemoradiation therapy and multiple cycles of teriparatide monoclonal antibody therapy, with the tumor area highlighted within the red circle. (E) UMAP visualization of eight major cell types within the SCCE microenvironment, including epithelial cells, T cells, myeloid cells, myeloid-like B cells (MB), B cells, basophils, endothelial cells, and fibroblasts. (F) Results of clustering analysis using the Seurat package, identifying 25 distinct cellular clusters, each annotated based on the expression profiles of established marker genes. (G) Bar chart presenting a comparative quantitative analysis of cell type distributions before and after treatment, detailing the proportional changes in each cell type across naive and treated samples.
FIGURE 2
FIGURE 2
Epithelial Cell Dynamics and Pseudotime Analysis in SCCE Following Treatment (A) t-SNE analysis illustrating distinct clustering patterns of epithelial cells from SCCE, revealing variability in cellular states post-treatment. (B) Volcano plot displaying differentially expressed genes (DEGs) between naive and treated epithelial cells. Upregulated genes in treated cells such as LINC02560, CST6, TPRG1, LYPD2, SPRR2F, CLC4A, and CD38 are highlighted in red, while downregulated genes post-treatment, including NPTX1, KIF1A, and CXXC4, are marked in blue. (C) KEGG pathway enrichment analysis of DEGs, identifying significantly enriched signaling pathways crucial for tumor cell interactions within their microenvironment. This includes pathways such as extracellular matrix (ECM)-receptor interactions, cytokine-cytokine receptor interactions, cell adhesion molecules, TNF signaling, Ras signaling, and PI3K-Akt signaling, which are essential for immune modulation and cell survival. (D) GO analysis illustrating significant enrichment in terms related to the molecular biology of treated epithelial cells. Key processes highlighted include nucleoside monophosphate metabolic process, regulation of DNA biosynthetic process, protein-DNA complex assembly, and positive regulation of DNA-binding transcription factor activity. (E) Pseudotime trajectory depicting the progression of epithelial cell states from the Initiator state, through Middle, to the Terminus state. (F) Clustering analysis of epithelial cells identifying five distinct groups: Initiator, Middle, Terminus, IniTerm (cells transitioning from initial to terminal states), and Universal (cells exhibiting characteristics of all stages). (G) t-SNE plots showcasing the segregation of these clusters in both naive and treatment groups. (H) Variations in the distribution of these clusters between naive and treatment groups, with naive samples predominantly concentrated in the Middle state, while treatment samples show an increase in cells classified as Terminus, IniTerm, and Universal states. (I) Violin plots illustrating expression patterns of key tumor suppressor genes across pseudotime clusters, such as CDKN2A, CDH1, BRCA1, BRCA2, MSH2, MSH6, and RUNX3. These plots indicate the significant roles of these genes in cellular state transitions and responses to treatment.
FIGURE 3
FIGURE 3
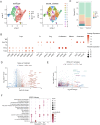
UMAP Analysis and Differential Gene Expression in T Cell Subtypes within Esophageal Carcinoma Samples (A) UMAP visualization identifying five major T cell subtypes within esophageal carcinoma samples, including cytotoxic T cells (Tcyto), primary cytotoxic T cells (PCTL), helper T cells (Th), exhausted T helper cells (ExhrTH), and effector T cells (Teff), with associated marker gene expression levels depicted. (B) Results of clustering analysis displaying six distinct cellular clusters of T cells identified using the Seurat package. (C) Comparative analysis of T cell subtype composition between naive and treatment samples, demonstrating increases in cytotoxic and helper T cells and decreases in exhausted T helper and effector T cells following treatment. (D) Differential gene expression analysis between naive and treated T cells, highlighting genes such as IGHG1, IGHA1, and IGKC, which were upregulated, and ALDH1A1 and IGFBP3, which were downregulated. (E) Analysis of gene expression patterns across T cell subtypes, noting upregulation of GZMB and PRF1 in Teff cells and increased expression of TIGIT and TOX2 in ExhrTH cells. (F) KEGG pathway enrichment analysis of differentially expressed genes, emphasizing significant pathways including cytokine-cytokine receptor interaction, cell adhesion molecules, extracellular matrix (ECM)-receptor interaction, and Th1 and Th2 cell differentiation. These pathways are crucial for T cell functionality and the immune response within the tumor environment.
FIGURE 4
FIGURE 4
Interaction Networks and Signaling Pathways Between Tumor Cells and T Cells in the Esophageal Carcinoma Microenvironment Post-Treatment (A) Illustration of dynamic changes in cell-cell interactions between tumor cells (Initiator and Universal) and various T cell subtypes across naive and treated samples, demonstrating a marked increase in interactions following treatment. (E–G) Pathway analysis in treated samples, illustrating upregulated pathways: (E) The TIGIT-PVR pathway, indicative of enhanced immune checkpoint activity. (F) The MDK-SDC4 pathway, associated with immune checkpoint regulation. (G) The FN1-ITGA6/ITGB1 pathway, involved in increased cell adhesion and extracellular matrix remodeling.
FIGURE 5
FIGURE 5
t-SNE Analysis and Pathway Enrichment in Myeloid Cells from SCCE (A) t-SNE plots illustrating eight distinct myeloid cell subtypes identified within SCCE samples: Myeloid-T helper collaborator (Mye-Th Collaborator), Replication-repair myeloid (RepliRepair Myeloid), Proliferation myeloid (Prolif Myeloid), Immune control myeloid (ImmuneControl Myeloid), Oncogenic myeloid (Onco Myeloid), Signaling myeloid (Signaling Myeloid), Proliferation regulatory myeloid (ProlifReg Myeloid), and Cytokine regulatory myeloid (CytokineReg Myeloid). (B) KEGG pathway enrichment analysis for the identified myeloid cell clusters, emphasizing critical pathways such as cytokine-cytokine receptor interaction, Ras signaling, PI3K-Akt signaling, and NF-kappa B signaling. These pathways are vital for myeloid cell functionality and their interactions within the tumor microenvironment. (C) Additional t-SNE visualization supporting the detailed identification of myeloid cell subtypes and their distinct genetic profiles, further delineating the heterogeneity within the SCCE myeloid cell population. (D) Comparative analysis of myeloid cell subtype distributions between naive and treatment samples, indicating shifts towards subtypes associated with increased proliferative and regulatory functions post-treatment, such as Prolif Myeloid, ProlifReg Myeloid, and CytokineReg Myeloid. This shift suggests an adaptation of the myeloid cell landscape in response to therapeutic interventions, reflecting changes in the cellular dynamics within the TME.
FIGURE 6
FIGURE 6
Interaction Networks and Signaling Pathways Between Tumor Cells and Myeloid Cells in SCCE Post-Treatment (A) Visualization of interaction networks between Initiator and Universal tumor cells and various myeloid subtypes, showing pronounced differences between naive and treatment conditions. Notable increases in interactions post-treatment highlight significant changes in cell-cell communication. (B–D) Pathway analysis in naive cells, demonstrating the activation of key pathways: (B) The MIF-CD74/CXCR4 pathway, involved in immune modulation. (C) The MDK-SDC1 pathway, associated with cell survival. (D) The HLA-E-CD8A pathway, crucial for immune suppression. (E–G) Pathway analysis in treated cells, depicting upregulated pathways indicative of altered cellular functions: (E) The TIGIT-PVR pathway, demonstrating enhanced immune checkpoint activity. (F) The MDK-SDC4 pathway, reflecting changes in immune checkpoint regulation. (G) The FN1-ITGA6/ITGB1 pathway, involved in increased cell adhesion and matrix remodeling. These pathways illustrate the dynamic responses of tumor and myeloid cells within the TME to therapeutic interventions, signifying adaptive shifts that may impact treatment efficacy and disease progression.
FIGURE 7
FIGURE 7
Schematic diagram of tumor progression in SCCE before and after chemotherapy. This diagram illustrates the primary tumor in SCCE, showing a reduction in tumor volume following chemotherapy. However, this treatment also induces an increase in tumor cell plasticity and heterogeneity, which contributes to the subsequent malignant progression of the tumor. This visualization highlights the dual effects of chemotherapy, underscoring the reduction in tumor size alongside the adverse enhancement of tumor complexity and potential for aggressive disease progression. (By FigDraw).

References

    1. GBD 2017 Oesophageal Cancer Collaborators (2020). The global, regional, and national burden of oesophageal cancer and its attributable risk factors in 195 countries and territories, 1990-2017: a systematic analysis for the Global Burden of Disease Study 2017. Lancet Gastroenterology. Hepatology 5 (6), 582–597. 10.1016/S2468-1253(20)30007-8 - DOI - PMC - PubMed
    1. Bader J. E., Voss K., Rathmell J. C. (2020). Targeting metabolism to improve the tumor microenvironment for cancer immunotherapy. Mol. Cell 78 (6), 1019–1033. 10.1016/j.molcel.2020.05.034 - DOI - PMC - PubMed
    1. Barnestein R., Galland L., Kalfeist L., Ghiringhelli F., Ladoire S., Limagne E. (2022). Immunosuppressive tumor microenvironment modulation by chemotherapies and targeted therapies to enhance immunotherapy effectiveness. Oncoimmunology 11 (1), 2120676. 10.1080/2162402X.2022.2120676 - DOI - PMC - PubMed
    1. Bennouna J., Bardet E., Deguiral P., Douillard J. Y. (2000). Small cell carcinoma of the esophagus: analysis of 10 cases and review of the published data. Am. J. Clin. Oncol. 23 (5), 455–459. 10.1097/00000421-200010000-00005 - DOI - PubMed
    1. Boissière-Michot F., Chateau M.-C., Thézenas S., Guiu S., Bobrie A., Jacot W. (2022). Correlation of the TIGIT-PVR immune checkpoint axis with clinicopathological features in triple-negative breast cancer. Front. Immunol. 13, 1058424. 10.3389/fimmu.2022.1058424 - DOI - PMC - PubMed

LinkOut - more resources