

Prediction of delirium occurrence using machine learning in acute stroke patients in intensive care unit
- PMID: 39850621
- PMCID: PMC11754397
- DOI: 10.3389/fnins.2024.1425562
Prediction of delirium occurrence using machine learning in acute stroke patients in intensive care unit
Abstract
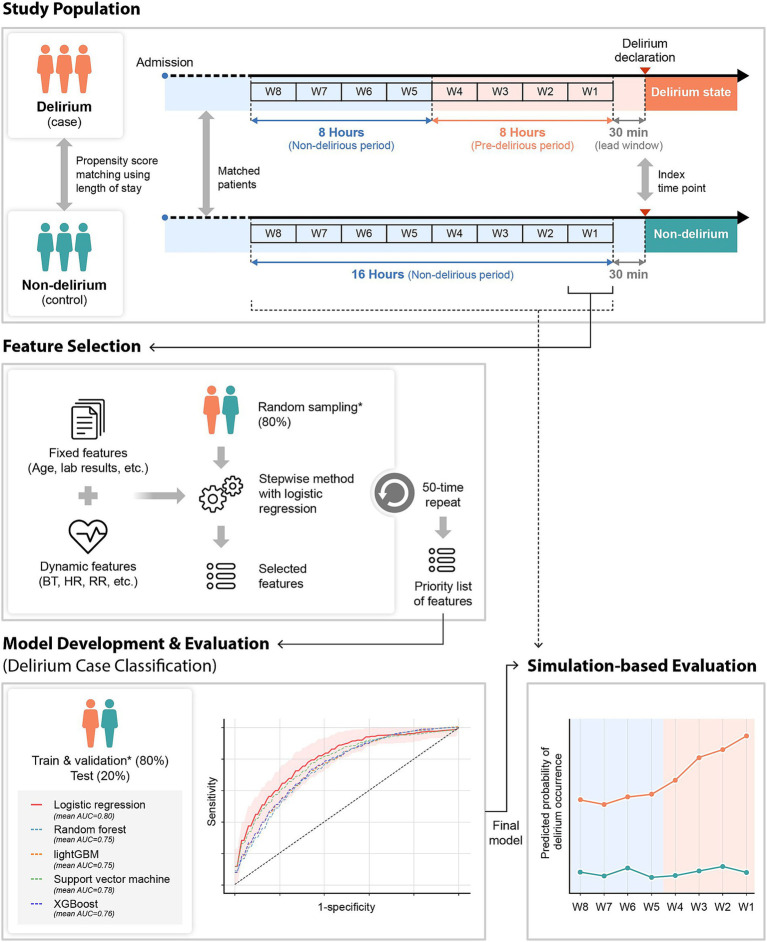
Introduction: Delirium, frequently experienced by ischemic stroke patients, is one of the most common neuropsychiatric syndromes reported in the Intensive Care Unit (ICU). Stroke patients with delirium have a high mortality rate and lengthy hospitalization. For these reasons, early diagnosis of delirium in the ICU is critical for better patient prognosis. Therefore, we developed and validated prediction models to classify the real-time delirium status in patients admitted to the ICU or Stroke Unit (SU) with ischemic stroke.
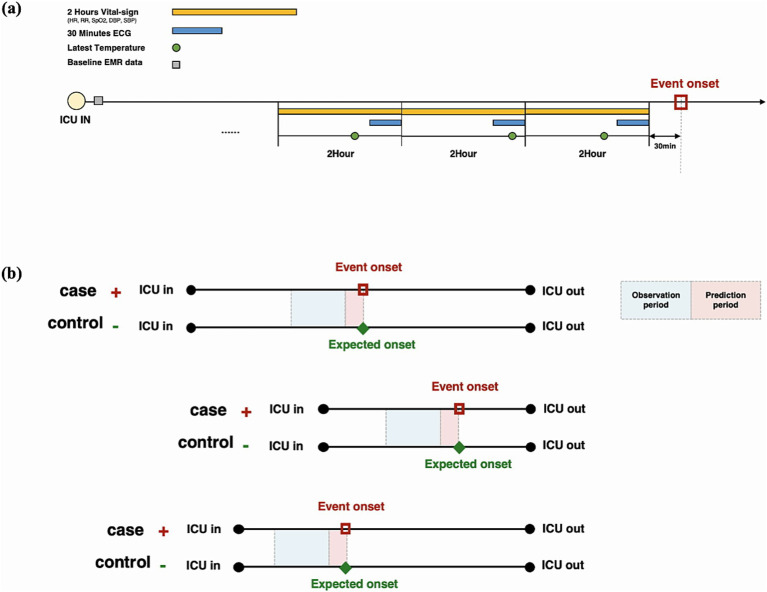
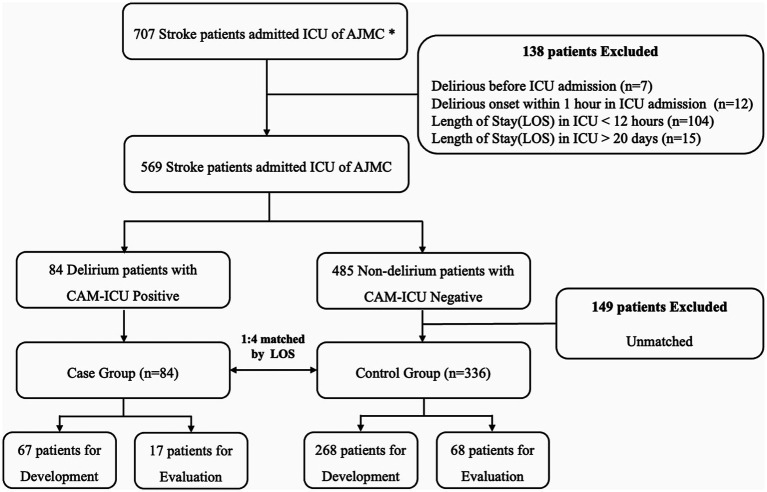
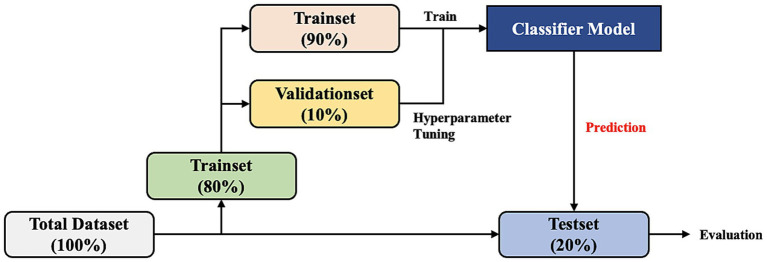
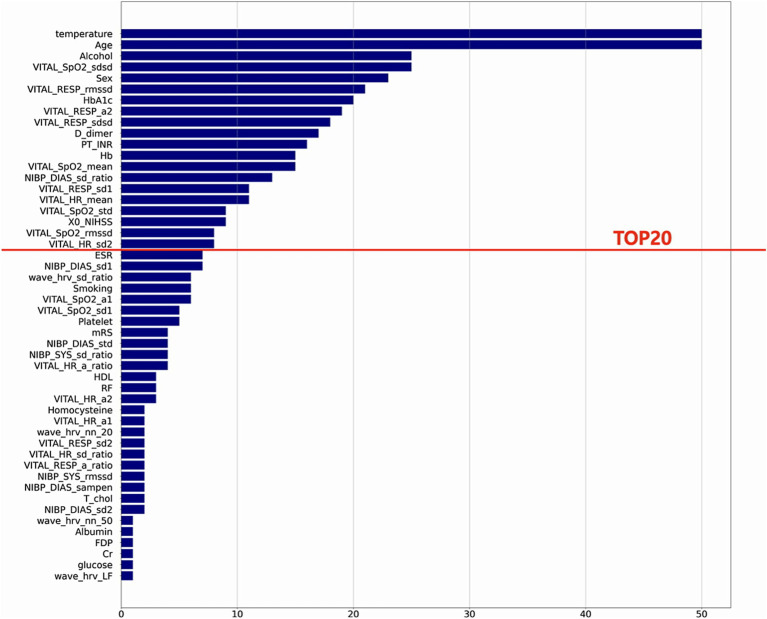
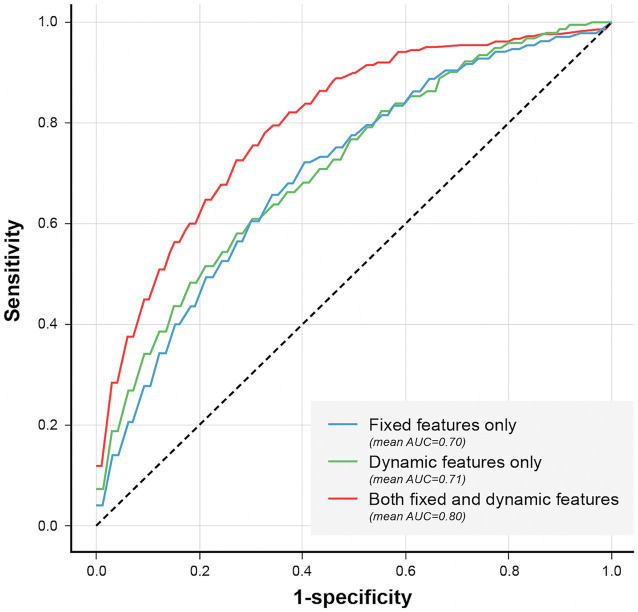
Methods: A total of 84 delirium patients and 336 non-delirium patients in the ICU of Ajou University Hospital were included. The 8 fixed features [Age, Sex, Alcohol Intake, National Institute of Health Stroke Scale (NIHSS), HbA1c, Prothrombin time, D-dimer, and Hemoglobin] identified at admission and 12 dynamic features [Mean or Variability indexes calculated from Body Temperature (BT), Heart Rate (HR), Respiratory Rate (RR), Oxygen saturation (SpO2), Systolic Blood Pressure (SBP), and Diastolic Blood Pressure (DBP)] based on vital signs were used for developing prediction models using the ensemble method.
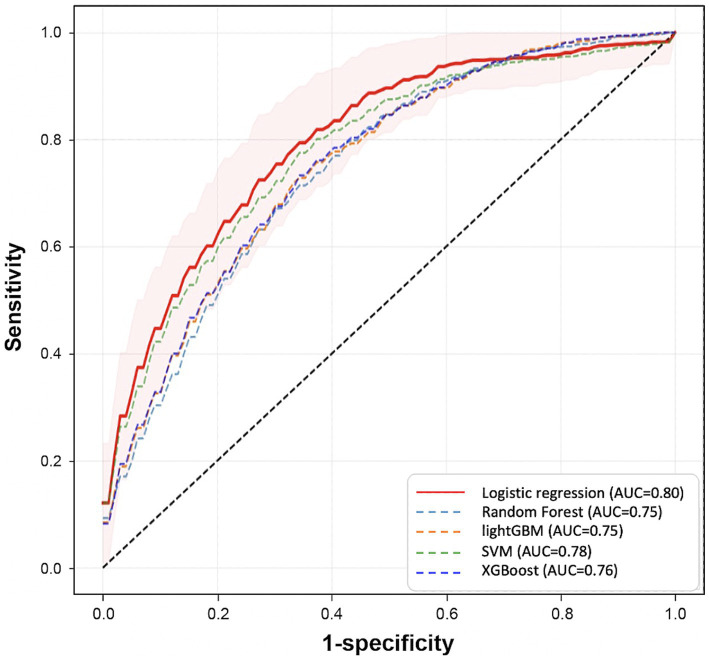
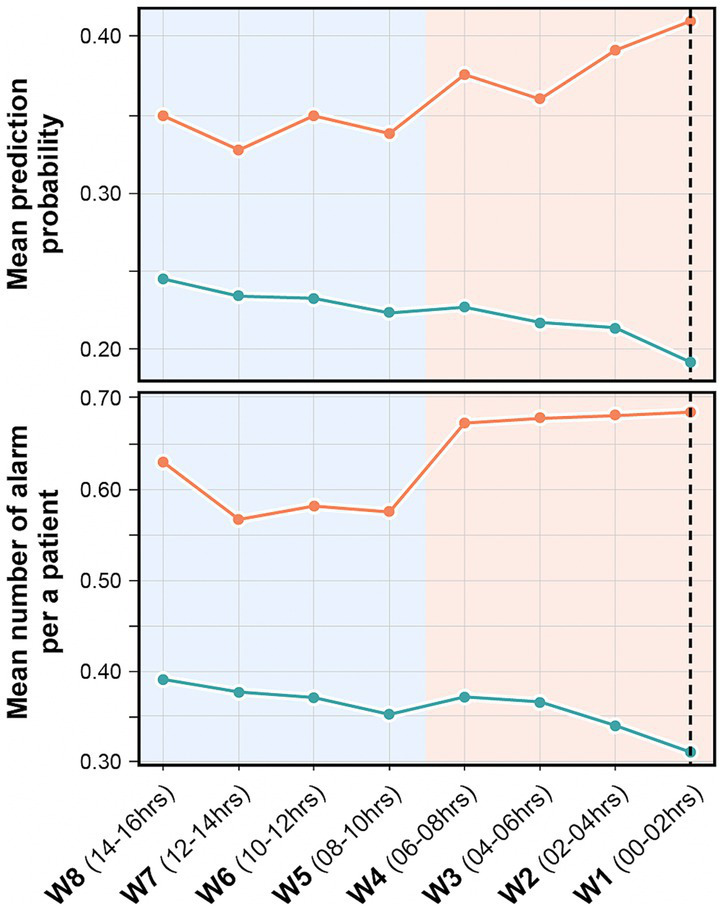
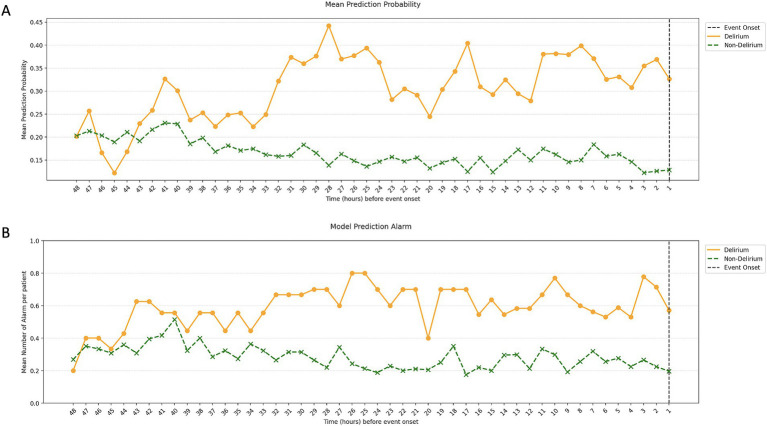
Results: The Area Under the Receiver Operating Characteristic curve (AUROC) for delirium-state classification was 0.80. In simulation-based evaluation, AUROC was 0.71, and the predicted probability increased closer to the time of delirium occurrence. We observed that the patterns of dynamic features, including BT, SpO2, RR, and Heart Rate Variability (HRV) kept changing as the time points were getting closer to the delirium occurrence time. Therefore, the model that employed these patterns showed increasing prediction performance.
Conclusion: Our model can predict the real-time possibility of delirium in patients with ischemic stroke and will be helpful to monitor high-risk patients.
Keywords: delirium; early diagnosis; ischemic stroke; machine learning; vital signs.
Copyright © 2025 Kim, Kim, Kim, Seo, Hong and Yoon.
Conflict of interest statement
HK is the employee of MDHi Corp. MDHi Corp did not have any role in the study design, analysis, decision to publish, or the preparation of the manuscript. There are no patents, products in development, or marketed products to declare. The remaining authors declare that the research was conducted in the absence of any commercial or financial relationships that could be construed as a potential conflict of interest.
Figures
Similar articles
-
Early prediction of delirium upon intensive care unit admission: Model development, validation, and deployment.J Clin Anesth. 2023 Sep;88:111121. doi: 10.1016/j.jclinane.2023.111121. Epub 2023 Apr 12. J Clin Anesth. 2023. PMID: 37058755
-
Circadian rhythms of vital signs are associated with in-hospital mortality in critically ill patients: A retrospective observational study.Chronobiol Int. 2023 Mar;40(3):262-271. doi: 10.1080/07420528.2022.2163656. Epub 2023 Jan 3. Chronobiol Int. 2023. PMID: 36597185
-
Clinical values of cerebral oxygen saturation monitoring in patients with septic shock.Zhong Nan Da Xue Xue Bao Yi Xue Ban. 2021 Nov 28;46(11):1212-1219. doi: 10.11817/j.issn.1672-7347.2021.200905. Zhong Nan Da Xue Xue Bao Yi Xue Ban. 2021. PMID: 34911855 Free PMC article. Chinese, English.
-
ICU admission Braden score independently predicts delirium in critically ill patients with ischemic stroke.Intensive Crit Care Nurs. 2024 Jun;82:103626. doi: 10.1016/j.iccn.2024.103626. Epub 2024 Jan 13. Intensive Crit Care Nurs. 2024. PMID: 38219301 Review.
-
Delirium risk prediction models for intensive care unit patients: A systematic review.Intensive Crit Care Nurs. 2020 Oct;60:102880. doi: 10.1016/j.iccn.2020.102880. Epub 2020 Jul 17. Intensive Crit Care Nurs. 2020. PMID: 32684355
Cited by
-
Predicting ICU Delirium in Critically Ill COVID-19 Patients Using Demographic, Clinical, and Laboratory Admission Data: A Machine Learning Approach.Life (Basel). 2025 Jun 30;15(7):1045. doi: 10.3390/life15071045. Life (Basel). 2025. PMID: 40724546 Free PMC article.
References
-
- American Psychiatric Association D, Association AP (2013). Diagnostic and statistical manual of mental disorders: DSM-5. Washington, DC: American Psychiatric Association.
-
- Barr J., Fraser G. L., Puntillo K., Ely E. W., Gélinas C., Dasta J. F., et al. . (2013). Clinical practice guidelines for the management of pain, agitation, and delirium in adult patients in the intensive care unit. Crit. Care Med. 41, 263–306. doi: 10.1097/CCM.0b013e3182783b72, PMID: - DOI - PubMed
LinkOut - more resources
Full Text Sources