. 2025 Jan 22;9(1):e70073.
doi: 10.1002/hem3.70073. eCollection 2025 Jan.

Somatic mutations and DNA methylation identify a subgroup of poor prognosis within lower-risk myelodysplastic syndromes

Affiliations

Somatic mutations and DNA methylation identify a subgroup of poor prognosis within lower-risk myelodysplastic syndromes

David Rombaut et al. Hemasphere. .

Abstract

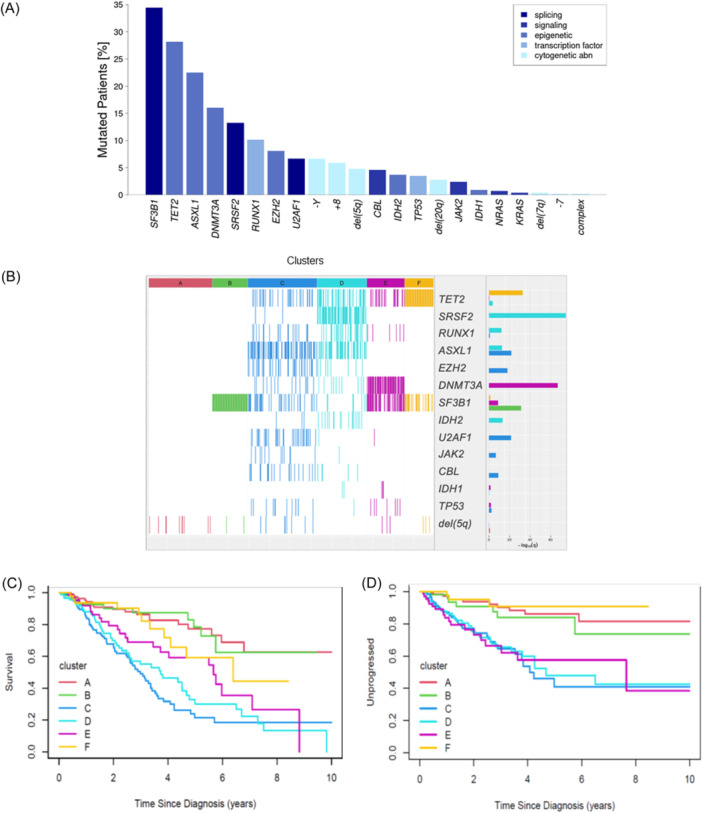
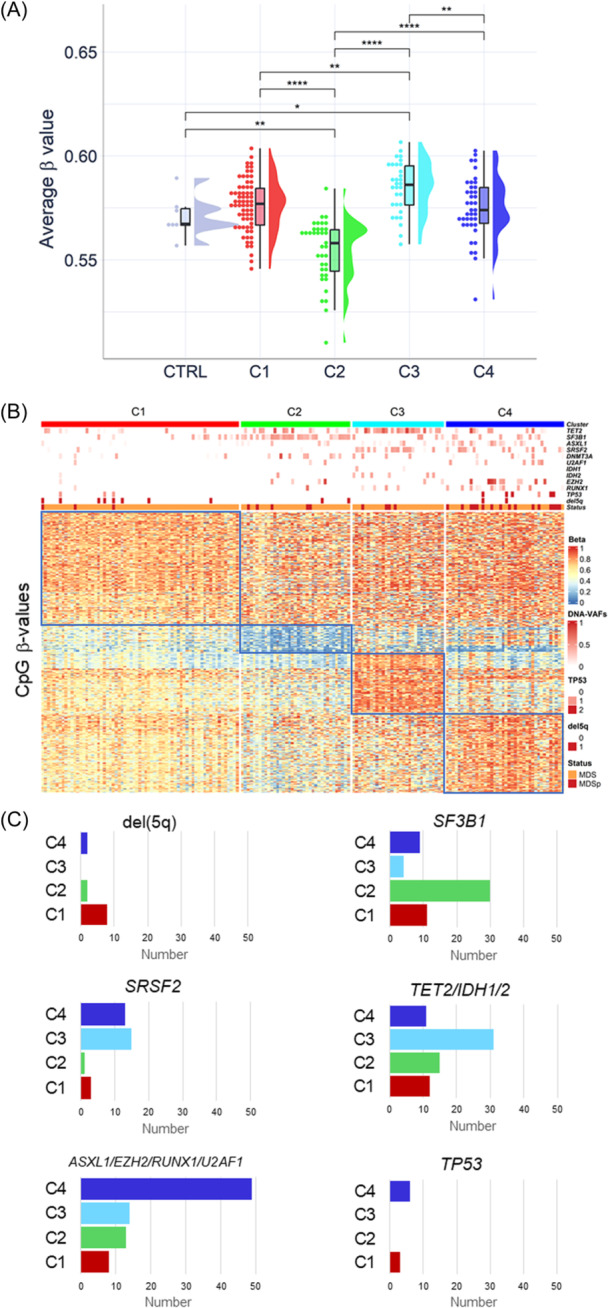
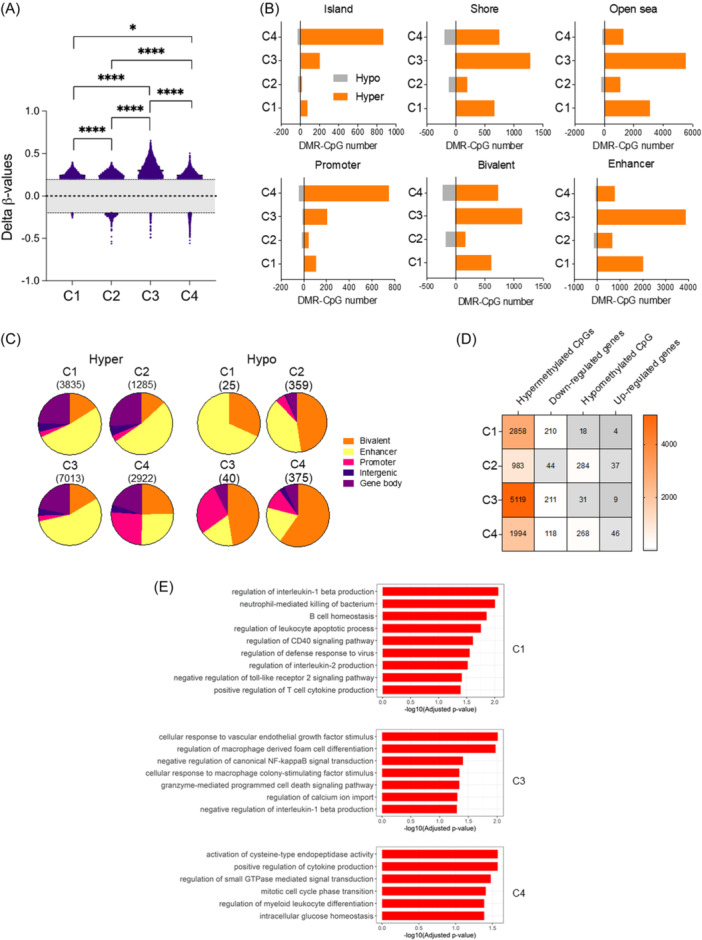
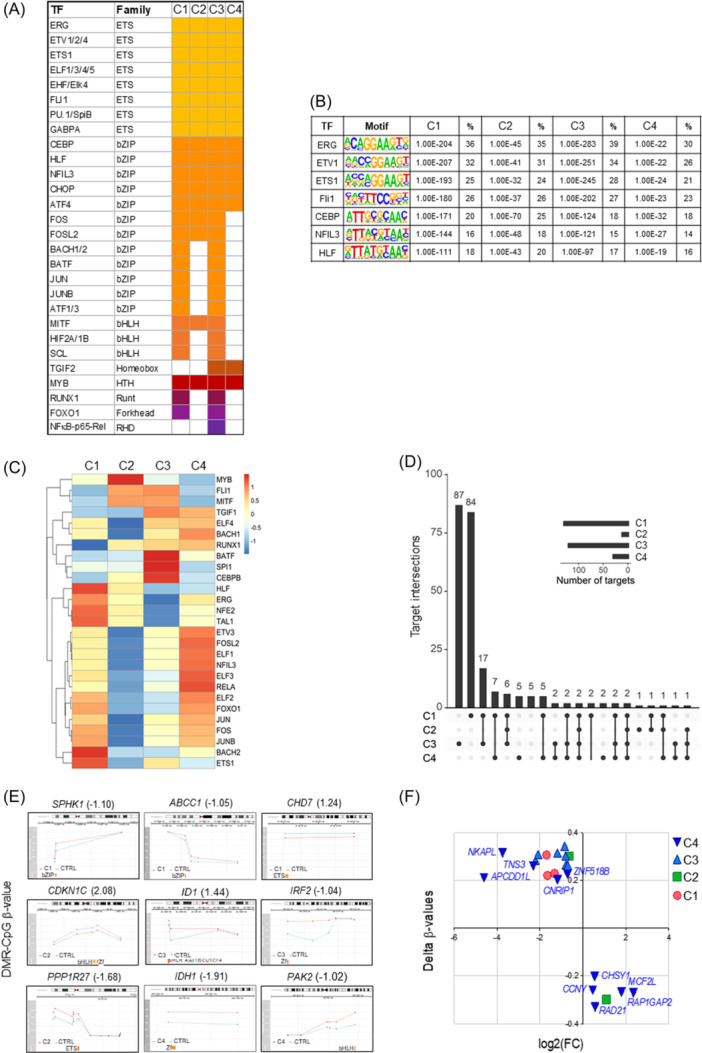
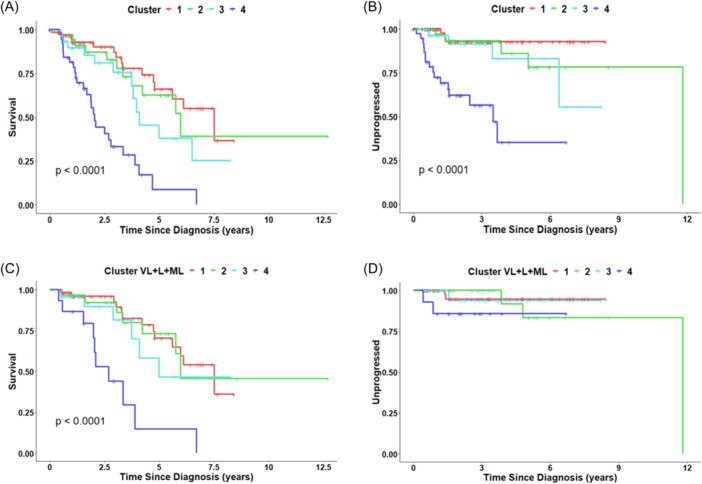
Lower risk (LR) myelodysplastic syndromes (MDS) are heterogeneous hematopoietic stem and progenitor disorders caused by the accumulation of somatic mutations in various genes including epigenetic regulators that may produce convergent DNA methylation patterns driving specific gene expression profiles. The integration of genomic, epigenomic, and transcriptomic profiling has the potential to spotlight distinct LR-MDS categories on the basis of pathophysiological mechanisms. We performed a comprehensive study of somatic mutations and DNA methylation in a large and clinically well-annotated cohort of treatment-naive patients with LR-MDS at diagnosis from the EUMDS registry (ClinicalTrials.gov.NCT00600860). Unsupervised clustering analyses identified six clusters based on genetic profiling that concentrate into four clusters on the basis of genome-wide methylation profiling with significant overlap between the two clustering modes. The four methylation clusters showed distinct clinical and genetic features and distinct methylation landscape. All clusters shared hypermethylated enhancers enriched in binding motifs for ETS and bZIP (C/EBP) transcription factor families, involved in the regulation of myeloid cell differentiation. By contrast, one cluster gathering patients with early leukemic evolution exhibited a specific pattern of hypermethylated promoters and, distinctly from other clusters, the upregulation of AP-1 complex members FOS/FOSL2 together with the absence of hypermethylation of their binding motif at target gene enhancers, which is of relevance for leukemic initiation. Among MDS patients with lower-risk IPSS-M, this cluster displayed a significantly inferior overall survival (p < 0.0001). Our study showed that genetic and DNA methylation features of LR-MDS at early stages may refine risk stratification, therefore offering the frame for a precocious therapeutic intervention.


Conflict of interest statement

The authors declare no conflict of interest.

Figures

Figure 1
Figure 1
Unsupervised genetic clustering and clinical outcomes of the six clusters of lower risk myelodysplastic syndromes (LR‐MDS). (A) Frequency of genetic lesions including somatic mutations and chromosomal anomalies. (B) Heatmap of the genetic clusters. The tightest clusters are A and B, followed by cluster F (mean Jaccard distance 0.25), cluster E (0.50), cluster D (0.57), and finally cluster C (0.81). Cluster tightness is strongly associated with the number of genetic features that determine the clusters. Mutation enrichment is indicated as ‐log10(q). (C) Overall survival of LR‐MDS patients stratified by cluster (p < 0.001). Compared to cluster A, clusters B and F did not show significantly different survival in multivariable analysis (hazard ratio [HR] 0.87, p = 0.72; HR 1.45, p = 0.33, respectively), while C, D, and E showed a significantly worse outcome (HR 4.14, p < 0.001; HR 3.57, p < 0.001; HR 2.54, p = 0.002, respectively). (D) Risk of disease progression analyzed as a composite endpoint of progression into higher‐risk MDS or acute myeloid leukemia (AML). The six clusters showed significantly different time to progression (p < 0.001): clusters B and F did not show significantly different survival compared to cluster A (HR 1.57, p = 0.36; HR 0.78, p = 0.70, respectively), while C, D, and E showed a significantly worse outcome (HR 4.93, p < 0.001; HR 4.47, p < 0.001; HR 4.43, p < 0.001, respectively).
Figure 2
Figure 2
Unsupervised methylation‐based clustering and patterns of genetic lesions. Unsupervised clustering of lower‐risk myelodysplastic syndromes (LR‐MD) was obtained by the K‐means method using the 5000 unique CpGs with the highest standard deviation (SD) of their normalized β‐values and identified 4 clusters. (A) Raincloud plots representing the distribution of average β‐value of samples in the 4 methylation clusters (C1, C2, C3, C4) and controls (CTRL). Box plots show the median ± SD and the whiskers represent the maximal and minimal values. Mann–Whitney test for p‐values (*<0.05, **<0.01, ****<0.0001). (B) Heatmap representing the normalized β‐value of selected CpG (row) including the 500 highest mean CpGs and the 500 lowest mean CpGs from each cluster after removal of CpG duplicates and hierarchical clustering. Columns represent patient samples. Disease and mutation status are indicated. DNA variant allele frequencies (VAFs) are shown as color shades. Presence or absence of del(5q) is indicated by 1 or 0, respectively, and the number of TP53 mutations (0, 1, 2) per patient is indicated by distinct colors. (C) Bar plots representing the number of the indicated mutation or cytogenetic abnormality in each cluster.
Figure 3
Figure 3
Differentially methylated CpGs within differentially methylated regions (DMR‐CpG). DMR‐CpGs were defined as regions containing at least 2 CpGs with delta β >|0.20| and a Benjamini–Hochberg (BH)‐adjusted p < 0.05. (A) Scatter plots representing the delta β‐values of each hypermethylated and hypomethylated DMR‐CpG in clusters C1, C2, C3, and C4 compared to controls. Mann–Whitney test for p‐values. **<0.01; ****<0.0001. (B) Numbers of hypermethylated and hypomethylated DMR‐CpGs in CpG islands, open seas, shores, bivalent enhancers/promoters, enhancers, and promoters. (C) Pie charts showing the proportion of hypermethylated (hyper) or hypomethylated (hypo) DMR‐CpGs at bivalent enhancer and promoter, enhancer, gene body, intergenic region, and promoter identified in the comparisons of C1, C2, C3, and C4 to controls. Total numbers of DMR‐CpGs are indicated in brackets. (D) Heatmap representing the numbers of hypermethylated or hypomethylated individual CpGs near referenced genes and the numbers of downregulated genes close to hypermethylated CpGs and of upregulated genes close to hypomethylated CpGs with log2 fold‐change > |1| and p < 0.05 in each cluster. (E) Gene Ontology analyses of downregulated and upregulated gene sets near hypermethylated and hypomethylated CpGs, respectively, identified in (D). Bar plots showing pathways significantly over‐represented in clusters C1, C3, and C4 compared to controls. No significant terms were found in the comparison of cluster C2 with controls.
Figure 4
Figure 4
Differentially methylated enhancer and promoter gene target expression. (A) Transcription factor (TF) binding motif enrichment analyses within stretches of 125‐bp flanking on both sides of the hypermethylated CpG (delta β‐value >|0.20| and Benjamini–Hochberg (BH)‐adjusted p < 0.05) found in enhancers in the comparison of clusters C1, C2, C3, and C4 to control samples using HOMER. Shared and differential TF families which binding motifs were enriched (q < 10−4) are shown. (B) Major TF binding motifs at hypermethylated enhancers shared between clusters. p‐Values generated using Fischer's exact test with correction for the number of tested TF binding motifs and percentage of target sequences with motif are indicated. (C) Heatmap representing the expression levels shown as DESeq2 normalized counts transformed with a variance stabilizing transformation of transcription factors in each cluster compared to controls. (D) Upset plot showing intersections between clusters of the gene targets of differentially methylated enhancers. (E) Examples of genes with a TF motif (yellow squares) occupying the enhancers with hypermethylated or hypomethylated CpGs within differentially methylated regions (DMR‐CpGs). DMR‐CpG β‐values are shown. Dots represent CpGs. The red line represents the β‐values of CpGs in clusters C1, C2, C3, or C4 and the blue line represents the β‐values of CpGs in controls. The log2 fold‐change (FC) of gene expression between cluster and controls is indicated in brackets. (F) Scatter plots showing differentially expressed genes [log2(FC) >|0.5|; BH‐adjusted p < 0.05] overlapping differentially methylated promoters (delta β > |0.20|; BH‐adjusted p < 0.05) specific to clusters C1, C2, C3, or C4 in comparison with controls. Cluster C4 genes are annotated.
Figure 5
Figure 5
Overall survival and risk of disease progression to acute myeloid leukemia (AML) stratified on methylation clustering. (A) Overall survival (OS) of lower‐risk myelodysplastic syndromes (LR‐MDS) patients stratified on methylation clusters. The four clusters showed significantly different OS (p < 0.0001). (B) Risk of disease progression to AML of LR‐MDS patients stratified on methylation clusters. The four clusters showed significantly different times to AML progression (p < 0.0001). (C) OS of MDS patients with very low (VL), low (L), moderate low (ML) IPSS‐M stratified on methylation clusters (hazard ratio 3.10, 95% CI [1.71–5.63]; p < 0.0001). (D) Risk of AML progression of MDS patients with VL, L, ML IPSS‐M stratified on methylation clusters.

References

    1. de Swart L, Smith A, Johnston TW, et al. Validation of the revised international prognostic scoring system (IPSS‐R) in patients with lower‐risk myelodysplastic syndromes: a report from the prospective European LeukaemiaNet MDS (EUMDS) registry. Br J Haematol. 2015;170(3):372‐383. 10.1111/bjh.13450 - DOI - PubMed
    1. Malcovati L, Hellström‐Lindberg E, Bowen D, et al. Diagnosis and treatment of primary myelodysplastic syndromes in adults: recommendations from the European LeukemiaNet. Blood. 2013;122(17):2943‐2964. 10.1182/blood-2013-03-492884 - DOI - PMC - PubMed
    1. de Witte T, Bowen D, Robin M, et al. Allogeneic hematopoietic stem cell transplantation for MDS and CMML: recommendations from an international expert panel. Blood. 2017;129(13):1753‐1762. 10.1182/blood-2016-06-724500 - DOI - PMC - PubMed
    1. Stojkov K, Silzle T, Stussi G, et al. Guideline‐based indicators for adult patients with myelodysplastic syndromes. Blood Adv. 2020;4(16):4029‐4044. 10.1182/bloodadvances.2020002314 - DOI - PMC - PubMed
    1. Itzykson R, Crouch S, Travaglino E, et al. Early platelet count kinetics has prognostic value in lower‐risk myelodysplastic syndromes. Blood Adv. 2018;2(16):2079‐2089. 10.1182/bloodadvances.2018020495 - DOI - PMC - PubMed

Associated data