. 2024 Dec 21;5(1):28-35.
doi: 10.1021/acsagscitech.4c00170. eCollection 2025 Jan 20.

Investigating the Effect of Syringe Infiltration on Nicotiana tabacum (Tobacco)

Affiliations

Investigating the Effect of Syringe Infiltration on Nicotiana tabacum (Tobacco)

Cyril Routier et al. ACS Agric Sci Technol. .

Abstract

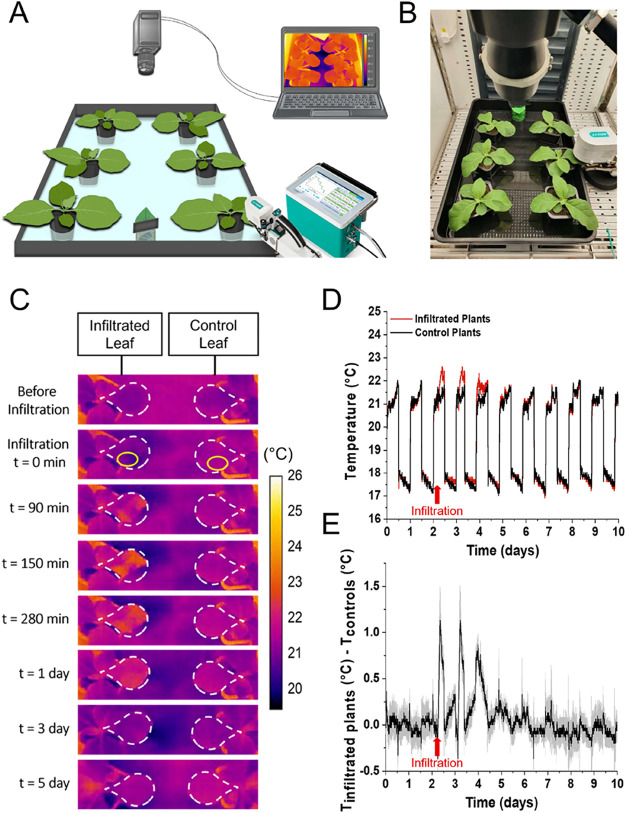
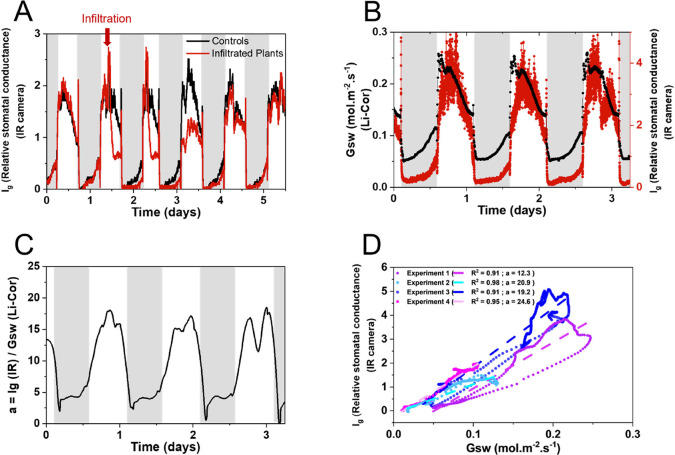
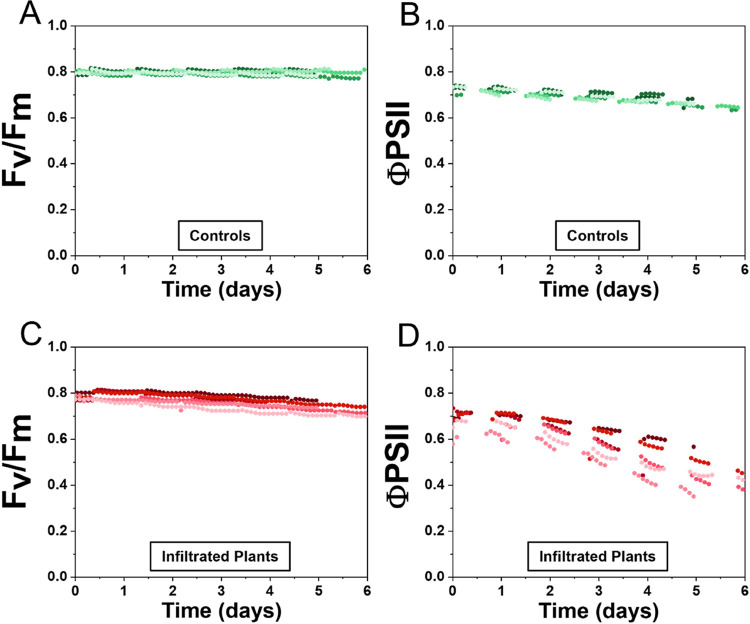
Plant infiltration techniques, particularly agroinfiltration, have transformed plant science and biotechnology by enabling transient gene expression for genetic engineering of plants or genomic studies. Recently, the use of infiltration has expanded to introduce nanomaterials and polymers in plants to enable nonnative functionalities. Despite its wide use, the impact of the infiltration process per se on plant physiology needs to be better understood. This study investigates the effect of syringe infiltration, a commonly employed technique in plants, using a typical infiltration buffer solution. Noninvasive and real-time monitoring methods, including high-resolution thermal imaging and a porometer/fluorometer, were used to study the physiological responses and stress levels of the infiltrated plants. Our results revealed localized cell damage at the infiltration site due to syringe compression, but the overall cell viability and tissue integrity were largely unaffected. Thermography showed a temporary temperature increase of the leaves and stomatal conductance alterations postinfiltration, with leaf recovery in 3-6 days. Additionally, fluorescence measurements indicated a 6% decrease in maximum quantum efficiency (F v/F m) and a 34% decrease in photosystem II (ΦPSII) quantum yield, persisting for 5 days after infiltration, suggesting sustained photosystem efficiency changes. Our work highlights the need to consider the effect of infiltration when performing biological studies and aims to facilitate the optimization of protocols commonly used in plant science and biotechnology.


Conflict of interest statement

The authors declare no competing financial interest.

Figures

Figure 1
Figure 1
Cell viability and structural integrity of Nicotiana tabacum(tobacco) plants after infiltration with a MES buffer. (A) Syringe infiltration process of a tobacco leaf with a MES buffer solution. A 6-week-old tobacco plant is first placed under high luminosity (250 μmol m–2 s–1) to open the stomata. Then, a small incision is made on the abaxial side of the leaf using the tip of a syringe. Using a needleless syringe, the MES buffer solution is gently infiltrated into the leaf’s apoplast by applying pressure and maintaining the syringe at the incision site. Infiltration is stopped when the compartment of the leaf delineated by the veins is fully infiltrated (∼100 μL of buffer solution). (B) Photograph of a tobacco leaf infiltrated with a MES buffer solution with an inset showing the abaxial part of the leaf where the infiltration was performed using a needleless syringe. (C) Confocal microscopy imaging of a control tobacco leaf after staining with propidium iodide, a cationic dye that does not cross intact membranes but binds to cell walls, forming an outline of living cells. Scale bar: 100 μm. (D) Confocal microscopy imaging of a tobacco leaf infiltrated with an MES buffer. From left to right: the point of infiltration where the needleless syringe was in contact with the leaf, inside the circle formed by the pressure of the needleless syringe on the leaf tissue, and 1 mm away from the point of infiltration. Scale bars: 100 μm.
Figure 2
Figure 2
Thermal imaging ofNicotiana tabacum plants after infiltration with a MES buffer. (A) Schematic and (B) photograph of the experimental setup for three infiltrated and three control plants. The six plants are monitored using an infrared camera for thermal imaging, while one control plant is monitored using a portable photosynthesis system (Li-Cor LI-6800). (C) Thermal images of a tobacco leaf before and after infiltration with a MES buffer solution. The leaf on the left is infiltrated while the leaf on the right is a control leaf. The white dashed lines delineate the leaves under study, while the yellow circles represent the region of interest selected for the temperature analysis. (D) Temperature evolution of tobacco leaves after infiltration with a MES buffer solution. The red curve represents the average temperature from three infiltrated plants, and the black curve represents the average temperature from three control plants. (E) Average difference in temperature evolution between the infiltrated plants (n = 3) and the controls (n = 3). The gray outline represents the standard deviation. The red arrow indicates the time point of infiltration.
Figure 3
Figure 3
Relationship between absolute Gsw and relative Igstomatal conductance. (A) Average relative stomatal conductance Ig, calculated from temperature, for control (n = 3) and infiltrated plants (n = 3). (B) Gsw of a control plant and average Ig of control plants (n = 3) over time. (C) Calculated ratio of Ig and Gsw over time with prior smoothing of the data points using the Savitsky-Golay method with a window size of 20 points. (D) Scatter plots for four different experiments of the average relative stomatal conductance Ig of control plants (n = 3) versus the absolute stomatal conductance Gsw, demonstrating the linear proportionality between the two parameters (smoothed data). The dotted lines represent the linear fits for each experiment, with R2 and the proportionality constant (a) values indicated in the legend.
Figure 4
Figure 4
Temporal Evolution of photochemical parameters after infiltration of Nicotiana tabacum with MES buffer. The maximum quantum efficiency Fv/Fm and the quantum yield of PSII (ΦPSII) were determined for controls and plants infiltrated with an MES buffer solution. Each line represents a different plant. Fv/Fm (A) and ΦPSII (B) evolution over 5 or 6 days for control plants without infiltration. Fv/Fm (C) and ΦPSII (D) evolution over 5 or 6 days for tobacco leaves infiltrated with a MES buffer solution.

References

    1. Chincinska I. A. Leaf Infiltration in Plant Science: Old Method, New Possibilities. Plant Methods 2021, 17 (1), 83.10.1186/s13007-021-00782-x. - DOI - PMC - PubMed
    1. Deguchi M.; Bogush D.; Weeden H.; Spuhler Z.; Potlakayala S.; Kondo T.; Zhang Z. J.; Rudrabhatla S. Establishment and Optimization of a Hemp (Cannabis Sativa L.) Agroinfiltration System for Gene Expression and Silencing Studies. Sci. Rep. 2020, 10 (1), 3504.10.1038/s41598-020-60323-9. - DOI - PMC - PubMed
    1. Duc Tien N. Q. Transient Expression of Chi42 Genes from Trichoderma Asperellum in Nicotiana Benthamiana by Agroinfiltration. Int. J. Agric. Biol. 2021, 26 (01), 177–184. 10.17957/IJAB/15.1822. - DOI
    1. Vaghchhipawala Z.; Rojas C. M.; Senthil-Kumar M.; Mysore K. S. Agroinoculation and Agroinfiltration: Simple Tools for Complex Gene Function Analyses. In: Pereira A. (eds) Plant Reverse Genetics. Methods in Molecular Biology; Humana Press: Totowa, NJ, 2011, 678, 65–76. - PubMed
    1. Huafang Lai Q. C.; Jake Stahnke J. H. Agroinfiltration as an Effective and Scalable Strategy of Gene Delivery for Production of Pharmaceutical Proteins. Adv. Technol. Biol. Med. 2013, 1 (1), 103.10.4172/atbm.1000103. - DOI - PMC - PubMed

LinkOut - more resources