. 2025 Jan 9:15:1493991.
doi: 10.3389/fimmu.2024.1493991. eCollection 2024.

Antibiotic-mediated dysbiosis leads to activation of inflammatory pathways

Affiliations

Antibiotic-mediated dysbiosis leads to activation of inflammatory pathways

Jemma J Taitz et al. Front Immunol. .

Abstract

Introduction: The gut microbiota plays a pivotal role in influencing host health, through the production of metabolites and other key signalling molecules. While the impact of specific metabolites or taxa on host cells is well-documented, the broader impact of a disrupted microbiota on immune homeostasis is less understood, which is particularly important in the context of the increasing overuse of antibiotics.

Methods: Female C57BL/6 mice were gavaged twice daily for four weeks with Vancomycin, Polymyxin B, or PBS (control). Caecal microbiota composition was assessed via 16S rRNA sequencing and caecal metabolites were quantified with NMR spectroscopy. Immune profiles of spleen and mesenteric lymph nodes (MLNs) were assessed by flow cytometry, and splenocytes assessed for ex vivo cytokine production. A generalised additive model approach was used to examine the relationship between global antibiotic consumption and IBD incidence.

Results: Antibiotics significantly altered gut microbiota composition, reducing alpha-diversity. Acetate and butyrate were significantly reduced in antibiotic groups, while propionate and succinate increased in Vancomycin and PmB-treated mice, respectively. The MLNs and spleen showed changes only to DC numbers. Splenocytes from antibiotic-treated mice stimulated ex vivo exhibited increased production of TNF. Epidemiological analysis revealed a positive correlation between global antibiotic consumption and IBD incidence.

Discussion: Our findings demonstrate that antibiotic-mediated dysbiosis results in significantly altered short-chain fatty acid levels but immune homeostasis in spleen and MLNs at steady state is mostly preserved. Non-specific activation of splenocytes ex vivo, however, revealed mice with perturbed microbiota had significantly elevated production of TNF. Thus, this highlights antibiotic-mediated disruption of the gut microbiota may program the host towards dysregulated immune responses, predisposing to the development of TNF-associated autoimmune or chronic inflammatory disease.

Keywords: IBD; Polymyxin B; TNF; antibiotics; autoimmunity; dysbiosis; gut microbiota; vancomycin.


Conflict of interest statement

LM is a current employee of the Translational Science Hub Global Sanofi Vaccines R&D Brisbane, Australia. Her contribution to this manuscript was when she was an employee of the University of Sydney. The remaining authors declare that the research was conducted in the absence of any commercial or financial relationships that could be construed as a potential conflict of interest. The author(s) declared that they were an editorial board member of Frontiers, at the time of submission. This had no impact on the peer review process and the final decision.

Figures
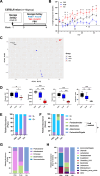
Figure 1
Figure 1
aqr rid="aq1" boffset="10"/>Administration of Polymyxin B or vancomycin significantly alters microbiota composition, eliminating to a G+ or G- taxa. (A) Diagram of experimental set up. C57BL/6 mice were gavaged amphotericin B (Amph B) (1mg/mL) 1 week prior to commencing 2x daily gavages of vancomycin (Van) (5mg/mL), Polymyxin B (PmB) (7.5mg/mL), or PBS, for 4 weeks (n=10 mice per group). (B) Bodyweight as percent of baseline weight, using mixed-effects model with Geisser-Greenhouse correction, followed by Tukey’s multiple comparisons test. * indicates differences between Van and PmB, † between Van and PBS, # between PmB and PBS (C) Differences in microbiota composition shown as principal component analysis (PCA) of Aitchison distance. (D) Alpha diversity measures of microbiota composition, showing richness (observed ASV), Evenness, Shannon Diversity index and Inverse Simpson index. (E) Phyla and genera were classified as gram-positive (G+) or gram-negative (G-) and relative abundance was graphed for phyla (E) and genera (F), also indicating PmB-resistant and susceptible strains. (G) Relative abundance of bacteria at phyla level (H) and genus level (top 10 genera). Data are represented as mean ± SEM. *p<0.05, **<0.01, ***0.001, ****<0.0001, , †<0.05, ††<0.01, #<0.05, ##<0.01, by ordinary one-way ANOVA followed by Tukey’s multiple comparisons test.
Figure 2
Figure 2
Antibiotic-shifted microbiota have significantly altered metabolite profiles (A) Ratios and total amounts of SCFAs (acetate, butyrate and propionate) in caecal content, as quantified by nuclear magnetic resonance (NMR) spectroscopy. (B, C) Concentrations of acetate, propionate, butyrate, and succinate in caecal content. (D) Levels of sIgA in small intestinal content, as quantified by ELISA. (E) Correlation between metabolites, sIgA level, and 16S genera results. Data are represented as mean ± SEM with **p<0.01, ***0.001, ****<0.0001 by ordinary one-way ANOVA followed by Tukey’s multiple comparisons test.
Figure 3
Figure 3
Dendritic cells in mesenteric lymph nodes are mainly impacted by antibiotics-induced dysbiosis (A) Total cellularity of the mesenteric lymph nodes (MLNs). (B) Absolute cell numbers of eosinophils, neutrophils, migratory conventional dendritic cells (mig cDC), resident cDC (res cDC), plasmacytoid dendritic cells (pDC), Natural Killer T cells (NKT) and Natural Killer cells (NK), and Ly6Chi monocytes were quantified by flow cytometry. (C) Numbers of migratory and resident cDC1 (CD11b- CD8+) and cDC2 (CD11b+CD8-) subsets (D) and fold change across groups. Data are represented as mean ± SEM with *p<0.05, **<0.01, ***0.001, ****<0.0001 by ordinary one-way ANOVA followed by Tukey’s multiple comparisons test.
Figure 4
Figure 4
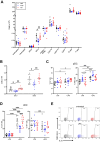
Perturbed microbiota has minimal impact on spleen immune composition (A) Absolute cell numbers of innate and adaptive cell subsets in the spleen, including eosinophils, neutrophils, plasmacytoid dendritic cells (pDCs), conventional dendritic cells (cDCs), putative red pulp macrophage (RPMs), monocyte subsets (Ly6Chi,Ly6Cmid Ly6Cneg), B cells and T cells as quantified by flow cytometry. (B) Numbers of cDC1 (CD11b- CD8+) and cDC2 (CD11b+CD8-) subsets in the spleen. (C) Expression of IL-6 and TNF in pDCs stimulated with lipopolysaccharide (LPS) for 48 hours in vitro, as quantified by flow cytometry. (D) Expression of IL-6 and TNF in cDCs stimulated with LPS for 48 hours in vitro, as quantified by flow cytometry and (E) representative plots of proportions of IL-6 expressing cells in LPS-stimulated and unstimulated cDCs. Data are represented as mean ± SEM with *p<0.05, **<0.01, ***0.001, ****<0.0001 by ordinary one-way ANOVA followed by Tukey’s multiple comparisons test or repeated measures two-way ANOVA followed by Tukey’s multiple comparisons test.
Figure 5
Figure 5
Adaptive splenocytes from antibiotics-shifted microbiota shifted mice show greater cytokine expression under stimulation conditions. Splenocytes were stimulated with PMA/ionomycin/BFA for 4 hours and cytokine expression was quantified by flow cytometry. (A) IL-17 expression in TCRγδ+, CD4+ and CD8+ T cells (B) IL-10 expression in Tregs, CD4+ and CD8+ T cells. (C) IFN-γ expression in NK cells, B cells, and TCRγδ+, CD4+ and CD8+ T cells (D) TNF expression in NK cells, B cells, TCRγδ+ T cells, FoxP3+ Tregs and CD4+ and CD8+ T cell subsets. Data are represented as mean ± SEM with *p<0.05, **<0.01, ***0.001, ****<0.0001 by ordinary one-way ANOVA followed by Tukey’s multiple comparisons test.
Figure 6
Figure 6
Global IBD incidence increases with increasing antibiotics consumption for median GDP. Global antibiotic consumption data, as Defined Daily Doses per 1000 inhabitants per day (DDD/1000 inhabitants/day) for 2018, was collected along with age-standardised incidence rates of irritable bowel disease (IBD) and data of gross domestic product (GDP). A generalised additive model was used to examine the relationship between antibiotic consumption, GDP and IBD incidence, with results for the year 2018 and median GDP presented.

Similar articles

Cited by

  • Absence of gut microbiota restoration following meropenem treatment in a systemic infection model.
    Ribeiro FM, Ribeiro CFA, de Souza Cândido E, Buccini DF, Cardoso MH, Greice de Oliveira Silva Silveira G, de Souza CM, Silva ON, de Andrade GB, da Silva AR, da Mota FB, Makimoto SS, Dos Santos Ferreira R, de Oliveira NC, de Castro AP, Carvalho CME, de la Fuente-Nunez C, Franco OL. Ribeiro FM, et al. NPJ Antimicrob Resist. 2025 Jun 30;3(1):60. doi: 10.1038/s44259-025-00129-9. NPJ Antimicrob Resist. 2025. PMID: 40588535 Free PMC article.

References

    1. Kennedy EA, King KY, Baldridge MT. Mouse microbiota models: comparing germ-free mice and antibiotics treatment as tools for modifying gut bacteria. Front Physiol. (2018) 9:1534. doi: 10.3389/fphys.2018.01534 - DOI - PMC - PubMed
    1. Tan J, Taitz J, Sun SM, Langford L, Ni D, Macia L. Your regulatory T cells are what you eat: how diet and gut microbiota affect regulatory T cell development. Front Nutr. (2022) 9. doi: 10.3389/fnut.2022.878382 - DOI - PMC - PubMed
    1. Ivanov II, Atarashi K, Manel N, Brodie EL, Shima T, Karaoz U, et al. . Induction of intestinal Th17 cells by segmented filamentous bacteria. Cell. (2009) 139:485–98. doi: 10.1016/j.cell.2009.09.033 - DOI - PMC - PubMed
    1. Ekmekciu I, von Klitzing E, Fiebiger U, Escher U, Neumann C, Bacher P, et al. . Immune responses to broad-spectrum antibiotic treatment and fecal microbiota transplantation in mice. Front Immunol. (2017) 8:397. doi: 10.3389/fimmu.2017.00397 - DOI - PMC - PubMed
    1. Khosravi A, Yáñez A, Price JG, Chow A, Merad M, Goodridge HS, et al. . Gut microbiota promote hematopoiesis to control bacterial infection. Cell Host Microbe. (2014) 15:374–81. doi: 10.1016/j.chom.2014.02.006 - DOI - PMC - PubMed

LinkOut - more resources