

Measuring Speech Discrimination Ability in Sleeping Infants Using fNIRS-A Proof of Principle
- PMID: 39850978
- PMCID: PMC11758514
- DOI: 10.1177/23312165241311721
Measuring Speech Discrimination Ability in Sleeping Infants Using fNIRS-A Proof of Principle
Abstract
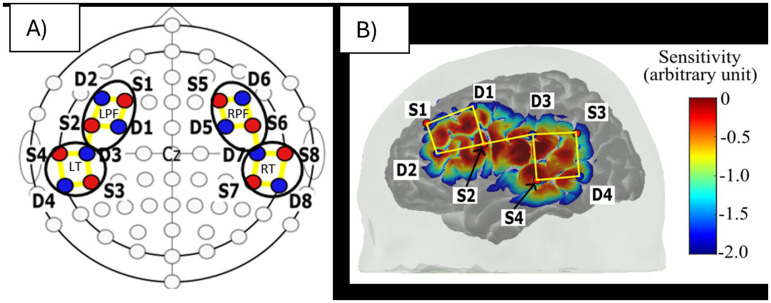
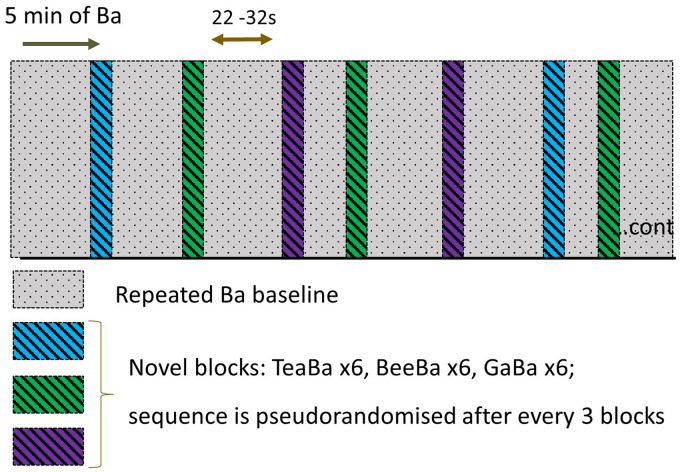
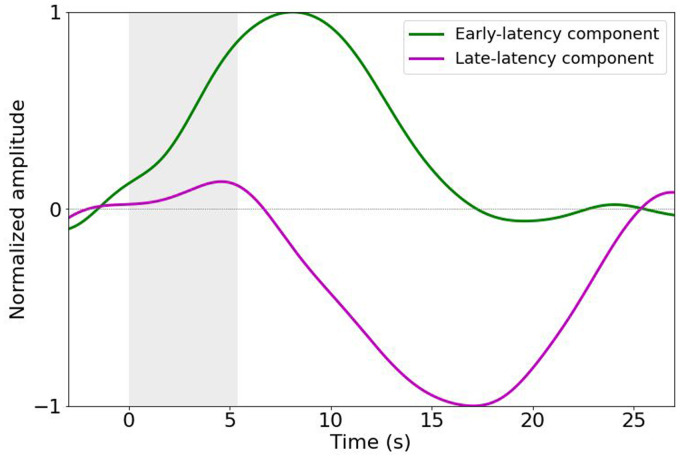
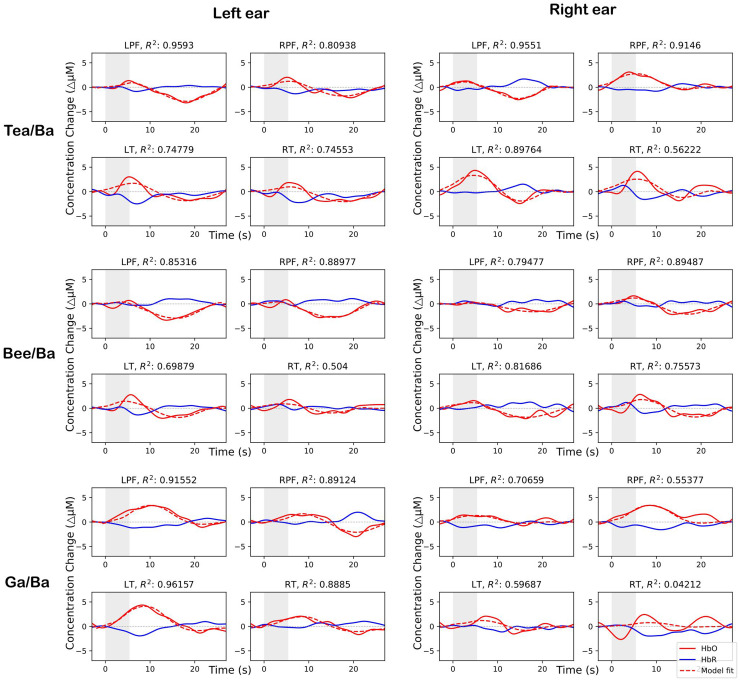
This study used functional near-infrared spectroscopy (fNIRS) to measure aspects of the speech discrimination ability of sleeping infants. We examined the morphology of the fNIRS response to three different speech contrasts, namely "Tea/Ba," "Bee/Ba," and "Ga/Ba." Sixteen infants aged between 3 and 13 months old were included in this study and their fNIRS data were recorded during natural sleep. The stimuli were presented using a nonsilence baseline paradigm, where repeated standard stimuli were presented between the novel stimuli blocks without any silence periods. The morphology of fNIRS responses varied between speech contrasts. The data were fit with a model in which the responses were the sum of two independent and concurrent response mechanisms that were derived from previously published fNIRS detection responses. These independent components were an oxyhemoglobin (HbO)-positive early-latency response and an HbO-negative late latency response, hypothesized to be related to an auditory canonical response and a brain arousal response, respectively. The goodness of fit of the model with the data was high with median goodness of fit of 81%. The data showed that both response components had later latency when the left ear was the test ear (p < .05) compared to the right ear and that the negative component, due to brain arousal, was smallest for the most subtle contrast, "Ga/Ba" (p = .003).
Keywords: arousal; fNIRS; infant; sleep; speech discrimination.
Conflict of interest statement
Declaration of Conflicting InterestsThe authors declared the following potential conflicts of interest with respect to the research, authorship, and/or publication of this article: A patent application has been submitted related to the contents of this paper (IP Australia 2022901011). The authors may obtain financial benefit from future use of that patent in a commercial device.
Figures
Similar articles
-
Speech token detection and discrimination in individual infants using functional near-infrared spectroscopy.Sci Rep. 2021 Dec 14;11(1):24006. doi: 10.1038/s41598-021-03595-z. Sci Rep. 2021. PMID: 34907273 Free PMC article. Clinical Trial.
-
Decoding four different sound-categories in the auditory cortex using functional near-infrared spectroscopy.Hear Res. 2016 Mar;333:157-166. doi: 10.1016/j.heares.2016.01.009. Epub 2016 Jan 29. Hear Res. 2016. PMID: 26828741
-
The Use of Heart Rate Responses Extracted From Functional Near-Infrared Spectroscopy Data as a Measure of Speech Discrimination Ability in Sleeping Infants.Ear Hear. 2023 Jul-Aug 01;44(4):776-786. doi: 10.1097/AUD.0000000000001325. Epub 2023 Jan 14. Ear Hear. 2023. PMID: 36706073
-
Pain Induced Changes in Brain Oxyhemoglobin: A Systematic Review and Meta-Analysis of Functional NIRS Studies.Pain Med. 2021 Jun 4;22(6):1399-1410. doi: 10.1093/pm/pnaa453. Pain Med. 2021. PMID: 33659994
-
A Review of Functional Near-Infrared Spectroscopy Studies of Motor and Cognitive Function in Preterm Infants.Neurosci Bull. 2020 Mar;36(3):321-329. doi: 10.1007/s12264-019-00441-1. Epub 2019 Nov 12. Neurosci Bull. 2020. PMID: 31713716 Free PMC article. Review.
References
-
- Arimitsu T., Minagawa Y., Yagihashi T., M O. U., Matsuzaki A., Ikeda K., Takahashi T. (2018). The cerebral hemodynamic response to phonetic changes of speech in preterm and term infants: The impact of postmenstrual age. Neuroimage: Clinical, 19, 599–606. 10.1016/j.nicl.2018.05.005 - DOI - PMC - PubMed
-
- Boersma P. (2001). Praat, a system for doing phonetics by computer. Glot International, 5(9/10), 341–345. https://www.fon.hum.uva.nl/paul/papers/speakUnspeakPraat_glot2001.pdf
MeSH terms
Substances
LinkOut - more resources
Full Text Sources
