. 2024 Dec 27;12(1):11.
doi: 10.3390/bioengineering12010011.

Exploring the Potential Imaging Biomarkers for Parkinson's Disease Using Machine Learning Approach

Affiliations

Exploring the Potential Imaging Biomarkers for Parkinson's Disease Using Machine Learning Approach

Illia Mushta et al. Bioengineering (Basel). .

Abstract

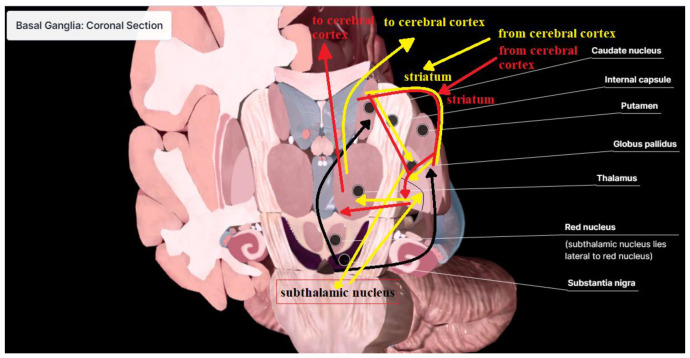
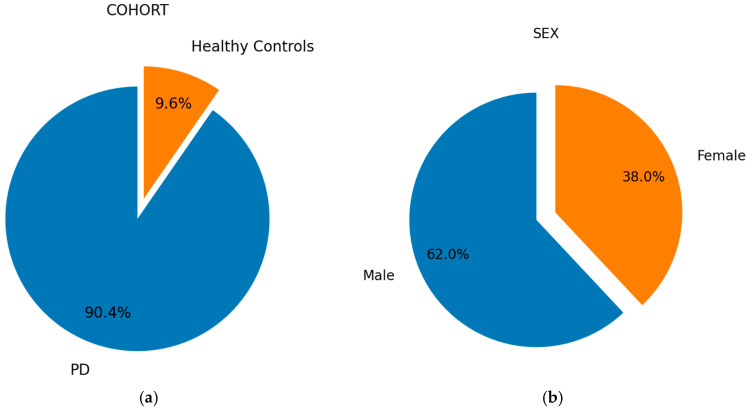
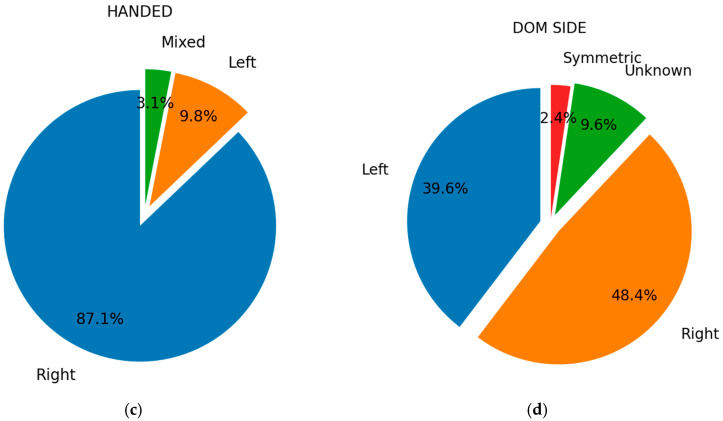
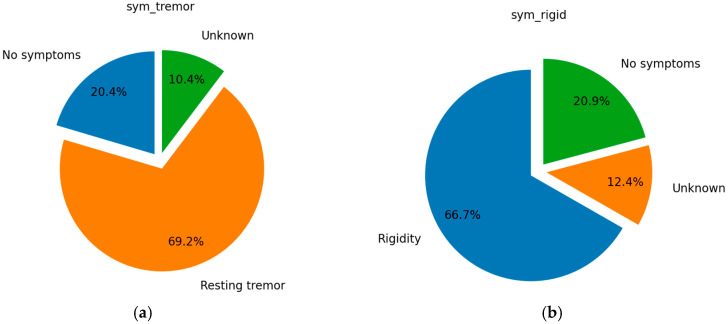
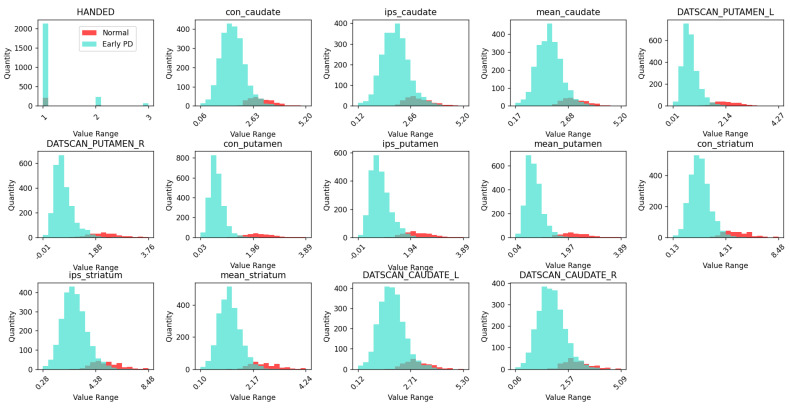
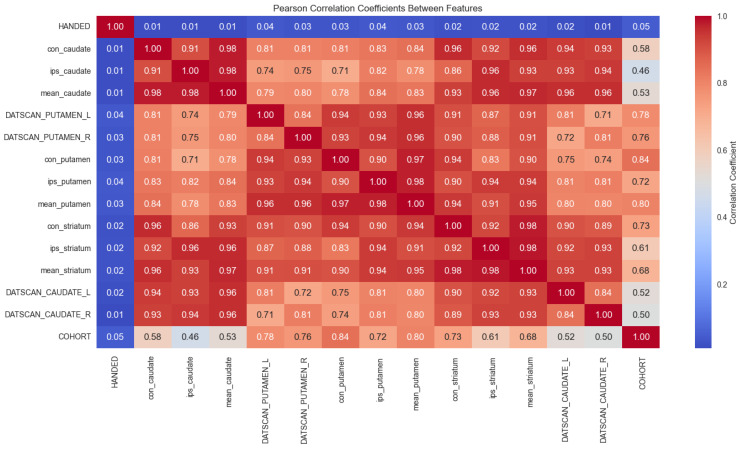
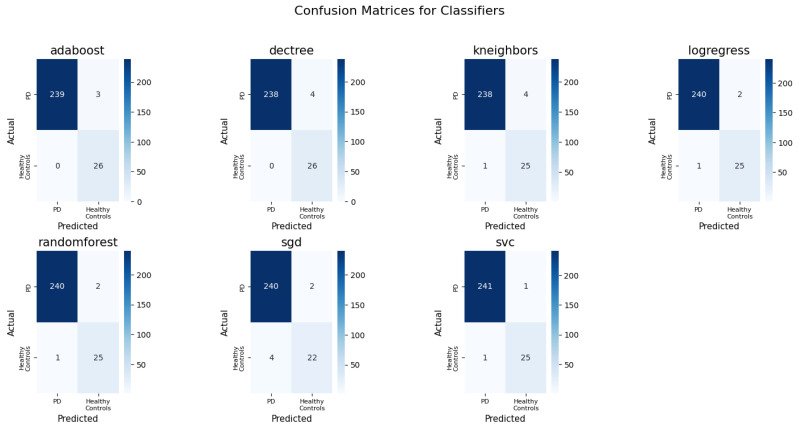
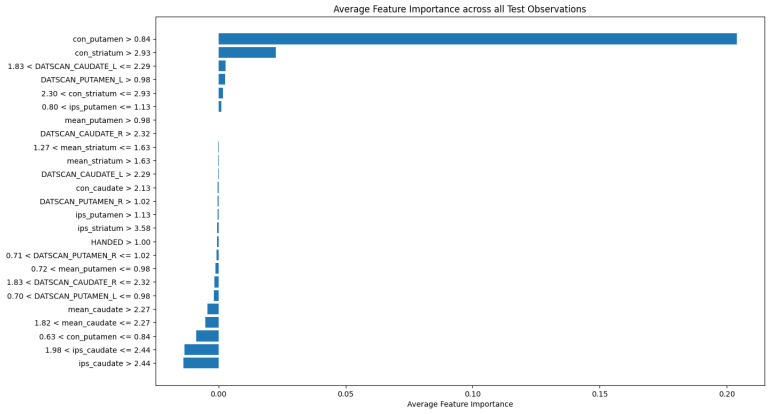
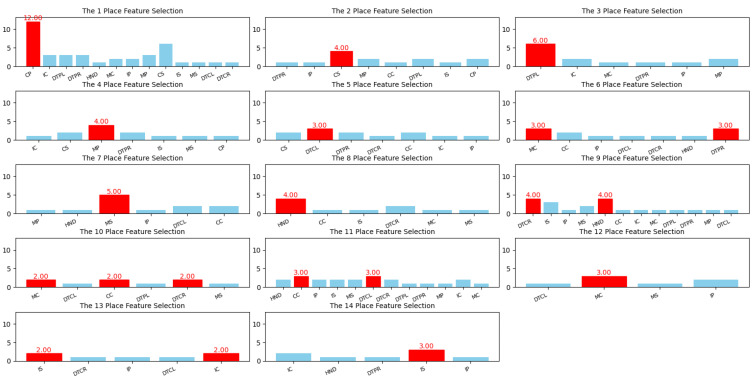
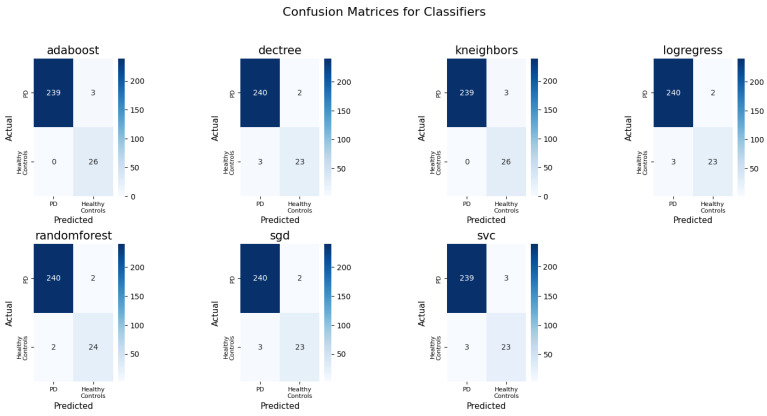
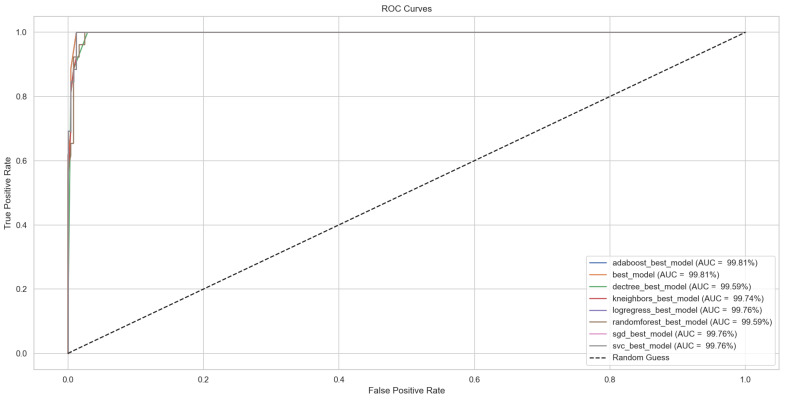
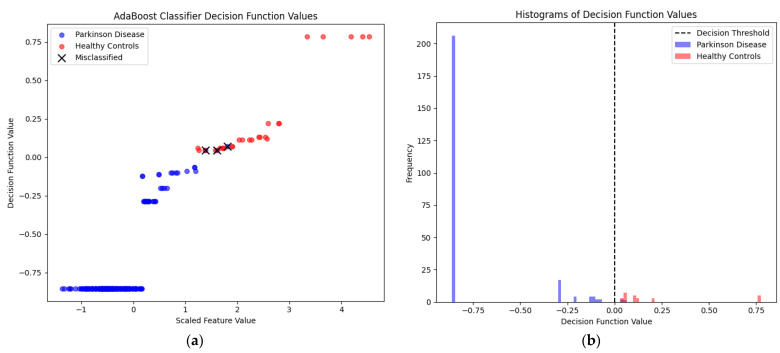
Parkinson's disease (PD) is a neurodegenerative disorder characterized by motor and neuropsychiatric symptoms resulting from the loss of dopamine-producing neurons in the substantia nigra pars compacta (SNc). Dopamine transporter scan (DATSCAN), based on single-photon emission computed tomography (SPECT), is commonly used to evaluate the loss of dopaminergic neurons in the striatum. This study aims to identify a biomarker from DATSCAN images and develop a machine learning (ML) algorithm for PD diagnosis. Using 13 DATSCAN-derived parameters and patient handedness from 1309 individuals in the Parkinson's Progression Markers Initiative (PPMI) database, we trained an AdaBoost classifier, achieving an accuracy of 98.88% and an area under the receiver operating characteristic (ROC) curve of 99.81%. To ensure interpretability, we applied the local interpretable model-agnostic explainer (LIME), identifying contralateral putamen SBR as the most predictive feature for distinguishing PD from healthy controls. By focusing on a single biomarker, our approach simplifies PD diagnosis, integrates seamlessly into clinical workflows, and provides interpretable, actionable insights. Although DATSCAN has limitations in detecting early-stage PD, our study demonstrates the potential of ML to enhance diagnostic precision, contributing to improved clinical decision-making and patient outcomes.

Keywords: AdaBoost; DATSCAN; Parkinson’s disease; basal ganglia; classification; machine learning.


Conflict of interest statement

The authors declare no conflicts of interest.

Figures

Figure 1
Figure 1
Direct pathway (red), indirect pathway (yellow), and nigrostriatal pathway (black).
Figure 2
Figure 2
The distribution of key demographic and clinical characteristics of the participants: (a) cohort at enrollment; (b) sex at birth; (c) handedness; (d) side most affected at PD symptom onset.
Figure 2
Figure 2
The distribution of key demographic and clinical characteristics of the participants: (a) cohort at enrollment; (b) sex at birth; (c) handedness; (d) side most affected at PD symptom onset.
Figure 3
Figure 3
The participants’ symptom profiles and treatment statuses distribution: (a) initial symptom (at diagnosis)—resting tremor; (b) initial symptom (at diagnosis)—rigidity; (c) initial symptom (at diagnosis)—bradykinesia; (d) initial symptom (at diagnosis)—postural instability.
Figure 3
Figure 3
The participants’ symptom profiles and treatment statuses distribution: (a) initial symptom (at diagnosis)—resting tremor; (b) initial symptom (at diagnosis)—rigidity; (c) initial symptom (at diagnosis)—bradykinesia; (d) initial symptom (at diagnosis)—postural instability.
Figure 4
Figure 4
The participants’ age at enrollment in the PPMI project.
Figure 5
Figure 5
The duration from PD diagnosis to enrollment in the PPMI project.
Figure 6
Figure 6
The ML process.
Figure 7
Figure 7
Histograms of features. HANDED 1—right, 2—left, 3—mixed. The rest of the values are unitless SBRs.
Figure 8
Figure 8
The Pearson correlation coefficients. HANDED 1—right, 2—left, 3—mixed. COHORT 1—healthy controls, 0—PD. The rest of the values are unitless SBRs.
Figure 9
Figure 9
Confusion matrices for classifiers trained on all features and computed on a test set.
Figure 10
Figure 10
Feature importances using the LIME method.
Figure 11
Figure 11
The distribution of feature importances.
Figure 12
Figure 12
Confusion matrices for classifiers trained on con_putamen feature and computed on test set.
Figure 13
Figure 13
ROC curves for the models along with AUC scores.
Figure 14
Figure 14
AdaBoost classifier decision function values: (a) decision function values for PD and healthy controls observations for single con_putamen feature; (b) histograms of decision function values for PD and healthy controls observations for single con_putamen feature.

Similar articles

Cited by

References

    1. Alshammri R., Alharbi G., Alharbi E., Almubark I. Machine Learning Approaches to Identify Parkinson’s Disease Using Voice Signal Features. Front. Artif. Intell. 2023;6:1084001. doi: 10.3389/frai.2023.1084001. - DOI - PMC - PubMed
    1. Kozyolkin O., Revenko A., Medvedkova S. Parkinson’s Disease: Current Aspects of Diagnosis and Treatment. Zaporizhzhia State Medical University; Zaporizhzhia, Ukraine: 2017.
    1. Tolosa E., Garrido A., Scholz S.W., Poewe W. Challenges in the Diagnosis of Parkinson’s Disease. Lancet Neurol. 2021;20:385–397. doi: 10.1016/S1474-4422(21)00030-2. - DOI - PMC - PubMed
    1. Lima M., Fachin-Martins E., Delattre A., Proença M., Mori M., Carabelli B., Ferraz A. Motor and Non-Motor Features of Parkinson’s Disease—A Review of Clinical and Experimental Studies. CNS Neurol. Disord. Drug Targets. 2012;11:439–449. doi: 10.2174/187152712800792893. - DOI - PubMed
    1. Symptoms|Parkinson’s Disease. [(accessed on 25 September 2024)]. Available online: https://www.michaeljfox.org/symptoms.

Grants and funding

LinkOut - more resources