. 2025 Jan 10;14(2):92.
doi: 10.3390/cells14020092.

Traumatic Brain Injury Promotes Neurogenesis and Oligodendrogenesis in Subcortical Brain Regions of Mice

Affiliations

Traumatic Brain Injury Promotes Neurogenesis and Oligodendrogenesis in Subcortical Brain Regions of Mice

Olga Astakhova et al. Cells. .

Abstract

Traumatic brain injury (TBI) is one of the major causes of severe neurological disorders and long-term dysfunction in the nervous system. Besides inducing neurodegeneration, TBI alters stem cell activity and neurogenesis within primary neurogenic niches. However, the fate of dividing cells in other brain regions remains unclear despite offering potential targets for therapeutic intervention. Here, we investigated cell division and differentiation in non-neurogenic brain regions during the acute and delayed phases of TBI-induced neurodegeneration. We subjected mice to lateral fluid percussion injury (LFPI) to model TBI and analyzed them 1 or 7 weeks later. To assess cellular proliferation and differentiation, we administered 5-ethinyl-2'-deoxyuridine (EdU) and determined the number and identity of dividing cells 2 h later using markers of neuronal precursors and astro-, micro-, and oligodendroglia. Our results demonstrated a significant proliferative response in several brain regions at one week post-injury that notably diminished by seven weeks, except in the optic tract. In addition to active astro- and microgliosis, we detected oligodendrogenesis in the striatum and optic tract. Furthermore, we observed trauma-induced neurogenesis in the striatum. These findings suggest that subcortical structures, particularly the striatum and optic tract, may possess a potential for self-repair through neuronal regeneration and axon remyelination.

Keywords: adult neurogenesis; brain trauma; cell proliferation; fluid percussion injury; gliosis; oligonendrogenesis; optic tract; striatum; substantia nigra; thalamus.


Conflict of interest statement

The authors declare no conflicts of interest. The funders had no role in the design of the study; in the collection, analyses, or interpretation of data; in the writing of the manuscript; or in the decision to publish the results.

Figures

Figure 1
Figure 1
Lateral fluid percussion injury model. (a) Experimental impact force in mice with traumatic brain injury with a target force of 2 atm (n = 19). One-sample t-test, p = 0.17. (b) Left and right righting reflex recovery (RR) (n = 18). Wilcoxon test, ns—p = 0.5. (a,b) Data are presented as mean ± SEM.
Figure 2
Figure 2
Principle of cell division analysis in the brain after TBI. (a) Scheme of experiment. At 1 or 7 weeks after LFPI, mice were injected with EdU; brains were collected 2 h after injection. (b) The levels for analyzing the density of EdU-labeled cells in the injured hemisphere: lateral level (orange), medial level (purple). The red spot indicates the lesion site. (c) Analyzed structures at the medial level. The purple lines outline the analyzed structures: M2—secondary motor cortex; FrA—frontal association cortex; CPu—striatum; Tha—thalamus; SN—substantia nigra; Tectum. The blue line circles the optic tract (Opt) that partially enters the medial level. (d) Analyzed structures at the lateral level. The orange lines outline the analyzed structures: S1—somatosensory cortex, Ins—insular cortex; Pir—piriform cortex; Ent—entorhinal cortex; CPu—striatum. (c,d) Representative pictures show the distribution of EdU+ cells (white) at both levels 1 week (1 w) after TBI. Red arrowheads indicate the lesion site. The scale bar is 1000 µm.
Figure 3
Figure 3
Traumatic brain injury leads to an extensive increase in cell divisions in the injured hemisphere 1 week after injury. (a) EdU+ cell density at the medial level 1 and 7 weeks after LFPI. (b) EdU+ cell density at the lateral level 1 and 7 weeks after LFPI. (c) EdU+ cell density in the optic tract 1 and 7 weeks after LFPI. (d) Comparison of EdU+ cell numbers in the striatum at both levels 1 week after TBI. Two-way ANOVA. Factor “Level”: ns—p = 0.8543; factor “Impact”: p < 0.0001; interaction: p = 0.1713 (n = 6 for each group). (e) Representative images of EdU+ (white) cells in the thalamus (Tha) after 1 week in the “Sham” and “Trauma” groups. The dotted line indicates the boundaries of the thalamus. The white arrowhead indicates an increase in EdU+ cells in the dorsal part of the striatum after TBI. The scale bar is 300 µm. (f) Representative images of EdU+ (white) cells in the optic tract (Opt) at 1 and 7 weeks after TBI in “Sham” and “Trauma” groups. The scale bar is 100 µm. The dotted line indicates the boundaries of the optic tract. (ac) One-way ANOVA, Tukey’s post-hoc test. *—p < 0.5, **—p < 0.01, ***—p < 0.001. Data are presented as mean ± SEM (n = 6 for each group).
Figure 4
Figure 4
LFPI changed the differentiation pathways of newly formed cells in subcortical brain structures. The figure shows the results of phenotyping EdU+ cells with either the marker GFAP (green column), Olig2 (blue column), or Iba1 (pink column) combined with Nestin-GFP. EdU+/Nestin/X cells—light gray column; EdU+/Nestin+/X cells—dark gray column; EdU+/Nestin/X cells—light green/blue/pink column; EdU+/Nestin+/X cells—dark green/blue column; X—one of the specific markers GFAP, Olig2 or Iba1. Phenotyping was performed in the striatum, substantia nigra, and thalamic nuclei at 1 week after LFPI and in the optic tract at 1 and 7 weeks after injury. Abbreviations: CPu—striatum, SN—substantia nigra, Tha—thalamus, LD—laterodorsal thalamic nucleus, LP—lateral posterior thalamic nucleus, V—ventral thalamic nucleus, Opt—optic tract, IC – Intact Control, Sh – Sham, Tr - Trauma. One-way ANOVA, Tukey’s post-hoc test. *—p < 0.5, **—p < 0.01, ***—p < 0.001, ****—p < 0.0001, EdU+/Nestin/X cell differences; #—p < 0.5, EdU+/Nestin+/X cell differences; ^—p < 0.5, ^^—p < 0.01, ^^^—p < 0.001, ^^^^—p < 0.0001, EdU+/Nestin/X+ cell differences; +—p < 0.5, ++—p < 0.01, +++—p < 0.001, EdU+/Nestin+/X+ cell differences. Data are presented as mean ± SEM (n = 6 for each group).
Figure 5
Figure 5
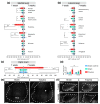
Traumatic brain injury induced irregular gliosis in the brain. (a,a′,a″) Representative images show colocalization of EdU-labeled cells with a combination of GFAP (a) or Olig2 (a′) or Iba1 (a″) and Nestin-GFP markers in the striatum 1 week after LFPI. Solid box: cell in the dashed box at higher magnification. i—EdU+/Nestin/X cells; ii—EdU+/Nestin+/X cells; iii—EdU+/Nestin/X+ cells; iv—EdU+/Nestin+/X+ cells; where X is one of the specific markers: GFAP, Olig2, or Iba1. (a) White arrowheads indicate hypertrophied GFAP-positive cells. (a′) White arrowheads indicate EdU+/Nestin+ cells, all of which colocalize with Olig2. (a″) White arrowheads indicate EdU+/Nestin/Iba1+ cells located near the rostral migratory stream (RMS). (b) Representative images show active irregular thalamic microgliosis seven weeks post-injury. The laterodorsal nucleus (LD), lateral posterior nucleus (LP), and ventral nucleus (V) of the thalamus are indicated by the dotted line. The white box is bounded by the fragment, represented on the right at higher magnification in three separate channels. Filled arrowheads indicate the presence of marker expression in the cell. Empty arrowheads indicate the absence of marker expression in the cell. (c) EdU+/Nestin-GFP+/Olig2+ OPCs in the optic tract 7 weeks after LFPI. The dashed line indicates the optic tract (Opt). White arrowheads point to EdU+/NestinGFP+/Olig2+ cells. The white box bounds the cell shown below at higher magnification in three separate channels.
Figure 6
Figure 6
LFPI leads to different dynamics of total GFAP and Iba1 expression in the thalamus and striatum. (a,d) Representative images show the dynamics of GFAP expression in astrocytes (a) and Iba1 expression in microglia (d). Dotted lines indicate the thalamus (Tha) and striatum (CPu). Yellow solid lines show increased GFAP (a) and Iba1 (d) expression levels. Yellow arrowheads indicate local GFAP (a) and Iba1 (d) overexpression in the thalamus. Red asterisks indicate the lesion site. The scale bar is 500 mm. (b,c) Density of GFAP-labeled cells in the thalamus (b) and striatum (c). (e,f) Density of Iba1-labeled cells in the thalamus (e) and striatum (f). (b) Two-way ANOVA. Factor “Week”: p = 0.0968; factor “Impact”: p < 0.0001; interaction: p = 0.1113. (c) Two-way ANOVA. Factor “Week”: p < 0.0001; factor “Impact”: p = 0.0004; interaction: p = 0.0005. (e) Two-way ANOVA. Factor “Week”: p = 0.6545; factor “Impact”: p < 0.0001; interaction: p = 0.8939. (f) Two-way ANOVA. Factor “Week”: p < 0.0001; factor “Impact”: p < 0.0001; interaction: <0.0001. (b,c,e,f) Tukey’s post-hoc test. *—p < 0.05, ***—p < 0.001, ****—p < 0.0001. Data are presented as mean ± SEM (n = 6 for each group). (g,h) Representative images show no visible differences in the number of GFAP+ and Iba1+ cells in the substantia nigra (g) and optic tract (h) one week after LFPI. The dashed line indicates the optic tract. Abbreviations: IC—“Intact Control”, Sh—“Sham”, Tr—“Trauma”. The scale bar is 100 µm. (i) Representative images show the different distribution patterns of GFAP-positive cells in the striatum of the “Sham” and “Trauma” groups one week after TBI. The scale bar is 300 µm.
Figure 7
Figure 7
TBI induced the formation of new neural precursors in the striatum 7 weeks after injury near the SVZ. (a) Representative images show DCX expression in the regions close to the impact site. The red asterisk indicates the lesion site. The dotted box is represented at a larger magnification on the right. Abbreviations: DG—dentate gyrus, Tha—Thalamus, CPu—striatum. (b) The number of DCX-labeled cells in “Intact Control” (IC), “Sham” (Sh), and “Trauma” (Tr) groups. One-way ANOVA, Tukey’s post-hoc test. **—p < 0.01 (n = 6 for each group). (c) Representative images show DCX-positive cells in the striatum. The graph is signed CPu—striatum, SVZ—subventricular zone, LV—lateral ventricle. The white dotted line indicates the SVZ boundaries. Yellow arrowheads indicate DCX+ cell bodies.

Similar articles

Cited by

References

    1. Maas A.I.R., Menon D.K., Adelson P.D., Andelic N., Bell M.J., Belli A., Bragge P., Brazinova A., Büki A., Chesnut R.M., et al. Traumatic Brain Injury: Integrated Approaches to Improve Prevention, Clinical Care, and Research. Lancet Neurol. 2017;16:987–1048. doi: 10.1016/S1474-4422(17)30371-X. - DOI - PubMed
    1. Blennow K., Brody D.L., Kochanek P.M., Levin H., McKee A., Ribbers G.M., Yaffe K., Zetterberg H. Traumatic Brain Injuries. Nat. Rev. Dis. Primers. 2016;2:16084. doi: 10.1038/nrdp.2016.84. - DOI - PubMed
    1. Dehghanian F., Soltani Z., Khaksari M. Can Mesenchymal Stem Cells Act Multipotential in Traumatic Brain Injury? J. Mol. Neurosci. 2020;70:677–688. doi: 10.1007/s12031-019-01475-w. - DOI - PubMed
    1. Das M., Mayilsamy K., Mohapatra S.S., Mohapatra S. Mesenchymal Stem Cell Therapy for the Treatment of Traumatic Brain Injury: Progress and Prospects. Rev. Neurosci. 2019;30:839–855. doi: 10.1515/revneuro-2019-0002. - DOI - PubMed
    1. Pavlovic D., Pekic S., Stojanovic M., Popovic V. Traumatic Brain Injury: Neuropathological, Neurocognitive and Neurobehavioral Sequelae. Pituitary. 2019;22:270–282. doi: 10.1007/s11102-019-00957-9. - DOI - PubMed

Publication types

LinkOut - more resources