

Gene-Environment Interaction: Small Deletions (DELs) and Transcriptomic Profiles in Non-Melanoma Skin Cancer (NMSC) and Potential Implications for Therapy
- PMID: 39851523
- PMCID: PMC11764317
- DOI: 10.3390/cells14020095
Gene-Environment Interaction: Small Deletions (DELs) and Transcriptomic Profiles in Non-Melanoma Skin Cancer (NMSC) and Potential Implications for Therapy
Abstract
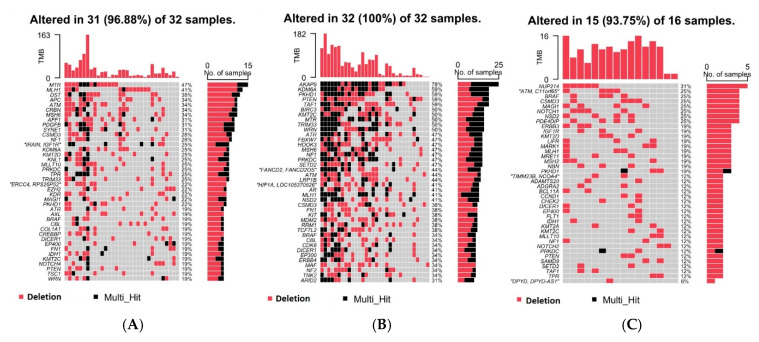
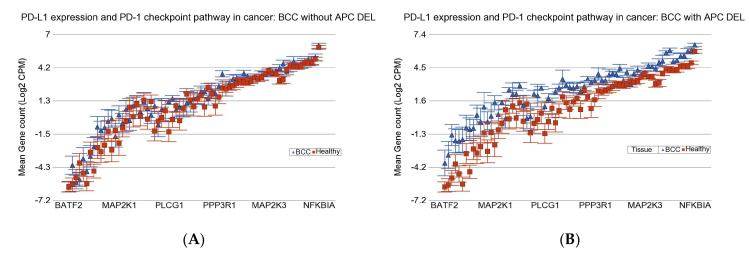
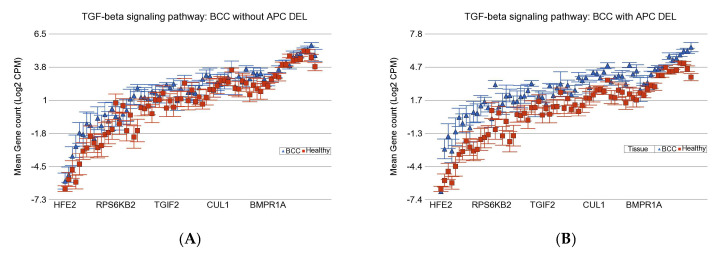
Arsenic (As) is a risk factor for non-melanoma skin cancer (NMSC). From a six-year follow-up study on 7000 adults exposed to As, we reported the associations of single-nucleotide variation in tumor tissue and gene expression. Here, we identify the associations of small deletions (DELs) and transcriptomic profiles in NMSC. Comparing the (a) NMSC tissue (n = 32) and corresponding blood samples from each patient, and (b) an independent set of non-lesional, healthy skin (n = 16) and paired blood, we identified NMSC-associated DELs. Differential expressions of certain gene pathways (TGF-β signaling pathway, IL-17 pathway, PD-L1 pathway, etc.) showed significant interactions with these somatic DELs and As exposure. In low-As-exposure cases, the DELs in APC were associated with the up-regulation of inflamed T-Cell-associated genes by a fold change (FC) of 8.9 (95% CI 4.5-17.6), compared to 5.7 (95% CI 2.9-10.8) without APC DELs; in high-As-exposure cases, the APC DELs were associated with an FC of 5.8 (95% CI 3.5-9.8) compared to 1.2 (95% CI -1.3 to 1.8) without APC DELs. We report, for the first time, the significant associations of somatic DELs (many in STR regions) in NMSC tissue and As exposure with many dysregulated gene pathways. These findings may help in selecting groups of patients for potential targeted therapy like PD-L1 inhibitors, IL-17 inhibitors, and TGF-β inhibitors in the future.
Trial registration: ClinicalTrials.gov NCT00392561.
Keywords: IL-17 signaling; TGF-β signaling; arsenic; basal-cell carcinoma; gene–environment interaction; immune checkpoint inhibitors; non-melanoma skin cancer; short tandem repeat; small deletion; somatic mutation.
Conflict of interest statement
The authors declare no conflicts of interest. The funders had no role in the design of the study; in the collection, analyses, or interpretation of data; in the writing of the manuscript; or in the decision to publish the results.
Figures


Similar articles
-
Short Tandem Repeat (STR) Somatic Mutation in Non-Melanoma Skin Cancer (NMSC): Association with Transcriptomic Profile and Potential Implications for Therapy.Cancers (Basel). 2025 May 15;17(10):1669. doi: 10.3390/cancers17101669. Cancers (Basel). 2025. PMID: 40427167 Free PMC article.
-
Molecular Profiling and the Interaction of Somatic Mutations with Transcriptomic Profiles in Non-Melanoma Skin Cancer (NMSC) in a Population Exposed to Arsenic.Cells. 2024 Jun 18;13(12):1056. doi: 10.3390/cells13121056. Cells. 2024. PMID: 38920684 Free PMC article.
-
Polymorphisms in nucleotide excision repair genes, arsenic exposure, and non-melanoma skin cancer in New Hampshire.Environ Health Perspect. 2007 Aug;115(8):1231-6. doi: 10.1289/ehp.10096. Environ Health Perspect. 2007. PMID: 17687452 Free PMC article.
-
Immune Checkpoints and Cellular Landscape of the Tumor Microenvironment in Non-Melanoma Skin Cancer (NMSC).Cells. 2024 Sep 26;13(19):1615. doi: 10.3390/cells13191615. Cells. 2024. PMID: 39404378 Free PMC article. Review.
-
UV-Induced Molecular Signaling Differences in Melanoma and Non-melanoma Skin Cancer.Adv Exp Med Biol. 2017;996:27-40. doi: 10.1007/978-3-319-56017-5_3. Adv Exp Med Biol. 2017. PMID: 29124688 Review.
Cited by
-
Short Tandem Repeat (STR) Somatic Mutation in Non-Melanoma Skin Cancer (NMSC): Association with Transcriptomic Profile and Potential Implications for Therapy.Cancers (Basel). 2025 May 15;17(10):1669. doi: 10.3390/cancers17101669. Cancers (Basel). 2025. PMID: 40427167 Free PMC article.
References
-
- Jasmine F., Argos M., Khamkevych Y., Islam T., Rakibuz-Zaman M., Shahriar M., Shea C.R., Ahsan H., Kibriya M.G. Molecular Profiling and the Interaction of Somatic Mutations with Transcriptomic Profiles in Non-Melanoma Skin Cancer (NMSC) in a Population Exposed to Arsenic. Cells. 2024;13:1056. doi: 10.3390/cells13121056. - DOI - PMC - PubMed
-
- Fitzmaurice C., Abate D., Abbasi N., Abbastabar H., Abd-Allah F., Abdel-Rahman O., Abdelalim A., Abdoli A., Abdollahpour I., Abdulle A.S.M., et al. Global, Regional, and National Cancer Incidence, Mortality, Years of Life Lost, Years Lived With Disability, and Disability-Adjusted Life-Years for 29 Cancer Groups, 1990 to 2017: A Systematic Analysis for the Global Burden of Disease Study. JAMA Oncol. 2019;5:1749–1768. doi: 10.1001/jamaoncol.2019.2996. - DOI - PMC - PubMed
Publication types
MeSH terms
Substances
Associated data
Grants and funding
LinkOut - more resources
Full Text Sources
Medical
Research Materials
