. 2025 Jan 17;14(2):137.
doi: 10.3390/cells14020137.

Derivation and Characterization of Isogenic OPA1 Mutant and Control Human Pluripotent Stem Cell Lines

Affiliations

Derivation and Characterization of Isogenic OPA1 Mutant and Control Human Pluripotent Stem Cell Lines

Katherine A Pohl et al. Cells. .

Abstract

Dominant optic atrophy (DOA) is the most commonly inherited optic neuropathy. The majority of DOA is caused by mutations in the OPA1 gene, which encodes a dynamin-related GTPase located to the mitochondrion. OPA1 has been shown to regulate mitochondrial dynamics and promote fusion. Within the mitochondrion, proteolytically processed OPA1 proteins form complexes to maintain membrane integrity and the respiratory chain complexity. Although OPA1 is broadly expressed, human OPA1 mutations predominantly affect retinal ganglion cells (RGCs) that are responsible for transmitting visual information from the retina to the brain. Due to the scarcity of human RGCs, DOA has not been studied in depth using the disease affected neurons. To enable studies of DOA using stem-cell-derived human RGCs, we performed CRISPR-Cas9 gene editing to generate OPA1 mutant pluripotent stem cell (PSC) lines with corresponding isogenic controls. CRISPR-Cas9 gene editing yielded both OPA1 homozygous and heterozygous mutant ESC lines from a parental control ESC line. In addition, CRISPR-mediated homology-directed repair (HDR) successfully corrected the OPA1 mutation in a DOA patient's iPSCs. In comparison to the isogenic controls, the heterozygous mutant PSCs expressed the same OPA1 protein isoforms but at reduced levels; whereas the homozygous mutant PSCs showed a loss of OPA1 protein and altered mitochondrial morphology. Furthermore, OPA1 mutant PSCs exhibited reduced rates of oxygen consumption and ATP production associated with mitochondria. These isogenic PSC lines will be valuable tools for establishing OPA1-DOA disease models in vitro and developing treatments for mitochondrial deficiency associated neurodegeneration.

Keywords: CRISPR-Cas9 editing; OPA1 gene; dominant optic atrophy; isogenic human pluripotent stem cell lines; mitochondria.


Conflict of interest statement

The authors declare no conflicts of interest.

Figures
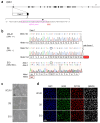
Figure 1
Figure 1
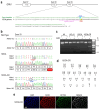
Generation of OPA1 heterozygous and homozygous mutants isogenic to the WT ESC line UCLA1. (a) Schematic drawing of the human OPA1 gene, which contains 31 exons (exon 1-29, 4b, and 5b). The exons are represented as boxes with protein-coding regions shaded in black. Partial sequence of exon 1 is enlarged to show the ATG translation initiation codon (green), the guide RNA (magenta box), the PAM site (red underline), and the potential CAS9 cleavage site (black arrowhead). (b) Alignments of the genomic DNA and predicted protein sequences of the control UCLA1 and the two CRISPR-Cas9 edited OPA1 mutant ESC lines. The control UCLA1 (OPA1+/+) ESC line shows identical DNA sequences for both alleles. The UCLA1-D9 ESC (OPA1−/−) contains a single-base C insertion (boxed) in both alleles, resulting in a frame shift and early stop after 11 amino acids. The UCLA1-E10 ESC (OPA1 R5H/-) has a G > A missense mutation (boxed), resulting in Arg-to-His change (grey shaded box) in allele 1, whereas the allele 2 has a 16-base deletion, which is replaced by a 3-base-pair insertion (3 Cs between the two asterisks), disrupting the ATG start codon. (c) Brightfield images show that E10 and D9 display normal pluripotent stem cell morphology comparable to the control UCLA1 ESC line from which they were derived. Scale bar, 500 μm. (d) Immunofluorescent labeling of UCLA1, E10, and D9 ESC lines for pluripotent stem cell markers SOX2, OCT3/4, NANOG, and nuclear dye DAPI. Scale bar, 50 μm.
Figure 2
Figure 2
CRISPR-Cas9 mediated correction of the OPA1 mutation in a DOA iPSC line 1iDOA. (a) Schematic drawing depicting the region of the 1iDOA genome carrying a G insertion (yellow highlight) in OPA1 exon19, the sgRNA_exon19 (underlined in magenta), and the PAM site (underlined in red) absent in the wild-type allele. The 124-nucleotide single-stranded HDR donor template (green) removes the G insertion and introduces a silent T > C mutation (blue highlight), which creates a BstBI restriction site (blue overline) on the edited allele. Uppercase letters in the 1iDOA genome (black text) indicate the sequence of OPA1 exon19 whereas lowercase letters represent intronic sequences. (b) Alignments of partial OPA1 exon19 genomic DNA and predicted protein sequences of the wild-type control, the mutant 1iDOA, and the CRISPR-HDR corrected 1iDOA-CR. DNA sequences for both OPA1 alleles are shown above of Sanger sequencing profiles. The allele 2 of 1iDOA contains a G insertion (boxed), which leads to a premature stop codon. DNA sequencing confirmed the T > C replacement (boxed) and the BstBI site (blue underline) in 1iDOA-CR. Both alleles of 1iDOA-CR encode the wild-type OPA1 protein sequence. Amino acids that differ from the WT protein are shaded in grey. (c) Gel image shows the presence of the BstBI site in the 1iDOA-CR iPSC line. A 704 bp PCR fragments spanning the area of CRISPR HDR targeting were incubated with or without BstBI and resolved by electrophoresis. Only 1iDOA-CR iPSCs show both the expected 704 bp and two additional bands at 436 and 268 bp, indicating the presence of the novel BstBI site. (d) The 1iDOA-CR iPSCs displays a normal male karyotype after undergoing CRISPR-Cas9 gene editing. (e) Immunofluorescent labeling of 1iDOA-CR iPSCs with pluripotent stem cell markers SOX2, OCT3/4, NANOG, and nuclei dye DAPI. Scale bar, 30 μm.
Figure 3
Figure 3
Characterization of OPA1 protein expression in control and mutant PSC lines. (a) Western blots showing OPA1 protein expression. The left panel shows the WT control ESC lines H9 and UCLA1, the OPA1 heterozygous mutant ESC line E10, and the OPA1 homozygous mutant ESC line D9. The right panel shows the WT control ESC lines H9 and UCLA1, the DOA patients’ iPSC lines 1iDOA and 2iDOA, and the CRISPR corrected iPSC line 1iDOA-CR. All PSC lines except OPA1 homozygous mutant D9 express OPA1 protein isoforms (~80-100kDa). GAPDH was used as a loading control. Numbers indicate molecular weight marker in kDa. (b) Immunofluorescent confocal images show co-labeling for mitochondrial marker TOM20 and OPA1 in parental ESC UCLA1, and isogenic OPA1 mutant ESCs E10 and D9. Scale bar, 20 μm. (c) Confocal images show co-labeling for TOM20 and OPA1 in control H9 ESCs, DOA patient-derived 1iDOA, and isogenic 1iDOA-CR iPSCs. Scale bar, 10 μm.
Figure 4
Figure 4
Super-resolution imaging of mitochondria in WT and OPA1 mutant PSCs. (a) Merged SIM images of ESC lines UCLA1, E10, and D9 co-labeled for the mitochondrial marker TOM20, OPA1, and nuclear dye DAPI. The insets are 3x in scale. Scale bars, 5 μm. (b) Merged SIM images of iPSC lines 1iDOA-CR, 1iDOA, and 2iDOA co-labeled for the mitochondrial marker TOM20, OPA1, and nuclear dye DAPI. Scale bars, 5 μm.
Figure 5
Figure 5
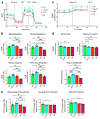
Cellular bioenergetics of normal control and OPA1 mutant ESCs. The control ESC line H9, the parental ESC UCLA1, and UCLA1-derived OPA1 mutant ESC lines E10 and D9 were subjected to Seahorse cellular respiration analysis. (a) Tracings of OCRs under normal cellular respiration and respiratory chain perturbation conditions are shown. Vertical lines indicate the times of inhibitor applications. (b) Bar graphs show quantifications of basal and maximal OCRs, mitochondrial reserve capacities, as well as OCRs linked to ATP production. (c) Tracings of ECAR under normal cellular respiration, inhibiting ATP synthase (oligomycin), and uncoupling conditions (FCCP) are shown. (d) Bar graphs present quantifications of basal ECAR and ECAR under ATP synthase inhibition. The ratios of OCR/ECAR reflect relative participation of mitochondrial respiration versus cellular glycolysis. (e) ATP production rates due to mitochondrial respiration, glycolysis, and total cellular ATP production are presented. n = 5 replicates per ESC line. Bar graphs show each n as a separate data point, which are presented as mean values +/− SEM. Adjusted p-values were obtained from one-way ANOVA and Tukey all-pairs test. * p < 0.05, ** p < 0.005, *** p < 0.0005, **** p < 0.0001.
Figure 6
Figure 6
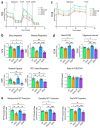
Bioenergetic characterization of control ESC, DOA patients’ iPSC lines, and CRISPR-HDR corrected iPSC line. The control ESC line H9, DOA mutant iPSC lines 1iDOA and 2iDOA, and the CRISPR HDR-corrected iPSC line 1iDOA-CR were subjected to Seahorse cellular respiration analysis. (a) Tracings of OCRs under normal cellular respiration and perturbation conditions are shown. Vertical lines indicate times of inhibitor applications. (b) Bar graphs present quantifications of basal and maximal OCRs, mitochondrial reserve capacities, as well as OCRs linked to ATP production. (c) Tracings of ECAR under normal cellular respiration, inhibiting ATP synthase (oligomycin), or uncoupling (FCCP) conditions are shown. (d) Bar graphs present quantifications of basal ECAR and ECAR under ATP synthase-inhibited conditions. The ratios of OCR/ECAR reflect relative participation of mitochondria respiration versus cellular glycolysis. (e) ATP production rates due to mitochondrial respiration, glycolysis, and total cellular ATP production are presented. n = 5 replicates per cell line. Bar graphs show each n as a separate data point, which are presented as mean values +/− SEM. Adjusted p-values were obtained from one-way ANOVA and Tukey all-pairs test. * p < 0.05, ** p < 0.005, *** p < 0.0005, **** p < 0.0001.

Similar articles

References

    1. Kjer B., Eiberg H., Kjer P., Rosenberg T. Dominant optic atrophy mapped to chromosome 3q region. II. Clinical and epidemiological aspects. Acta Ophthalmol. Scand. 1996;74:3–7. doi: 10.1111/j.1600-0420.1996.tb00672.x. - DOI - PubMed
    1. Yu-Wai-Man P., Griffiths P.G., Chinnery P.F. Mitochondrial optic neuropathies-disease mechanisms and therapeutic strategies. Prog. Retin. Eye Res. 2011;30:81–114. doi: 10.1016/j.preteyeres.2010.11.002. - DOI - PMC - PubMed
    1. Yu-Wai-Man P., Griffiths P.G., Burke A., Sellar P.W., Clarke M.P., Gnanaraj L., Ah-Kine D., Hudson G., Czermin B., Taylor R.W., et al. The prevalence and natural history of dominant optic atrophy due to OPA1 mutations. Ophthalmology. 2010;117:1538–1546.e1. doi: 10.1016/j.ophtha.2009.12.038. - DOI - PMC - PubMed
    1. Yu-Wai-Man P., Chinnery P.F. Reply: Sensorineural hearing loss in OPA1-linked disorders. Brain. 2013;136:e237. doi: 10.1093/brain/aws341. - DOI - PMC - PubMed
    1. Kjer P. Infantile optic atrophy with dominant mode of inheritance: A clinical and genetic study of 19 Danish families. Acta Ophthalmol. Suppl. 1959;164:1–147. - PubMed

Publication types

MeSH terms