

Stress Monitoring in Pandemic Screening: Insights from GSR Sensor and Machine Learning Analysis
- PMID: 39852064
- PMCID: PMC11764303
- DOI: 10.3390/bios15010014
Stress Monitoring in Pandemic Screening: Insights from GSR Sensor and Machine Learning Analysis
Abstract
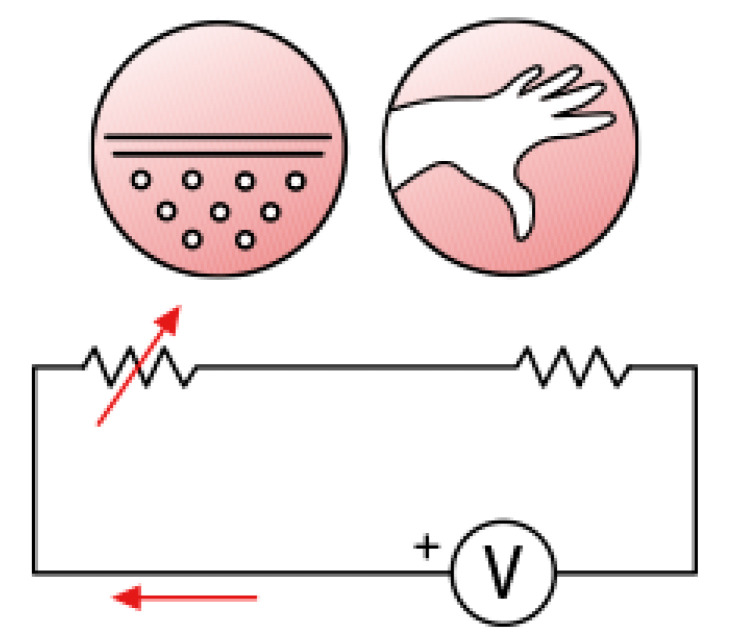
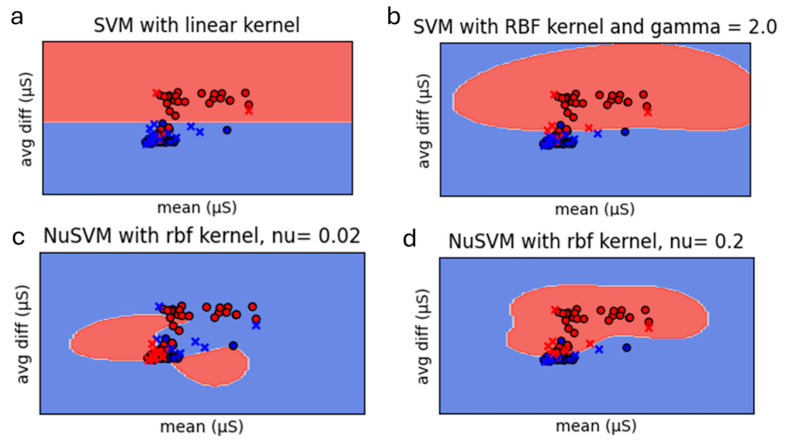
This study investigates the impact of patient stress on COVID-19 screening. An attempt was made to measure the level of anxiety of individuals undertaking rapid tests for SARS-CoV-2. To this end, a galvanic skin response (GSR) sensor that was connected to a microcontroller was used to record the individual stress levels. GSR data were collected from 51 individuals at SARS-CoV-2 testing sites. The recorded data were then compared with theoretical estimates to draw insights into stress patterns. Machine learning analysis was applied for the optimization of the sensor results. Classification algorithms allowed the automatic reading of the sensor results and individual identification as "stressed" or "not stressed". The findings confirmed the initial hypothesis that there was a significant increase in stress levels during the rapid test. This observation is critical, as heightened anxiety may influence a patient's willingness to participate in screening procedures, potentially reducing the effectiveness of public health screening strategies.
Keywords: COVID-19 screening; biosensors; classification algorithms; galvanic skin response (GSR); machine learning analysis; physiological stress indicators; stress monitoring.
Conflict of interest statement
The authors declare no conflicts of interest.
Figures


References
-
- Boucsein W. Principles of Electrodermal Phenomena. Springer; Berlin/Heidelberg, Germany: 2011.
-
- Cacioppo J.T., Tassinary L.G., Berntson G. Handbook of Psychophysiology. Cambridge University Press; Cambridge, UK: 2007.
-
- Healey J.A., Picard R.W. Detecting Stress During Real-World Driving Tasks Using Physiological Sensors. IEEE Trans. Intell. Transp. Syst. 2005;6:156–166. doi: 10.1109/TITS.2005.848368. - DOI
MeSH terms
LinkOut - more resources
Full Text Sources
Medical
Miscellaneous
