

SPR Biosensor Based on Bilayer MoS2 for SARS-CoV-2 Sensing
- PMID: 39852072
- PMCID: PMC11763928
- DOI: 10.3390/bios15010021
SPR Biosensor Based on Bilayer MoS2 for SARS-CoV-2 Sensing
Abstract
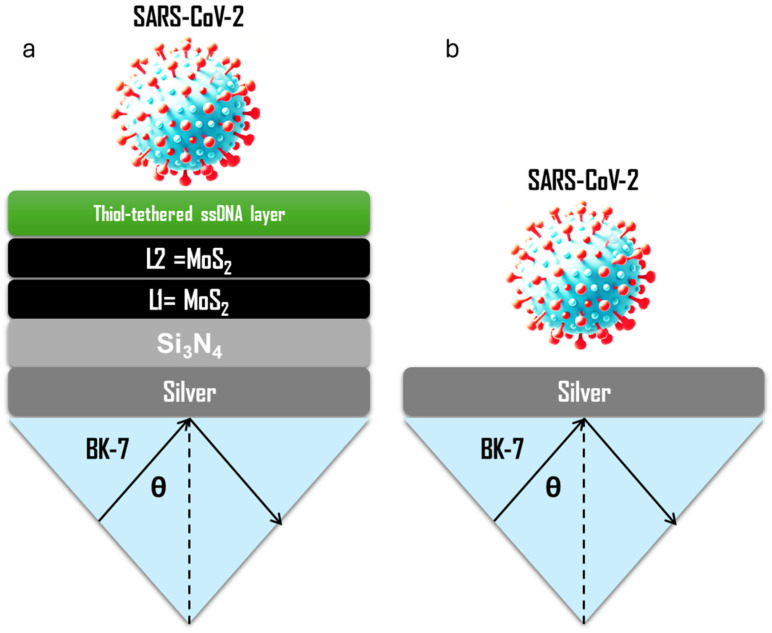
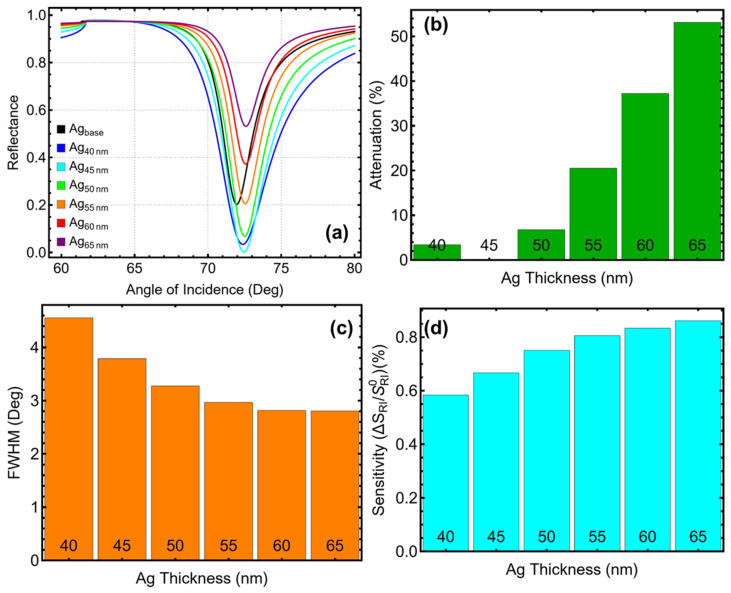
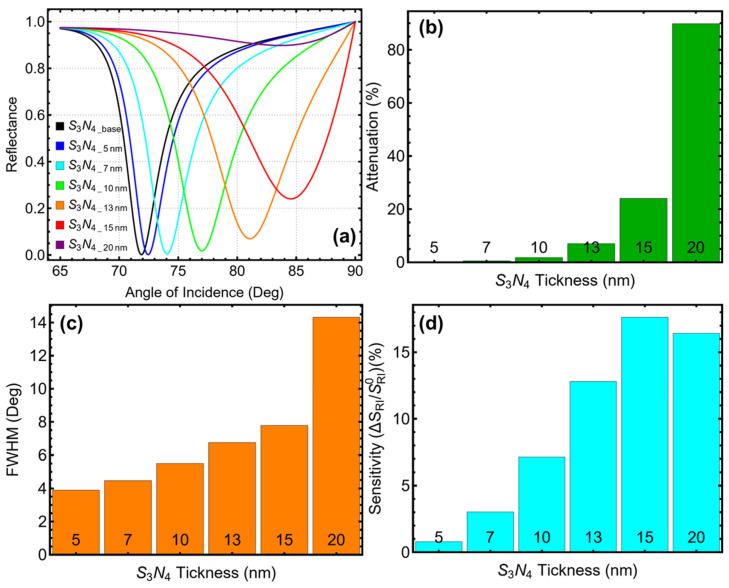
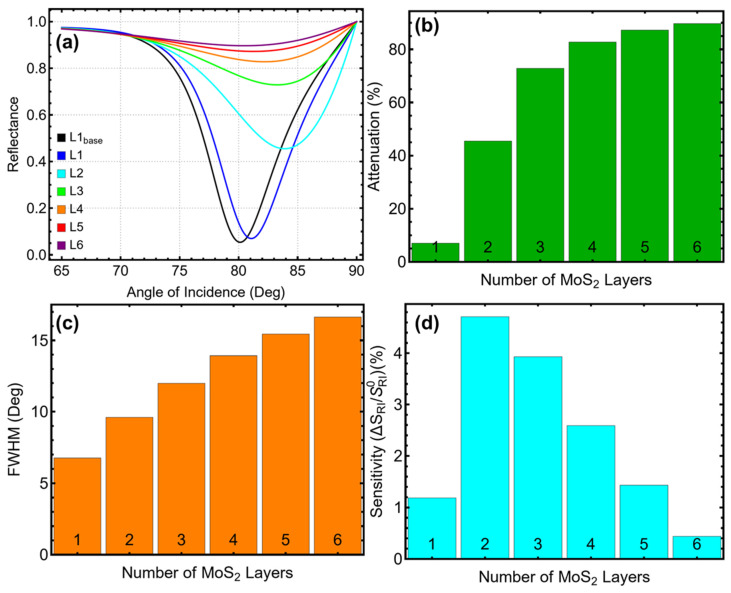
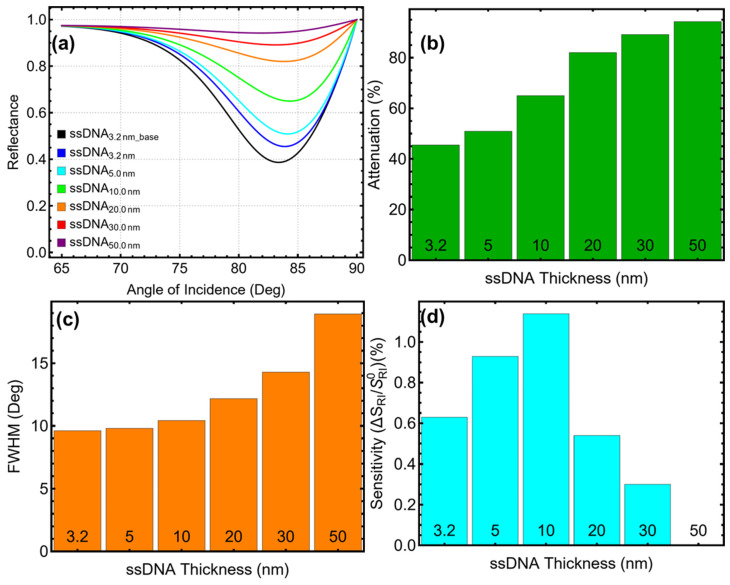
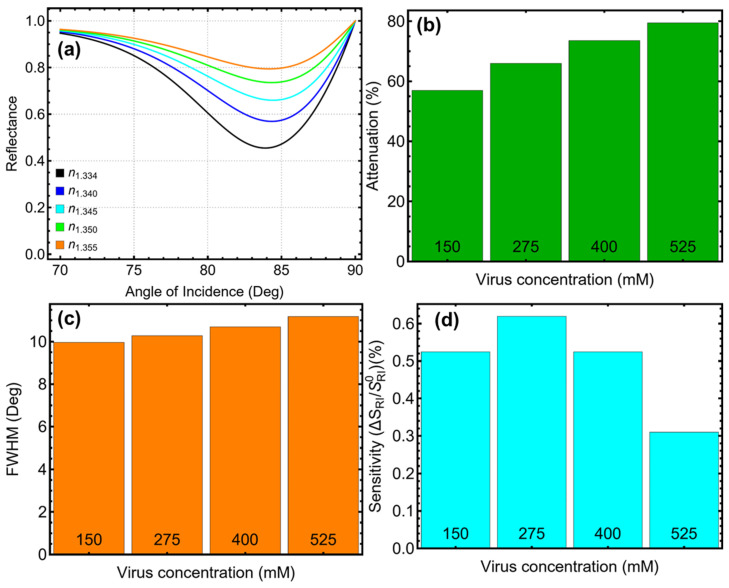
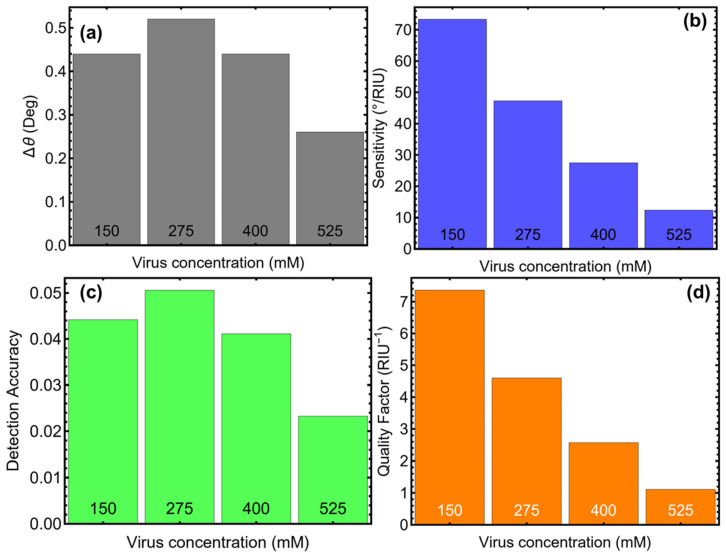
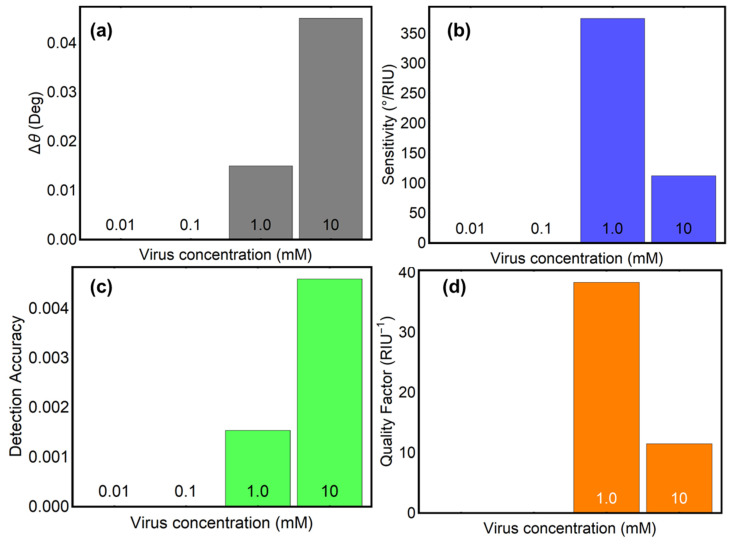
The COVID-19 pandemic has highlighted the urgent need for rapid, sensitive, and reliable diagnostic tools for detecting SARS-CoV-2. In this study, we developed and optimized a surface plasmon resonance (SPR) biosensor incorporating advanced materials to enhance its sensitivity and specificity. Key parameters, including the thickness of the silver layer, silicon nitride dielectric layer, molybdenum disulfide (MoS2) layers, and ssDNA recognition layer, were systematically optimized to achieve the best balance between sensitivity, resolution, and attenuation. The optimized configuration, consisting of a 45 nm silver layer, a 13 nm silicon nitride layer, 2 MoS2 layers, and a 5 nm ssDNA layer, demonstrated superior performance for detecting SARS-CoV-2 in PBS solution. The biosensor exhibited high sensitivity at low viral concentrations, achieving a sensitivity of 375.01°/RIU, a detection accuracy of 0.002, and a quality factor of 38.34 at 1.0 mM SARS-CoV-2 concentration. Performance metrics validated the sensor's capability for reliable detection, particularly in early-stage diagnostics where timely intervention is critical. Moreover, the biosensor's linear response to refractive index changes confirmed its potential for quantitative viral concentration analysis. This study underlines the significance of integrating advanced materials, such as MoS2 and silicon nitride, to enhance SPR biosensor performance. The findings establish the proposed biosensor as a robust and precise diagnostic tool for SARS-CoV-2 detection, with potential applications in clinical diagnostics and epidemiological monitoring.
Keywords: MoS2; SARS-CoV-2; biosensor; silicon nitride; surface plasmon resonance.
Conflict of interest statement
The authors declare no conflicts of interest.
Figures
Similar articles
-
Mathematical modeling of a MoSe₂-based SPR biosensor for detecting SARS-CoV-2 at nM concentrations.Front Bioeng Biotechnol. 2025 Feb 28;13:1547248. doi: 10.3389/fbioe.2025.1547248. eCollection 2025. Front Bioeng Biotechnol. 2025. PMID: 40092372 Free PMC article.
-
Black Phosphorous-Based Surface Plasmon Resonance Biosensor for Malaria Diagnosis.Sensors (Basel). 2025 Mar 26;25(7):2068. doi: 10.3390/s25072068. Sensors (Basel). 2025. PMID: 40218580 Free PMC article.
-
Design and Numerical Analysis of a Graphene-Coated SPR Biosensor for Rapid Detection of the Novel Coronavirus.Sensors (Basel). 2021 May 17;21(10):3491. doi: 10.3390/s21103491. Sensors (Basel). 2021. PMID: 34067769 Free PMC article.
-
Biosensors as a future diagnostic approach for COVID-19.Life Sci. 2021 May 15;273:119117. doi: 10.1016/j.lfs.2021.119117. Epub 2021 Jan 26. Life Sci. 2021. PMID: 33508293 Free PMC article. Review.
-
A Comparative Analysis of Optical Biosensors for Rapid Detection of SARS-CoV-2 and Influenza.Biotechnol Bioeng. 2025 Jun;122(6):1326-1346. doi: 10.1002/bit.28956. Epub 2025 Feb 24. Biotechnol Bioeng. 2025. PMID: 39994977 Review.
Cited by
-
A novel Mxene-SPR-based sensor for sensing different types of cancers.Front Med (Lausanne). 2025 Aug 6;12:1608424. doi: 10.3389/fmed.2025.1608424. eCollection 2025. Front Med (Lausanne). 2025. PMID: 40842527 Free PMC article.
-
The Effect of MoS2 and Si3N4 in Surface Plasmon Resonance Biosensors for HIV DNA Hybridization Detection: A Numerical Study.Micromachines (Basel). 2025 Feb 28;16(3):295. doi: 10.3390/mi16030295. Micromachines (Basel). 2025. PMID: 40141905 Free PMC article.
-
WS2/Si3N4-Based Biosensor for Low-Concentration Coronavirus Detection.Micromachines (Basel). 2025 Jan 23;16(2):128. doi: 10.3390/mi16020128. Micromachines (Basel). 2025. PMID: 40047597 Free PMC article.
References
-
- Giovanetti M., Branda F., Cella E., Scarpa F., Bazzani L., Ciccozzi A., Slavov S.N., Benvenuto D., Sanna D., Casu M., et al. Epidemic history and evolution of an emerging threat of international concern, the severe acute respiratory syndrome coronavirus 2. J. Med. Virol. 2023;95:e29012. doi: 10.1002/jmv.29012. - DOI - PubMed
-
- Miteva D., Kitanova M., Batselova H., Lazova S., Chervenkov L., Peshevska-Sekulovska M., Sekulovski M., Gulinac M., Vasilev G.V., Tomov L., et al. The end or a New Era of development of SARS-CoV-2 virus: Genetic variants responsible for severe COVID-19 and clinical efficacy of the most commonly used vaccines in clinical practice. Vaccines. 2023;11:1181. doi: 10.3390/vaccines11071181. - DOI - PMC - PubMed
-
- Cirit O.S., Mutlu E., Sancak B., Kocagöz T., Can Ö., Çicek C., Arzu Sayiner A., Appak Ö., Uyar N.Y., Külah C., et al. Comparison of a novel antigen detection test with reverse transcription polymerase chain reaction assay for laboratory diagnosis of SARS-CoV-2 infection. Infection. 2023;51:91–96. doi: 10.1007/s15010-022-01832-9. - DOI - PMC - PubMed
MeSH terms
Substances
Grants and funding
LinkOut - more resources
Full Text Sources
Medical
Miscellaneous
