

Research Progress in Small-Molecule Detection Using Aptamer-Based SERS Techniques
- PMID: 39852080
- PMCID: PMC11764255
- DOI: 10.3390/bios15010029
Research Progress in Small-Molecule Detection Using Aptamer-Based SERS Techniques
Abstract
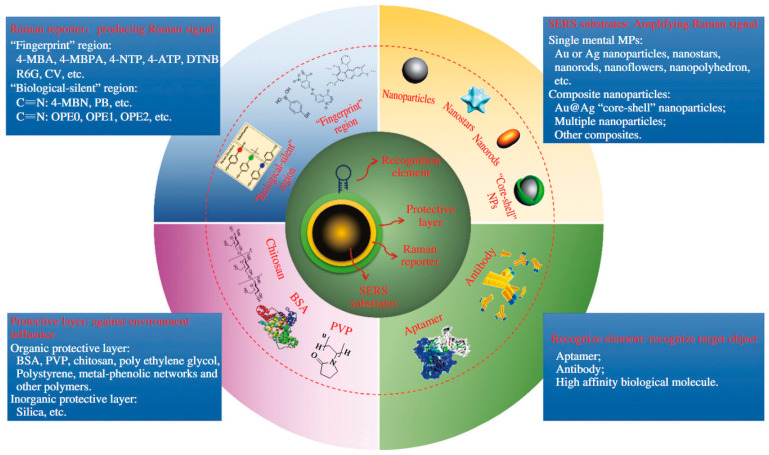
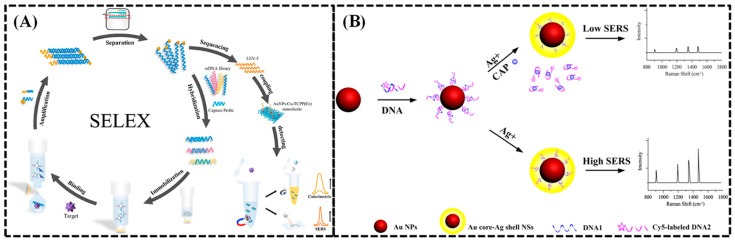
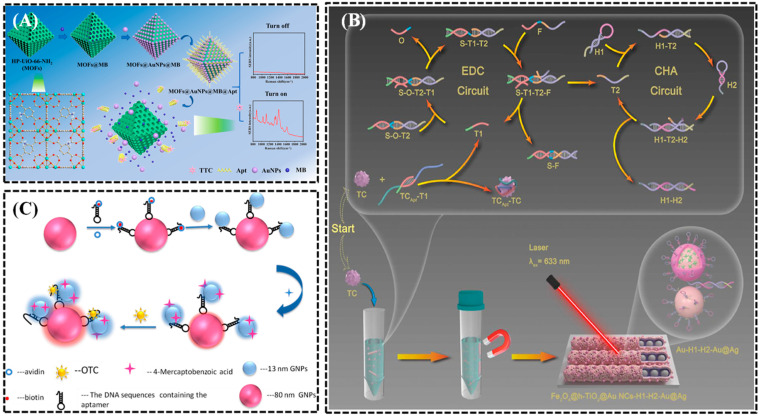
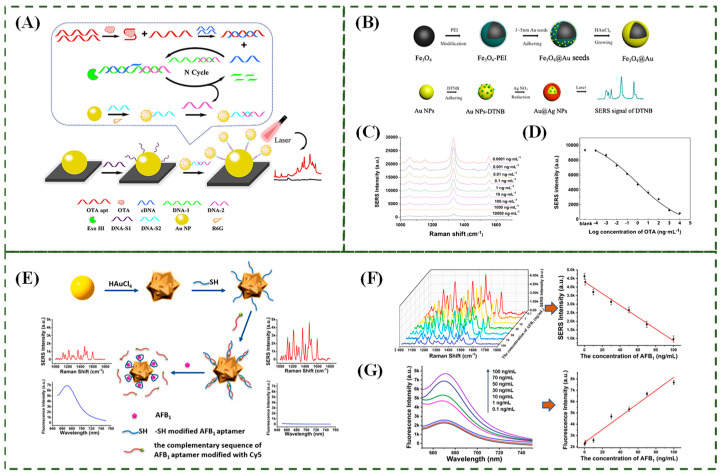
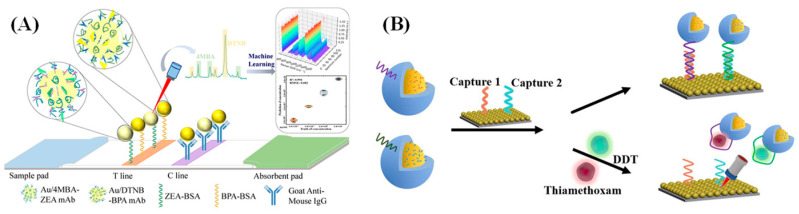
Nucleic acid aptamers are single-stranded oligonucleotides that are selected through exponential enrichment (SELEX) technology from synthetic DNA/RNA libraries. These aptamers can specifically recognize and bind to target molecules, serving as specific recognition elements. Surface-enhanced Raman scattering (SERS) spectroscopy is an ultra-sensitive, non-destructive analytical technique that can rapidly acquire the "fingerprint information" of the measured molecules. It has been widely applied in qualitative and trace analysis across various fields, including food safety, environmental monitoring, and biomedical applications. Small molecules, such as toxins, antibiotics, and pesticides, have significant biological effects and are harmful to both human health and the environment. In this paper, we mainly introduced the application and the research progress of SERS detection with aptamers (aptamer-based SERS techniques) in the field of small-molecule detection, particularly in the analysis of pesticide (animal) residues, antibiotics, and toxins. And the progress and prospect of combining the two methods in detection were reviewed.
Keywords: SERS; aptamer; sensors; small molecule.
Conflict of interest statement
The authors declare no conflicts of interest.
Figures

Similar articles
-
Aptamer-based sensor for specific recognition of malathion in fruits and vegetables by surface-enhanced Raman spectroscopy and electrochemistry combination.Anal Chim Acta. 2022 Aug 15;1221:340148. doi: 10.1016/j.aca.2022.340148. Epub 2022 Jul 11. Anal Chim Acta. 2022. PMID: 35934378
-
Development and Application of Aptamer-Based Surface-Enhanced Raman Spectroscopy Sensors in Quantitative Analysis and Biotherapy.Sensors (Basel). 2019 Sep 3;19(17):3806. doi: 10.3390/s19173806. Sensors (Basel). 2019. PMID: 31484403 Free PMC article. Review.
-
Capture-SELEX: Selection Strategy, Aptamer Identification, and Biosensing Application.Biosensors (Basel). 2022 Dec 7;12(12):1142. doi: 10.3390/bios12121142. Biosensors (Basel). 2022. PMID: 36551109 Free PMC article. Review.
-
[Research advances in non-immobilized aptamer screening techniques for small-molecule targets].Se Pu. 2025 Apr 8;43(4):297-308. doi: 10.3724/SP.J.1123.2024.04012. Se Pu. 2025. PMID: 40133195 Free PMC article. Review. Chinese.
-
Progress on aptamer-based SERS sensors for food safety and quality assessment: methodology, current applications and future trends.Crit Rev Food Sci Nutr. 2024;64(3):783-800. doi: 10.1080/10408398.2022.2108370. Epub 2022 Aug 9. Crit Rev Food Sci Nutr. 2024. PMID: 35943403 Review.
Cited by
-
Nanomaterials for Persistent Organic Pollutants Decontamination in Water: Mechanisms, Challenges, and Future Perspectives.Nanomaterials (Basel). 2025 Jul 21;15(14):1133. doi: 10.3390/nano15141133. Nanomaterials (Basel). 2025. PMID: 40711251 Free PMC article. Review.
-
Photoactivatable Aptamer-Based Biosensors for Point-of-Care Testing: Advances and Applications.Biosensors (Basel). 2025 May 24;15(6):336. doi: 10.3390/bios15060336. Biosensors (Basel). 2025. PMID: 40558418 Free PMC article. Review.
References
-
- Abdallah H., Arnaudguilhem C., Lobinski R., Jaber F. A multi-residue analysis of sulphonamides in edible animal tissues using QuEChERS extraction and HPLC-MS/MS. Anal. Methods. 2015;7:1549–1557. doi: 10.1039/C4AY01727G. - DOI
-
- Galarini R., Diana F., Moretti S., Puppini B., Saluti G., Persic L. Development and validation of a new qualitative ELISA screening for multiresidue detection of sulfonamides in food and feed. Food Control. 2014;35:300–310. doi: 10.1016/j.foodcont.2013.07.014. - DOI
Publication types
MeSH terms
Substances
Grants and funding
LinkOut - more resources
Full Text Sources
Miscellaneous
