Review
. 2025 Jan 9;15(1):35.
doi: 10.3390/bios15010035.

Surface Plasmon Resonance-Based Biodetection Systems: Principles, Progress and Applications-A Comprehensive Review

Affiliations
Review

Surface Plasmon Resonance-Based Biodetection Systems: Principles, Progress and Applications-A Comprehensive Review

Muhammad A Butt. Biosensors (Basel). .

Abstract

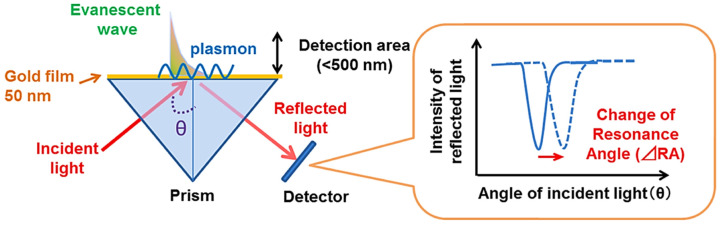
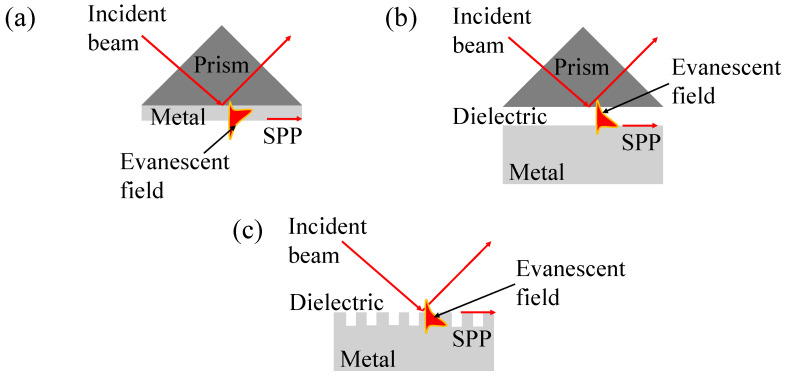
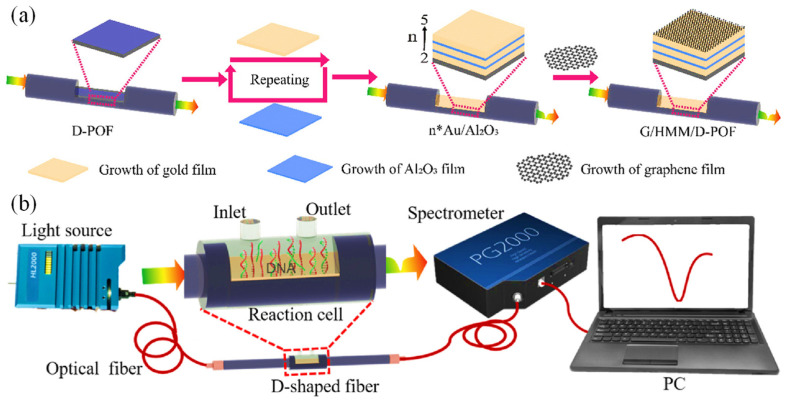
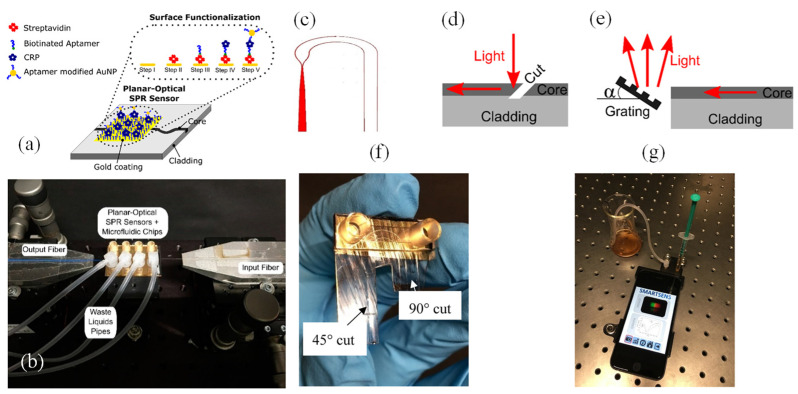
Surface Plasmon Resonance (SPR)-based biodetection systems have emerged as powerful tools for real-time, label-free biomolecular interaction analysis, revolutionizing fields such as diagnostics, drug discovery, and environmental monitoring. This review highlights the foundational principles of SPR, focusing on the interplay of evanescent waves and surface plasmons that underpin its high sensitivity and specificity. Recent advancements in SPR technology, including enhancements in sensor chip materials, integration with nanostructures, and coupling with complementary detection techniques, are discussed to showcase their role in improving analytical performance. The paper also explores diverse applications of SPR biodetection systems, ranging from pathogen detection and cancer biomarker identification to food safety monitoring and environmental toxin analysis. By providing a comprehensive overview of technological progress and emerging trends, this review underscores the transformative potential of SPR-based biodetection systems in addressing critical scientific and societal challenges. Future directions and challenges, including miniaturization, cost reduction, and expanding multiplexing capabilities, are also presented to guide ongoing research and development in this rapidly evolving field.

Keywords: Surface Plasmon Resonance; biodetection systems; drug delivery; environmental monitoring; food safety; plasmonics.


Conflict of interest statement

The authors declare no conflicts of interest.

Figures

Figure 1
Figure 1
SPR sensors operate by detecting changes in RI within a detection area of less than 500 nm, which are observed as variations in the resonance angle [50].
Figure 2
Figure 2
SPR, (a) Kretschmann configuration, (b) Otto configuration, (c) diffraction grating. SPP stands for surface plasmon polariton. In Kretschmann configuration, analytes are introduced in a sample solution that comes into direct contact with the metal film. In Otto configuration, analytes are placed in a sample medium that is separated from the prism by a thin air gap or dielectric spacer, whereas in diffraction grating configuration, analytes are introduced in a sample medium that is in contact with the surface of the diffraction grating, which is coated with a thin metal layer.
Figure 3
Figure 3
(a) Preparation process of G/HMM/D-POF, (b) schematic of an experimental setup based on G/HMM/D–POF sensor [71].
Figure 4
Figure 4
(a) The schematic shows the polymer-based MM planar-optical waveguide SPR sensor. A AuNP-enhanced aptamer-based sandwich assay amplifies the SPR wavelength shift caused by the binding of the target molecule, C-reactive protein (CRP) [75]. (b) The experimental setup includes the SPR sensor with a microfluidic chip (center) and two optical glass fibers for light coupling—one for input (right) and one for output (left) [75]. The schematic of the sensor system (c) illustrates the light coupling structures used for directing light into (d) and out of (e) the planar-optical waveguide sensor [79]. Light was coupled using a 45° cut and total internal reflection, while a 90° cut and a diffraction grating in reflection mode facilitated light coupling out. After assembling the coupling structures and microfluidic components (f), the sensor chip was placed into a 3D-printed housing (g) [79].
Figure 5
Figure 5
Overview of the Au–TiO2–Au nanocup array chip and its use: (a) A photograph of a single Au–TiO2–Au nanocup array chip. (b) Integration of the chip into a custom-made 96-well plate. (c) Testing using a standard microplate reader with small sample volumes. (d) Transmission microscopy image showing different colors, green for air and olive for water, on the chip surface [87]. (ej) The mechanism of the digital plasmonic immunosorbent assay for protein binding kinetics [88]; (e) schematic of the optical detection system setup, (f) random distribution of diluted CRP proteins on the device surface via binding to CRP capture antibodies, (g) binding of detecting antibodies to captured CRP causes a red shift in the peak resonance wavelength in transmission intensity, (h) Ppixel comparison between CRP and blank solution binding areas using image analysis, (i) digital SPR calculations are based on the Poisson distribution used in digital PCR, (j) plot showing relative count changes as a function of CRP concentration, calculated using Digital SPR arithmetic [88].
Figure 6
Figure 6
Illustration of the cyclic process for repeated sensing measurements using the reusable SPR biodetection system chip: (a) The SPR chip incorporates ferromagnetic Ni patterns integrated with a standard SPR chip design [116]. (b) Magnetic particles are captured on the SPR chip under the influence of an external magnetic field [116]. (c) Antibodies are immobilized on the magnetic particles via EDC-NHS coupling in the SPR system [116]. (d) Target molecules are detected [116]. (e) Magnetic particles are released by reversing the external magnetic field [116].
Figure 7
Figure 7
(a) Spoof SPP biodetection system featuring in-series SRRs. (b) Electric field distribution for the groove and SRR in the proposed design at 53.99 GHz. (c) Microscope images of stained tissues: normal, serous ovarian cancer, and ovarian clear cell carcinoma. (d) Zoomed-out views of these tissues [125].
Figure 8
Figure 8
(a) A schematic of the AuNP layer fabrication process (AI) [144]. (b) A schematic of the HR-LSPR spectroscopy system is shown, which includes a gas chamber connected to gas controls, a vacuum unit, and gas cylinders. The gas chamber has optical and gas in/out ports, along with a holder for the plasmonic sensor [144]. (c) STEM (cross-sectional) and SEM images of three different Au NP arrangements on SiO2 nanopillars [144]. (d) LSPR gas sensitivity functions GS(t) for the three nanoparticle arrangements, calculated for various gas exchanges [144].
Figure 9
Figure 9
Components of the fabricated SSPP sensor: (a) PMMA layer featuring the microfluidic reservoir; (b) 3M double-sided adhesive tape [149]; (c) top layer constructed from PVC foil [149]; (d) bottom layer made of PVC foil; (e) top-view layout of the completed structure; (f) bottom-view layout of the completed structure [149], (g) measurement setup [149]. Illustrations depicting (h) the process of transferring metal NPs onto inkjet paper through imprinting [150] and (i) the application of NP-embedded paper as a gas sensor for detecting biogenic amine vapors emitted by spoiled food [150].
Figure 10
Figure 10
The steps involved in determining the minimum position of the SPR reflectance dip using the cubic polynomial curve fitting method [161].
Figure 11
Figure 11
A schematic illustration outlines the process of preparing (G3.5 + G4)-aptamer-modified LSPR sensor chips for detecting the SARS-CoV-2 SRBD and pseudo viral particles. The second-layer amplification is applicable only when detecting SARS-CoV-2 pseudo viral particles, enabling the use of a detection sandwich format [175].
Figure 12
Figure 12
(a) Illustration of the graphene–MoS2-enhanced SPR biodetection system. (b) Schematic of linearly polarized waves (x-polarization) incident normally on a Au nano-antenna/graphene hybrid structure in a Cartesian coordinate system. The multilayer structure includes a cover layer, a periodic array of asymmetric Au nano-antennas, an unpatterned graphene monolayer, and a semi-infinite substrate [194]. (c) Schematic of the Cu–TMDCs–graphene-enhanced SPR biodetection system. The GH shift difference between TM and TE waves was measured to improve the signal-to-noise ratio, using TE wave signals as a reference [188].
Figure 13
Figure 13
Instrumentation of the smartphone-based SPR imaging biosensor: (a) Diagram depicting the structure of the smartphone-based SPR sensor. (b) Photograph showing the SPR sensor mounted on an Android smartphone. (c) Three-dimensional illustration detailing the internal configuration of the opto-mechanical attachment. (d) The smartphone camera captures images of the measurement, control, and reference channels, which are quickly analyzed to determine relative intensity. The results are plotted and displayed on the smartphone screen [199].
Figure 14
Figure 14
Flowchart of the ML models [210].

Similar articles

Cited by

References

    1. Duan Q., Liu Y., Chang S., Chen H., Chen J. Surface Plasmonic Sensors: Sensing Mechanism and Recent Applications. Sensors. 2021;21:5262. doi: 10.3390/s21165262. - DOI - PMC - PubMed
    1. Divya J., Selvendran S., Raja A.S., Sivasubramanian A. Surface Plasmon Based Plasmonic Sensors: A Review on Their Past, Present and Future. Biosens. Bioelectron. X. 2022;11:100175. doi: 10.1016/j.biosx.2022.100175. - DOI
    1. Butt M.A., Khonina S.N., Kazanskiy N.L. Plasmonics: A Necessity in the Field of Sensing-A Review (Invited) Fiber Integr. Opt. 2021;40:14–47. doi: 10.1080/01468030.2021.1902590. - DOI
    1. Alvarez-Puebla R.A., Li J.-F., Ling X.Y. Introduction to Advances in Plasmonics and Its Applications. Nanoscale. 2021;13:5935–5936. doi: 10.1039/D1NR90053F. - DOI - PubMed
    1. Butt M.A. Plasmonic Sensors Based on a Metal–Insulator–Metal Waveguide—What Do We Know So Far? Sensors. 2024;24:7158. doi: 10.3390/s24227158. - DOI - PMC - PubMed

LinkOut - more resources