. 2025 Jan 11;15(1):39.
doi: 10.3390/bios15010039.

Developing a Label-Free Infrared Spectroscopic Analysis with Chemometrics and Computational Enhancement for Assessing Lupus Nephritis Activity

Affiliations

Developing a Label-Free Infrared Spectroscopic Analysis with Chemometrics and Computational Enhancement for Assessing Lupus Nephritis Activity

Mei-Ching Yu et al. Biosensors (Basel). .

Abstract

Patterns of disease and therapeutic responses vary widely among patients with autoimmune glomerulonephritis. This study introduces groundbreaking personalized infrared (IR)-based diagnostics for real-time monitoring of disease status and treatment responses in lupus nephritis (LN). We have established a relative absorption difference (RAD) equation to assess characteristic spectral indices based on the temporal peak heights (PHs) of two characteristic serum absorption bands: ν1 as the target signal and ν2 as the PH reference for the ν1 absorption band, measured at each dehydration time (t) during dehydration. The RAD gap (Ψ), defined as the difference in the RAD values between the initial and final stages of serum dehydration, enables the measurement of serum levels of IgG glycosylation (ν1 (1030 cm-1), ν2 (1171 cm-1)), serum lactate (ν1 (1021 cm-1), ν2 (1171 cm-1)), serum hydrophobicity (ν1 (2930 cm-1), ν2 (2960 cm-1)), serum hydrophilicity (ν1 (1550 cm-1), ν2 (1650 cm-1)), and albumin (ν1 (1400 cm-1), ν2 (1450 cm-1)). Furthermore, this IR-based assay incorporates an innovative algorithm and our proprietary iPath software (ver. 1.0), which calculates the prognosis prediction function (PPF, Φ) from the RAD gaps of five spectral markers and correlates these with conventional clinical renal biomarkers. We propose that this algorithm-assisted, IR-based approach can augment the patient-centric care of LN patients, particularly by focusing on changes in serum IgG glycosylation.

Keywords: FTIR spectroscopy; IgG glycosylation; iPath; lupus nephritis; prognosis prediction function; relative absorption difference.


Conflict of interest statement

FWKT has received research project grants from AstraZeneca Limited, OncoOne, Rigel Pharmaceuticals, and Thornton and Ross Ltd and has consultancy agreements with OncoOne, Rigel Pharmaceuticals, Retrophin, Travere Therapeutics. The other authors declare no conflicts of interest.

Figures

Figure 1
Figure 1
The schematic optical layout of the FTIR spectrometer, ATR accessory, and sample cell for the measurement of X-ray scattering. (a) The setup of the ATR-FTIR and temperature control systems for acquiring spectra of serum samples during dehydration. (b) The liquid serum sample loaded on the surface of the ATR germanium (Ge) crystal, which is mounted on a stainless steel disc and purged with a continuous flow of dry nitrogen. (c) The optical path of the evanescence wave of the modulated mid-IR beam as it propagates through the serum sample. (d) The sample cell is designed to collect small-angle X-ray scattering from IgG antibodies at TPS 13A1 of NSRRC. The IgG sample was purified using HPLC and detected by a UV detector to determine the IgG concentration.
Figure 2
Figure 2
The RAD equation is defined by five spectral indices (Lact, Gly, Hp, Hph, and Alb) along with their corresponding band assignments.
Figure 3
Figure 3
(a) A representative temporal RAD profile and RAD gap during serum dehydration. (b) Flowchart illustrating the data processing steps for temporal RAD and RAD gap determination during serum dehydration, and the calculation of PPF values for each follow-up visit. (c) Representative RAD gap profiles of Lact, Gly, Hp, Hph, and Alb of patient P1 throughout the study.
Figure 4
Figure 4
Representative FTIR spectrum and peak assignments of deuterated serum from a cLN patient (P6), demonstrating the stability of the amide I band peak height following a hydrogen–deuterium (H/D) exchange. Notably, the peak height of the amide I band of protein remains nearly unchanged post-H/D exchange.
Figure 5
Figure 5
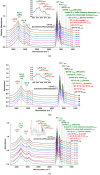
Representative FTIR spectra of dehydrated serum samples: (a) SLE patients with class IV LN (P1-01 to P8-01) and the averaged spectrum of 6 healthy cases as the control. (b) Healthy controls (H1-H6), and (c) serial serum spectra (P1-01 to P1-12) and the control illustrating changes from patient P1 diagnosed with acute cLN over the treatment period following the initial diagnosis. The red inset shows the assignment of the absorption peaks in the spectral range of 3000–2800 cm−1. Each serum spectrum underwent ATR correction, baseline correction, and normalization. (Note: P1-01 to P8-01 represent the first sample collected and analyzed after enrollment in the study; P1-01 to P1-12 present serum samples collected from patient P1 from day 0 to day 1191).
Figure 6
Figure 6
The schematic diagram illustrates the structure of the Asn-297 glycan residue of IgG and outlines the progression of glycosylation changes across various states of inflammation, transitioning from agalactosylated (G0F) to galactosylated (G1F, G2F), and subsequently to fucosylated and sialylated forms (G2FS1, G2FS2). These sequential modifications of the glycan structure highlight the dynamic shifts in agalactosylation, galactosylation, fucosylation, and sialylation.
Figure 7
Figure 7
(a) ATR-FTIR spectra of serum samples (P1-8) treated with PNGase F for 24 to 72 h. (b) Representative serum ATR-FTIR spectra of selected monosaccharides, oligosaccharides, and monosaccharide derivatives in the 1300–900 cm−1 spectral range.
Figure 8
Figure 8
(a) Comparison of serum HPI levels among the patients with acute cLN, chronic cLN, and healthy control subjects. (b) Correlations between serum HPI values and clinical biomarkers in cLN treatment response. This figure illustrates the relationships of serum HPI with Scr, serum albumin, UTP, and UPCR in cLN patients throughout the study period. Patients P1–P4, with active cLN undergoing induction immunosuppression therapy, and patients P5–P8, with chronic cLN receiving maintenance immunosuppression therapy, are included. (For concentrations of individual clinical biomarkers at each follow-up time point for patients P1–P4 and P5–P8, refer to Table S1).
Figure 9
Figure 9
The treatment response of acute cLN patient P1 and chronic cLN patient P5. Through follow-up periods. (a,d) Biomarker scores, including albumin, Scr, UPCR, and UTP; (b,e) serum RAD gaps; and (c,f) PPF values. Abbreviations: MTP (Mini-pulse methylprednisolone), P (Prednisolone), m (Myfortic), Tac (Tacrolimus), CyA (Cyclosporin), H (Hydroxychloroquine).

Similar articles

References

    1. Levy D.M., Kamphuis S. Systemic lupus erythematosus in children and adolescents. Pediatr. Clin. N. Am. 2012;59:345–364. doi: 10.1016/j.pcl.2012.03.007. - DOI - PMC - PubMed
    1. Couture J., Silverman E.D. Update on the pathogenesis and treatment of childhood-onset systemic lupus erythematosus. Curr. Opin. Rheumatol. 2016;28:488–496. doi: 10.1097/BOR.0000000000000317. - DOI - PubMed
    1. Tarr T., Dérfalvi B., Győri N., Szántó A., Siminszky Z., Malik A., Szabó A.J., Szegedi G., Zeher M. Similarities and differences between pediatric and adult patients with systemic lupus erythematosus. Lupus. 2015;24:796–803. doi: 10.1177/0961203314563817. - DOI - PubMed
    1. Al Rasbi A., Abdalla E., Sultan R., Abdullah N., Al Kaabi J., Al-Zakwani I., Abdwani R. Spectrum of systemic lupus erythematosus in Oman: From childhood to adulthood. Rheumatol. Int. 2018;38:1691–1698. doi: 10.1007/s00296-018-4032-2. - DOI - PubMed
    1. Mok C.C., Yap D.Y., Navarra S.V., Liu Z.H., Zhao M.H., Lu L., Takeuchi T., Avihingsanon Y., Yu X.Q., Lapid E.A., et al. Overview of lupus nephritis management guidelines and perspective from Asia. Nephrology. 2014;19:11–20. doi: 10.1111/nep.12136. - DOI - PubMed

LinkOut - more resources