

Sensitive Detection of Biomarker in Gingival Crevicular Fluid Based on Enhanced Electrochemiluminescence by Nanochannel-Confined Co3O4 Nanocatalyst
- PMID: 39852114
- PMCID: PMC11764429
- DOI: 10.3390/bios15010063
Sensitive Detection of Biomarker in Gingival Crevicular Fluid Based on Enhanced Electrochemiluminescence by Nanochannel-Confined Co3O4 Nanocatalyst
Abstract
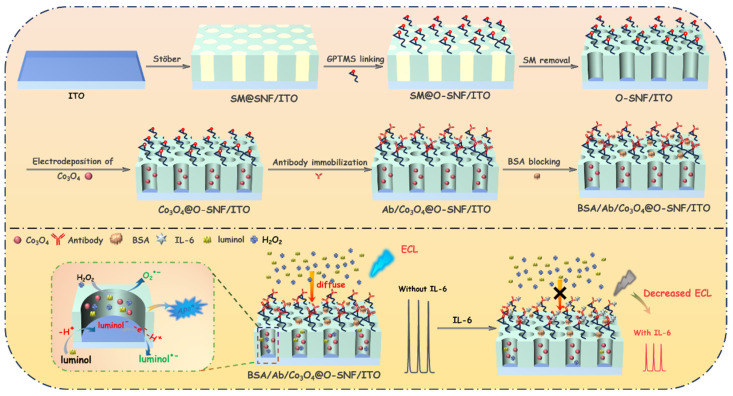
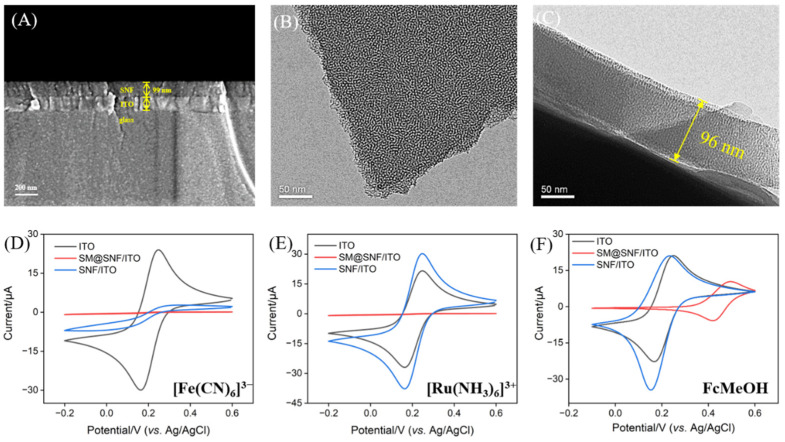
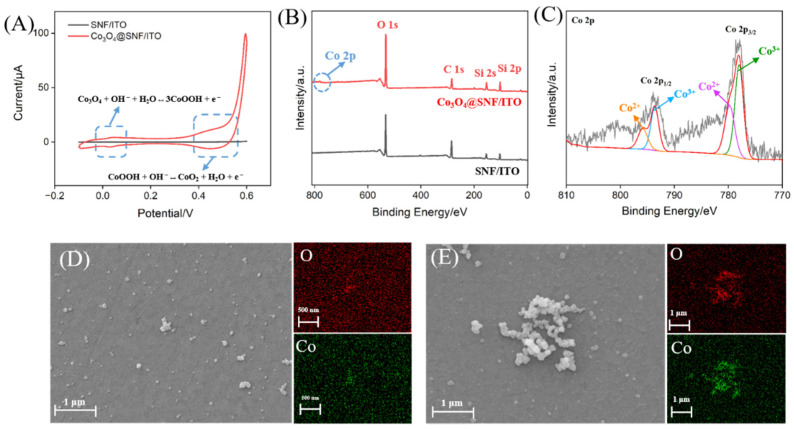
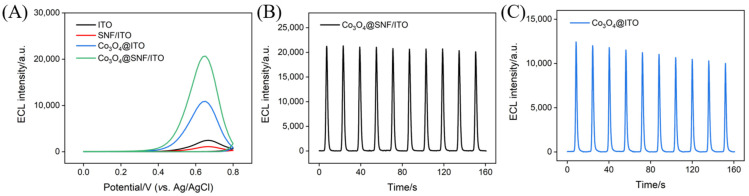
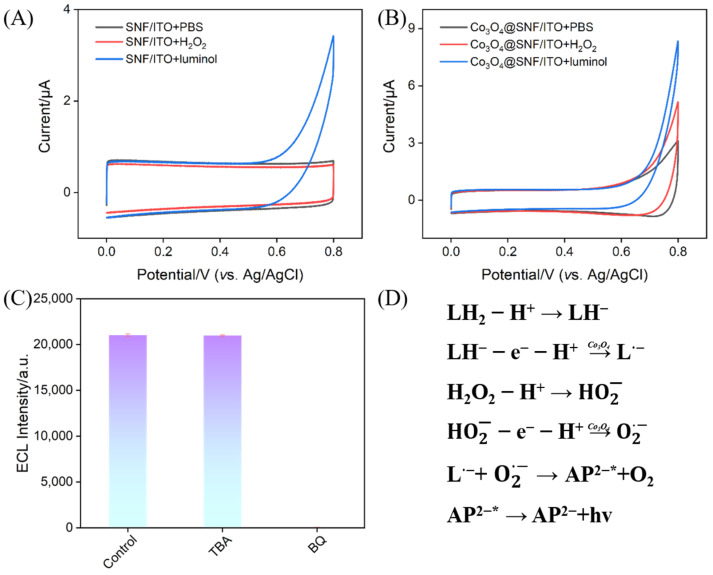
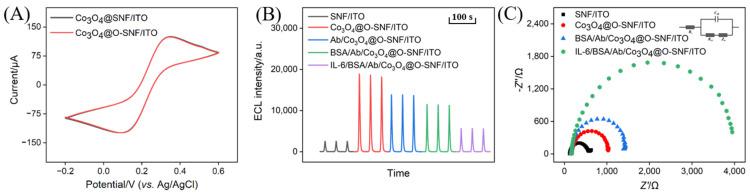
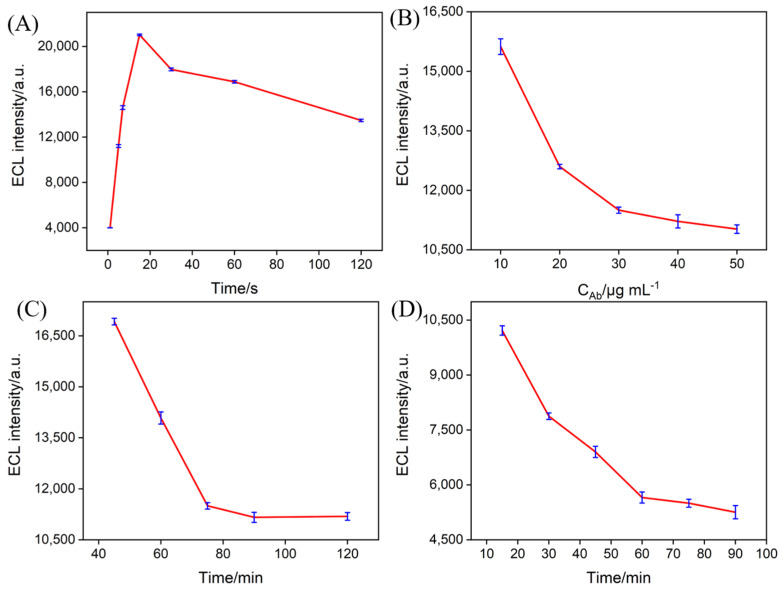
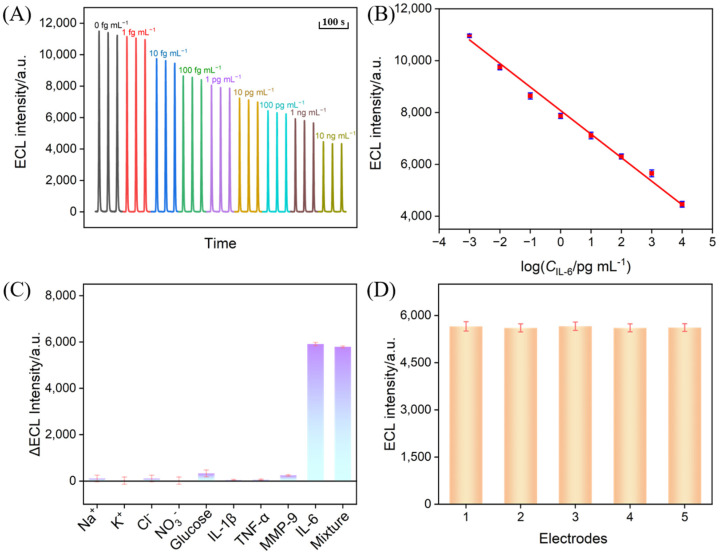
The sensitive detection of inflammatory biomarkers in gingival crevicular fluid (GCF) is highly desirable for the evaluation of periodontal disease. Luminol-based electrochemiluminescence (ECL) immunosensors offer a promising approach for the fast and convenient detection of biomarkers. However, luminol's low ECL efficiency under neutral conditions remains a challenge. This study developed an immunosensor by engineering an immunorecognition interface on the outer surface of mesoporous silica nanochannel film (SNF) and confining a Co3O4 nanocatalyst within the SNF nanochannels to improve the luminol ECL efficiency. The SNF was grown on an indium tin oxide (ITO) electrode using the simple Stöber solution growth method. A Co3O4 nanocatalyst was successfully confined within the SNF nanochannels through in situ electrodeposition, confirmed by X-ray photoelectron spectroscopy (XPS) and electrochemical measurements. The confined Co3O4 demonstrated excellent electrocatalytic activity, effectively enhancing luminol and H2O2 oxidation and boosting the ECL signal under neutral conditions. Using interleukin-6 (IL-6) as a proof-of-concept demonstration, the epoxy functionalization of the SNF outer surface enabled the covalent immobilization of capture antibodies, forming a specific immunorecognition interface. IL-6 binding induced immunocomplex formation, which reduced the ECL signal and allowed for quantitative detection. The immunosensor showed a linear detection range for IL-6 from 1 fg mL-1 to 10 ng mL-1, with a limit of detection (LOD) of 0.64 fg mL-1. It also demonstrated good selectivity and anti-interference capabilities, enabling the successful detection of IL-6 in artificial GCF samples.
Keywords: Co3O4; electrochemiluminescence; immunosensor; luminol; nanochannel-confined.
Conflict of interest statement
The authors declare no conflicts of interest.
Figures
Similar articles
-
Nanochannel confined graphene quantum dots/platinum nanoparticles boosts electrochemiluminescence of luminal-O2 system for sensitive immunoassay.Talanta. 2025 Apr 1;285:127223. doi: 10.1016/j.talanta.2024.127223. Epub 2024 Nov 20. Talanta. 2025. PMID: 39613487
-
Nanochannel-confined Ni(OH)2-CeO2 composite nanozyme boosts electrochemiluminescence of luminol-dissolved oxygen for immunosensing.Biosens Bioelectron. 2025 Jul 15;280:117451. doi: 10.1016/j.bios.2025.117451. Epub 2025 Apr 4. Biosens Bioelectron. 2025. PMID: 40209648
-
Enhanced Electrochemiluminescence of Luminol and-Dissolved Oxygen by Nanochannel-Confined Au Nanomaterials for Sensitive Immunoassay of Carcinoembryonic Antigen.Molecules. 2024 Oct 15;29(20):4880. doi: 10.3390/molecules29204880. Molecules. 2024. PMID: 39459248 Free PMC article.
-
Immunosensor with Enhanced Electrochemiluminescence Signal Using Platinum Nanoparticles Confined within Nanochannels for Highly Sensitive Detection of Carcinoembryonic Antigen.Molecules. 2023 Sep 11;28(18):6559. doi: 10.3390/molecules28186559. Molecules. 2023. PMID: 37764335 Free PMC article.
-
Electrochemiluminescence Aptasensor with Dual Signal Amplification by Silica Nanochannel-Based Confinement Effect on Nanocatalyst and Efficient Emitter Enrichment for Highly Sensitive Detection of C-Reactive Protein.Molecules. 2023 Nov 19;28(22):7664. doi: 10.3390/molecules28227664. Molecules. 2023. PMID: 38005386 Free PMC article.
Cited by
-
Highly sensitive electrochemical immunosensor based on methylene blue-reduced graphene oxide nanocomposites as signal probes for IL-6 detection in gingival crevicular fluid samples.Front Chem. 2025 Apr 2;13:1549927. doi: 10.3389/fchem.2025.1549927. eCollection 2025. Front Chem. 2025. PMID: 40242657 Free PMC article.
-
In Situ Growth of Au NPs on Nitrogen-Doped Graphene Quantum Dots Decorated Graphene Composites for the Construction of an Electrochemical Immunosensor and Its Application in CEA Detection.Molecules. 2025 Mar 17;30(6):1347. doi: 10.3390/molecules30061347. Molecules. 2025. PMID: 40142122 Free PMC article.
-
Homogeneous Aptasensor with Electrochemical and Electrochemiluminescence Dual Detection Channels Enabled by Nanochannel-Based Probe Enrichment and DNase I Cleavage for Tumor Biomarker Detection.Molecules. 2025 Feb 6;30(3):746. doi: 10.3390/molecules30030746. Molecules. 2025. PMID: 39942852 Free PMC article.
-
Simple Nanochannel-Modified Electrode for Sensitive Detection of Alkaline Phosphatase Through Electrochemiluminescence Signal Quenching by Enzymatic Reaction.Biosensors (Basel). 2025 Jun 11;15(6):377. doi: 10.3390/bios15060377. Biosensors (Basel). 2025. PMID: 40558459 Free PMC article.
-
Enzyme-Based Solid-Phase Electrochemiluminescence Sensors with Stable, Anchored Emitters for Sensitive Glucose Detection.Biosensors (Basel). 2025 May 21;15(5):332. doi: 10.3390/bios15050332. Biosensors (Basel). 2025. PMID: 40422071 Free PMC article.
References
-
- Hu X., Zhou L., Wu X., Peng Y. Review on near-field detection technology in the biomedical field. Adv. Photonics Nexus. 2023;2:044002. doi: 10.1117/1.APN.2.4.044002. - DOI
MeSH terms
Substances
Grants and funding
LinkOut - more resources
Full Text Sources
