LC-MS-Based Global Metabolic Profiles of Alternative Blood Specimens Collected by Microsampling
- PMID: 39852404
- PMCID: PMC11767270
- DOI: 10.3390/metabo15010062
LC-MS-Based Global Metabolic Profiles of Alternative Blood Specimens Collected by Microsampling
Abstract
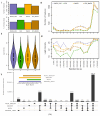
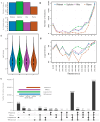
Blood microsampling (BμS) has recently emerged as an interesting approach in the analysis of endogenous metabolites but also in metabolomics applications. Their non-invasive way of use and the simplified logistics that they offer renders these technologies highly attractive in large-scale studies, especially the novel quantitative microsampling approaches such as VAMs or qDBS. Objectives: Herein, we investigate the potential of BµS devices compared to the conventional plasma samples used in global untargeted mass spectrometry-based metabolomics of blood. Methods: Two novel quantitative devices, namely, Mitra, Capitainer, and the widely used Whatman cards, were selected for comparison with plasma. Venous blood was collected from 10 healthy, overnight-fasted individuals and loaded on the devices; plasma was also collected from the same venous blood. An extraction solvent optimization study was first performed on the three devices before the main study, which compared the global metabolic profiles of the four extracts (three BµS devices and plasma). Analysis was conducted using reverse phase LC-TOF MS in positive mode. Results: BµS devices, especially Mitra and Capitainer, provided equal or even superior information on the metabolic profiling of human blood based on the number and intensity of features and the precision and stability of some annotated metabolites compared to plasma. Despite their rich metabolic profiles, BµS did not capture metabolites associated with biological differentiation of sexes. Conclusions: Overall, our results suggest that a more in-depth investigation of the acquired information is needed for each specific application, as a metabolite-dependent trend was obvious.
Keywords: blood metabolic phenotype; blood metabolites; blood microsampling (BµS); dried blood spot (DBS); global metabolic profile; liquid chromatography–mass spectrometry (LC-MS); metabolome; quantitative dried blood spots (qDBS); untargeted metabolomics; volumetric absorptive microsampling (VAM).
Conflict of interest statement
The authors declare no conflicts of interest.
Figures


Similar articles
-
Targeted and untargeted metabolomics and lipidomics in dried blood microsampling: Recent applications and perspectives.Anal Sci Adv. 2024 Jun 14;5(5-6):e2400002. doi: 10.1002/ansa.202400002. eCollection 2024 Jun. Anal Sci Adv. 2024. PMID: 38948320 Free PMC article. Review.
-
Pre-analytic evaluation of volumetric absorptive microsampling and integration in a mass spectrometry-based metabolomics workflow.Anal Bioanal Chem. 2017 Oct;409(26):6263-6276. doi: 10.1007/s00216-017-0571-8. Epub 2017 Aug 17. Anal Bioanal Chem. 2017. PMID: 28815270 Free PMC article.
-
Adhesive blood microsampling systems for steroid measurement via LC-MS/MS in the rat.Steroids. 2017 Apr;120:1-6. doi: 10.1016/j.steroids.2017.01.006. Epub 2017 Feb 9. Steroids. 2017. PMID: 28189541
-
Volumetric absorptive microsampling (VAMS) coupled with high-resolution, accurate-mass (HRAM) mass spectrometry as a simplified alternative to dried blood spot (DBS) analysis for therapeutic drug monitoring of cardiovascular drugs.Clin Mass Spectrom. 2018 Aug 4;10:1-8. doi: 10.1016/j.clinms.2018.08.002. eCollection 2018 Dec. Clin Mass Spectrom. 2018. PMID: 39193357 Free PMC article.
-
Microsampling Assays for Pharmacokinetic Analysis and Therapeutic Drug Monitoring of Antimicrobial Drugs in Children: A Critical Review.Ther Drug Monit. 2021 Jun 1;43(3):335-345. doi: 10.1097/FTD.0000000000000845. Ther Drug Monit. 2021. PMID: 33278241 Free PMC article. Review.
Cited by
-
Mass spectrometry-based quantification of proteins and post-translational modifications in dried blood: longitudinal sampling of patients with sepsis in Tanzania.bioRxiv [Preprint]. 2025 Apr 28:2025.04.22.650109. doi: 10.1101/2025.04.22.650109. bioRxiv. 2025. PMID: 40492198 Free PMC article. Preprint.
References
-
- Gika H., Theodoridis G., Plumb R.S., Wilson I.D. Liquid Chromatography: Applications. Elsevier; Amsterdam, The Netherlands: 2023. Metabolic phenotyping (metabonomics/metabolomics) by liquid chromatography-mass spectrometry; pp. 403–429. - DOI
-
- Marchev A.S., Vasileva L.V., Amirova K.M., Savova M.S., Balcheva-Sivenova Z.P., Georgiev M.I. Metabolomics and health: From nutritional crops and plant-based pharmaceuticals to profiling of human biofluids. Cell. Mol. Life Sci. 2021;78:6487–6503. doi: 10.1007/s00018-021-03918-3. - DOI - PMC - PubMed
Grants and funding
LinkOut - more resources
Full Text Sources

