. 2025 Jan 20;15(1):66.
doi: 10.3390/metabo15010066.

Osteopenia Metabolomic Biomarkers for Early Warning of Osteoporosis

Affiliations

Osteopenia Metabolomic Biomarkers for Early Warning of Osteoporosis

Jie Wang et al. Metabolites. .

Abstract

Introduction: This study aimed to capture the early metabolic changes before osteoporosis occurs and identify metabolomic biomarkers at the osteopenia stage for the early prevention of osteoporosis. Materials and Methods: Metabolomic data were generated from normal, osteopenia, and osteoporosis groups with 320 participants recruited from the Nicheng community in Shanghai. We conducted individual edge network analysis (iENA) combined with a random forest to detect metabolomic biomarkers for the early warning of osteoporosis. Weighted Gene Co-Expression Network Analysis (WGCNA) and mediation analysis were used to explore the clinical impacts of metabolomic biomarkers. Results: Visual separations of the metabolic profiles were observed between three bone mineral density (BMD) groups in both genders. According to the iENA approach, several metabolites had significant abundance and association changes in osteopenia participants, confirming that osteopenia is a critical stage in the development of osteoporosis. Metabolites were further selected to identify osteopenia (nine metabolites in females; eight metabolites in males), and their ability to discriminate osteopenia was improved significantly compared to traditional bone turnover markers (BTMs) (female AUC = 0.717, 95% CI 0.547-0.882, versus BTMs: p = 0.036; male AUC = 0.801, 95% CI 0.636-0.966, versus BTMs: p = 0.007). The roles of the identified key metabolites were involved in the association between total fat-free mass (TFFM) and osteopenia in females. Conclusion: Osteopenia was identified as a tipping point during the development of osteoporosis with metabolomic characteristics. A few metabolites were identified as candidate early-warning biomarkers by machine learning analysis, which could indicate bone loss and provide new prevention guidance for osteoporosis.

Keywords: biomarkers; bone mineral density; early warning; metabolomics; osteopenia.


Conflict of interest statement

The authors declare no conflicts of interest.

Figures

Figure 1
Figure 1
Analysis procedure used in this study. The osteopenia state is critical in distinguishing patients with pre-osteoporosis.
Figure 2
Figure 2
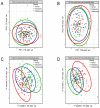
Differential analysis of metabolite profiles. (A) PCA of the data from females. (B) PCA of the data from males. (C) PLSDA analysis of the data from females. (D) PLSDA analysis of the data from males. (E) A representative metabolite showing a tendency to change levels in the different female groups. (F) A representative metabolite showing a tendency to change levels in the different male groups. (G) Statistics of the differential clinical symptoms and differential metabolites for the different female groups. (H) Statistics of the differential clinical symptoms and differential metabolites for the different male groups.
Figure 2
Figure 2
Differential analysis of metabolite profiles. (A) PCA of the data from females. (B) PCA of the data from males. (C) PLSDA analysis of the data from females. (D) PLSDA analysis of the data from males. (E) A representative metabolite showing a tendency to change levels in the different female groups. (F) A representative metabolite showing a tendency to change levels in the different male groups. (G) Statistics of the differential clinical symptoms and differential metabolites for the different female groups. (H) Statistics of the differential clinical symptoms and differential metabolites for the different male groups.
Figure 3
Figure 3
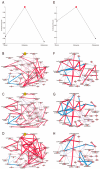
Individual edge network analysis. (A) The early-warning index change for the three female groups. (B) The co-expressed metabolite biomarker network for the female control group. (C) The co-expressed metabolite biomarker network for the female osteopenia group. (D) The co-expressed metabolite biomarker network for the female osteoporosis group. (E) The early-warning index change for the three male groups. (F) The co-expressed metabolite biomarker network for the male control group. (G) The co-expressed metabolite biomarker network for the male osteopenia group. (H) The co-expressed metabolite biomarker network for the male osteoporosis group.
Figure 4
Figure 4
ROC curves of RF models for the diagnosis of osteopenia. (A) Metabolite model and BTM model for females. BTM model: AUC = 0.468, 95% CI 0.278–0.658; female model: AUC = 0.717, 95% CI 0.547–0.882; female model versus BTMs: p = 0.036. ROC: receiver operating characteristic; BTMs: bone turnover markers; AUC: area under the curve; CI: confidence interval. BTMs include osteocalcin, N-terminalprocollagen of type I collagen (PINP), and β-cross-linked C-telopeptide of type I collagen (β-CTX). The female model includes phosphatidylcholine diacyl C34:1, phosphatidylcholine diacyl C38:5, phosphatidylcholine diacyl C40:5, phosphatidylcholine diacyl C40:6, phosphatidylcholine acyl alkyl C36:1, phosphatidylcholine acyl alkyl C36:4, phosphatidylcholine acyl alkyl C38:5, phosphatidylcholine acyl alkyl C40:5, and phosphatidylcholine acyl alkyl C42:2. (B) Metabolite model and BTM model for males. BTM model: AUC = 0.418, 95% CI 0.195–0.642; male model: AUC = 0.801, 95% CI 0.636–0.966; male model versus BTMs: p = 0.007. ROC: receiver operating characteristic; BTMs: bone turnover markers; AUC: area under the curve; CI: confidence interval. BTMs include osteocalcin, N-terminal procollagen of type I collagen (PINP), and β-cross-linked C-telopeptide of type I collagen (β-CTX). The male model includes lyso-phosphatidylcholine acyl C16:0, phosphatidylcholine diacyl C34:1, sphingomyelin C26:1, arginine, glutamine, ornithine, valine, and spermine.
Figure 5
Figure 5
Association between metabolites and clinical indices. –––(A) Association between metabolomic modules and clinical indices (females). (B) Association between metabolomic modules and clinical indices (males). (C) Association between metabolomic biomarkers and clinical indices (females). (D) Association between metabolomic biomarkers and clinical indices (males). (E) Mediation analysis of metabolites between TFFM and osteopenia in females. BMI, body mass index; GGT, γ-glutamyl transpeptidase; ALT, alanine aminotransferase; AST, aspartate aminotransferase; ALP, alkaline phosphatase; CHE, cholinesterase; PAB, prealbumin; ALB, albumin; TSH, thyroid stimulating hormone; FT3, free tri-Iodothyronine; FT4, free thyroxine; APO, apolipoprotein; TC, total cholesterol; LDL, low-density lipoprotein cholesterol; TG, triglyceride; HDL, high-density lipoprotein cholesterol; FFA, free fatty acid; LPA, Lipoprotein(a); CR, creatinine; BUN, blood urea nitrogen; Ca, calcium; P, phosphorus; ACR, albumin-to-creatinine ratio; GA, glycated albumin; HbA1c, glycated hemoglobin; GSP, glycosylated serum protein; CRP, C-reactive protein; NMID, N-terminal osteocalcin; BFP, body fat percentage; TFM, total fat mass; TFFM, total fat-free mass; 25(OH)D, 25-hydroxyvitamin D3; PTH, parathyroid hormone; β-CTX, β-cross-linked C-telopeptide of type I collagen; PINP, N-terminalprocollagen of type I collagen; UA, uric acid; SFA, subcutaneous fat area; VFA, visceral fat area; SBP, systolic blood pressure; DBP, diastolic blood pressure; WC, waist circumference; HOMA, homeostasis model assessment; STU-1, Stumvoll first-phase insulin secretion index; STU-2, Stumvoll second-phase insulin secretion index; log, log-transformation; ACME, average causal mediation effect; ADE, average direct effect.

Similar articles

References

    1. Zeng Q., Li N., Wang Q., Feng J., Sun D., Zhang Q., Huang J., Wen Q., Hu R., Wang L., et al. The Prevalence of Osteoporosis in China, a Nationwide, Multicenter DXA Survey. J. Bone Miner. Res. 2019;34:1789–1797. doi: 10.1002/jbmr.3757. - DOI - PubMed
    1. Bliuc D., Alarkawi D., Nguyen T.V., Eisman J.A., Center J.R. Risk of subsequent fractures and mortality in elderly women and men with fragility fractures with and without osteoporotic bone density: The Dubbo Osteoporosis Epidemiology Study. J. Bone Miner. Res. 2015;30:637–646. doi: 10.1002/jbmr.2393. - DOI - PubMed
    1. Bliuc D., Nguyen N.D., Milch V.E., Nguyen T.V., Eisman J.A., Center J.R. Mortality risk associated with low-trauma osteoporotic fracture and subsequent fracture in men and women. JAMA. 2009;301:513–521. doi: 10.1001/jama.2009.50. - DOI - PubMed
    1. Oh E.G., Lee J.E., Yoo J.Y. A systematic review of the effectiveness of lifestyle interventions for improving bone health in women at high risk of osteoporosis. JBI Libr. Syst. Rev. 2012;10:1738–1784. doi: 10.11124/01938924-201210300-00001. - DOI - PubMed
    1. Reid I.R., McClung M.R. Osteopenia: A key target for fracture prevention. Lancet Diabetes Endocrinol. 2024;12:856–864. doi: 10.1016/S2213-8587(24)00225-0. - DOI - PubMed

LinkOut - more resources