

Validation of Monilinia fructicola Putative Effector Genes in Different Host Peach (Prunus persica) Cultivars and Defense Response Investigation
- PMID: 39852458
- PMCID: PMC11766245
- DOI: 10.3390/jof11010039
Validation of Monilinia fructicola Putative Effector Genes in Different Host Peach (Prunus persica) Cultivars and Defense Response Investigation
Abstract
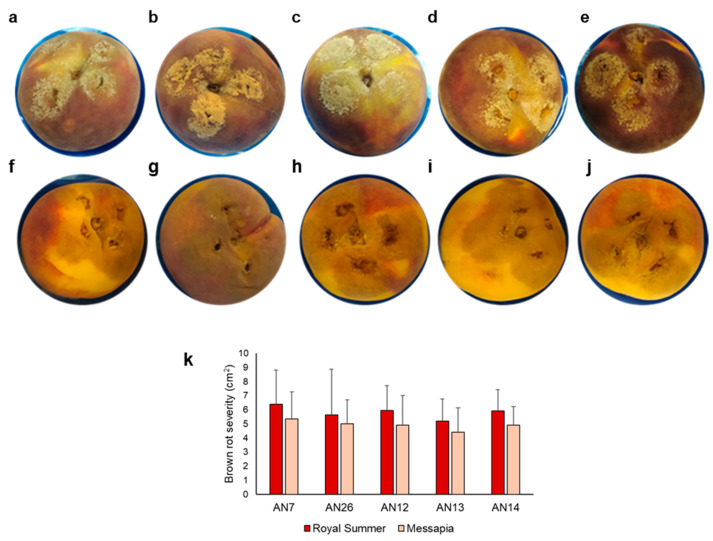
Monilinia fructicola is the most common and destructive brown rot agent on peaches. Knowledge of gene expression mediating host-pathogen interaction is essential to manage fungal plant diseases. M. fructicola putative virulence factors have been predicted by genome investigations. The pathogen interaction with the host was validated. Five M. fructicola isolates were inoculated on two cultivars (cv.s) of peach (Prunus persica (L.) Batsch) 'Royal Summer' and 'Messapia' with intermediate and late ripening periods, respectively. The expression pattern of 17 candidate effector genes of M. fructicola with functions linked to host invasion and fungal life, and seven peach genes involved in the immune defense system were monitored at 0, 2, 6, 10, and 24 h-post inoculation (hpi). All fungal isolates induced similar brown rot lesions on both cv.s whereas the modulation of effector genes was regulated mainly at 2, 6, and 10 hpi, when disease symptoms appeared on the fruit surface, confirming the involvement of effector genes in the early infection stage. Although differences were observed among the fungal isolates, the principal component investigation identified the main differences linked to the host genotype. The salicylic acid and jasmonate/ethylene signaling pathways were differently modulated in the host independent from the fungal isolate used for inoculation. On plants susceptible to brown rot, the pathogen may have adapted to the host's physiology by modulating its effectors as weapons.
Keywords: brown rot; defense genes; fungal effector proteins; gene expression; stone fruit.
Conflict of interest statement
The authors declare no conflicts of interest.
Figures


Similar articles
-
First Report of Brown Rot Caused by Monilinia fructicola Affecting Peach Orchards in Slovenia.Plant Dis. 2010 Sep;94(9):1166. doi: 10.1094/PDIS-94-9-1166A. Plant Dis. 2010. PMID: 30743694
-
First Report of Peach Brown Rot Caused by Monilinia fructicola in Central and Western China.Plant Dis. 2013 Sep;97(9):1255. doi: 10.1094/PDIS-03-13-0310-PDN. Plant Dis. 2013. PMID: 30722445
-
Global Transcriptome Analysis of the Peach (Prunus persica) in the Interaction System of Fruit-Chitosan-Monilinia fructicola.Plants (Basel). 2024 Feb 20;13(5):567. doi: 10.3390/plants13050567. Plants (Basel). 2024. PMID: 38475414 Free PMC article.
-
First Report of Brown Rot Caused by Monilinia fructicola on Various Stone and Pome Fruits in the Czech Republic.Plant Dis. 2007 Jul;91(7):907. doi: 10.1094/PDIS-91-7-0907B. Plant Dis. 2007. PMID: 30780411
-
First Report of Asiatic Brown Rot Caused by Monilinia polystroma on Peach in Italy.Plant Dis. 2014 Nov;98(11):1585. doi: 10.1094/PDIS-05-14-0551-PDN. Plant Dis. 2014. PMID: 30699815
References
-
- Byrde R.J.W., Willetts H.J. The Brown Rot Fungi of Fruit—Their Biology and Control. Pergamon Press; New York, NY, USA: 1977.
-
- Casals C., Torres R., Teixidó N., De Cal A., Segarra J., Usall J. Brown rot on stone fruit: From epidemiology studies to the development of effective control strategies. Sci. Hortic. 2022;301:111096. doi: 10.1016/j.scienta.2022.111096. - DOI
-
- Van Leeuwen G.C.M., Baayen R.P., Jeger M.J. Pest risk assessment for the countries of the European Union (as PRA area) on Monilinia fructicola. EPPO Bull. 2001;31:481–487. doi: 10.1111/j.1365-2338.2001.tb01030.x. - DOI
-
- Usall J., Casals C., Sisquella M., Palou L., De Cal A. Alternative technologies to control postharvest diseases of stone fruits. Stewart Postharvest Rev. 2015;11:2. doi: 10.2212/spr.2015.4.2. - DOI
-
- Mustafa M.H., Bassi D., Corre M.N., Lino L.O., Signoret V., Quilot-Turion B., Cirilli M. Phenotyping brown rot susceptibility in stone fruit: A literature review with emphasis on peach. Horticulturae. 2021;7:115. doi: 10.3390/horticulturae7050115. - DOI
LinkOut - more resources
Full Text Sources
