

Metabolomics and Transcriptomics Reveal the Effects of Different Fermentation Times on Antioxidant Activities of Ophiocordyceps sinensis
- PMID: 39852470
- PMCID: PMC11766798
- DOI: 10.3390/jof11010051
Metabolomics and Transcriptomics Reveal the Effects of Different Fermentation Times on Antioxidant Activities of Ophiocordyceps sinensis
Abstract
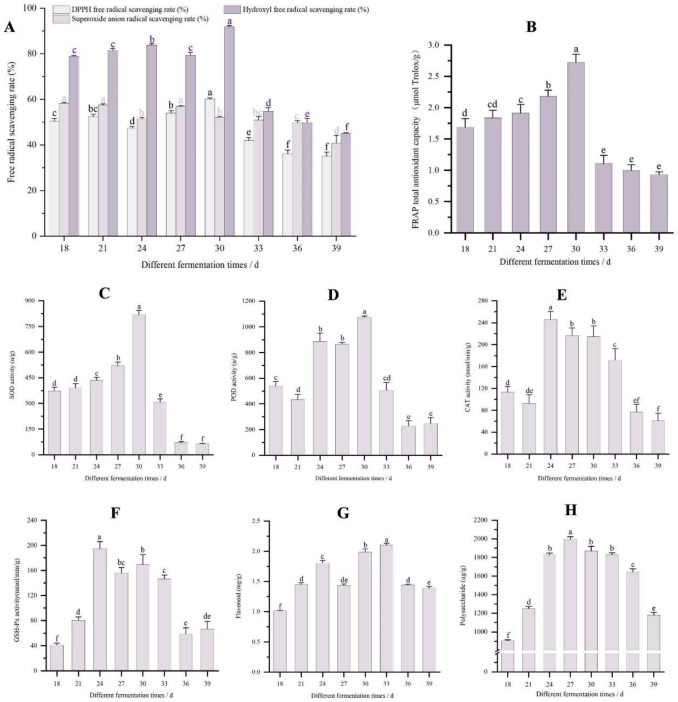
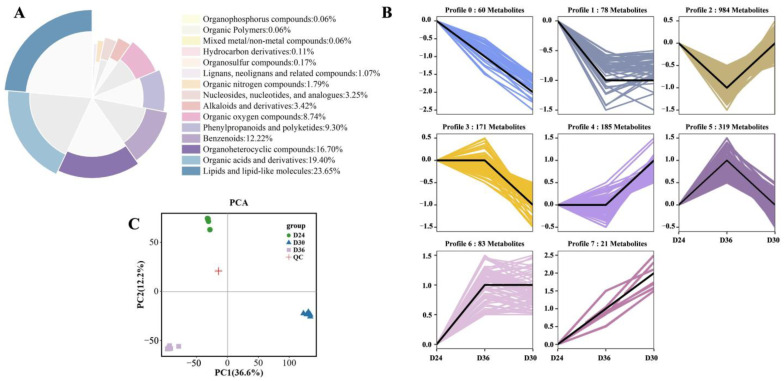
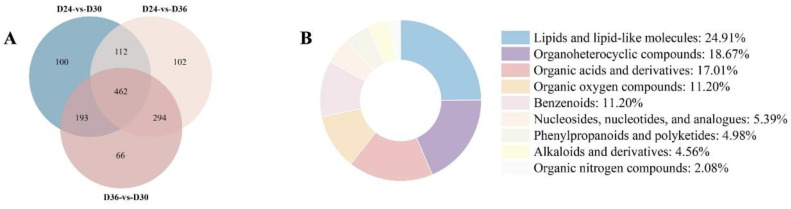
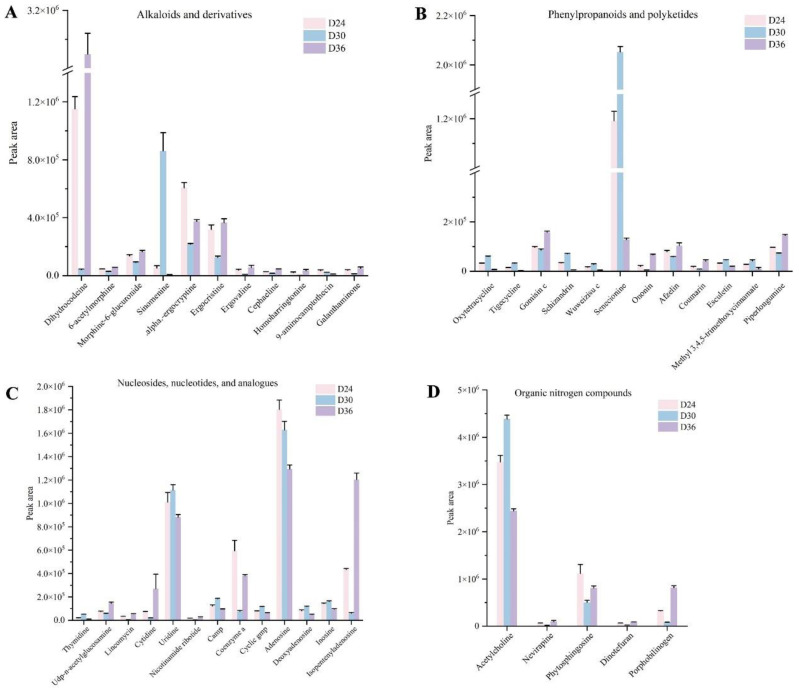
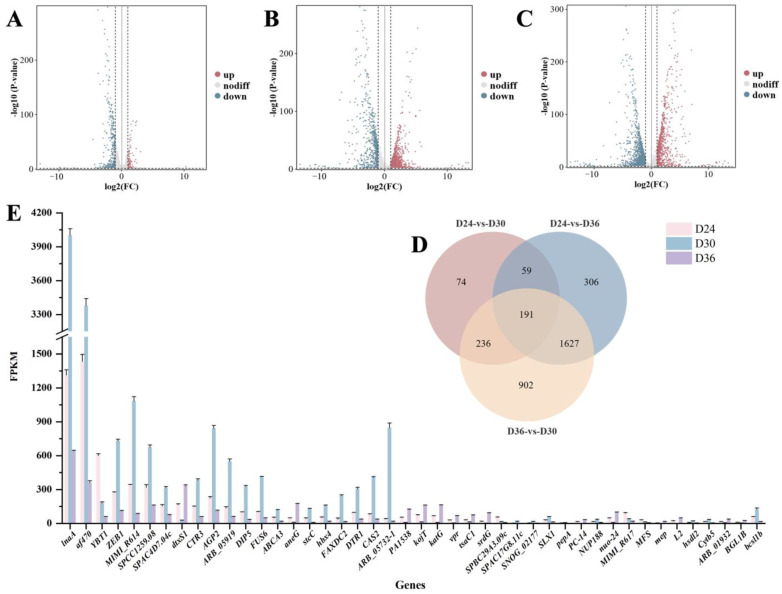
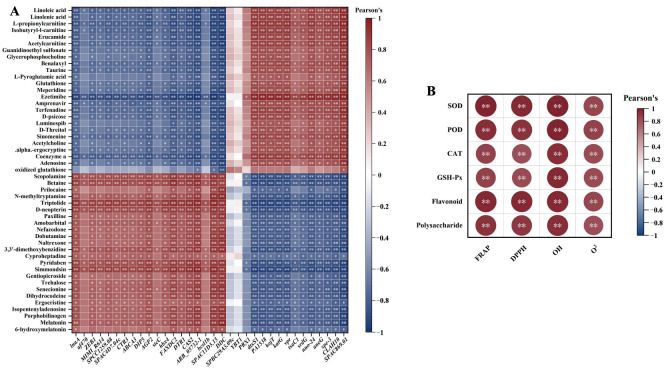
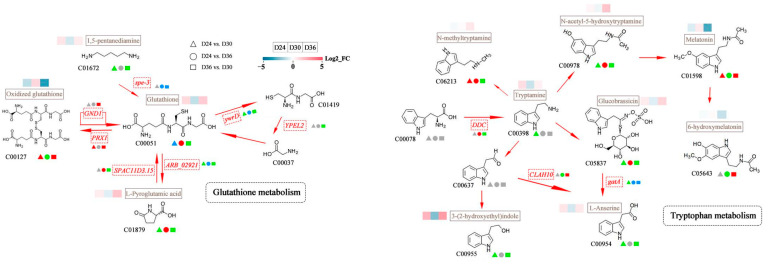
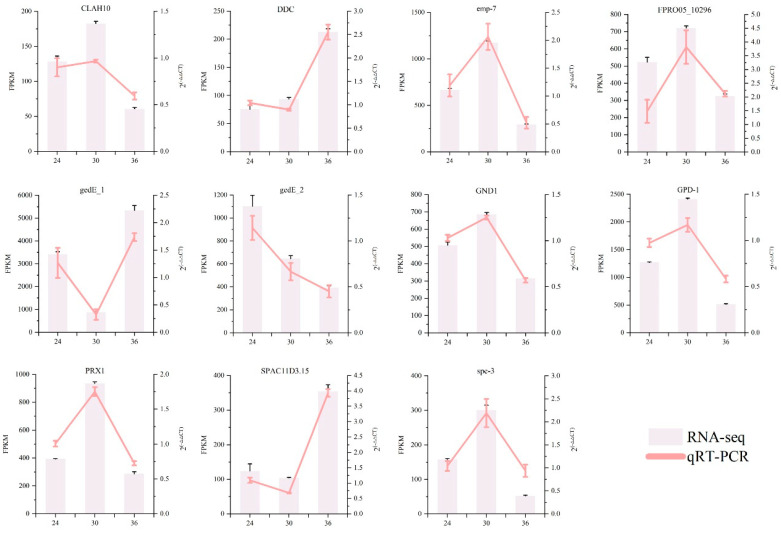
Ophiocordyceps sinensis is a fungus that is cultured through fermentation from wild Chinese cordyceps. While studies have examined its metabolites, the evaluation of its antioxidant capacity remains to be conducted. The antioxidant results of O. sinensis indicate that the ferric ion-reducing antioxidant power (FRAP), antioxidant capacity (2.74 ± 0.12 μmol Trolox/g), 2,2-diphenyl-1-picrylhydrazyl (DPPH•) free radical scavenging rate (60.21 ± 0.51%), and the hydroxyl free radical scavenging rate (91.83 ± 0.68%) reached a maximum on day 30. Using LC-MS/MS to measure the metabolites on D24, D30, and D36, we found that the majority of the differential accumulated metabolites (DAMs) primarily accumulate in lipids, organoheterocyclic compounds, and organic acids and their derivatives. Notably, the DAMs exhibiting high peaks include acetylcarnitine, glutathione, linoleic acid, and L-propionylcarnitine, among others. The transcriptome analysis results indicate that the differentially expressed genes (DEGs) exhibiting high expression peaks on D30 primarily included lnaA, af470, and ZEB1; high expression peaks on D24 comprised SPBC29A3.09c and YBT1; high expression peaks on D36 included dtxS1, PA1538, and katG. The combined analysis revealed significant and extremely significant positive and negative correlations between all the DAMs and DEGs. The primary enriched pathways (p < 0.05) included glutathione metabolism, tryptophan metabolism, carbon metabolism, biosynthesis of secondary metabolites, and phenylalanine metabolism. The metabolic pathway map revealed that the DAMs and DEGs influencing the antioxidant activity of O. sinensis were significantly up-regulated on D30 but down-regulated on D36. The correlation analysis suggests that an increase in the content of DEGs and DAMs promotes an increase in the levels of enzyme and non-enzyme substances, ultimately enhancing the antioxidant capacity of O. sinensis. These findings serve as a reference of how DAMs and DEGs affect the antioxidant activity of O. sinensis. This may contribute to the enhanced development and application of O. sinensis.
Keywords: LC-MS/MS; Ophiocordyceps sinensis; antioxidant activity; transcriptome; untargeted metabolomics.
Conflict of interest statement
The authors declare no conflicts of interest.
Figures
Similar articles
-
Analysis of Metabolic Profiles and Antioxidant Activity of Chinese Cordyceps, Ophiocordyceps sinensis, and Paecilomyces hepiali Based on Untargeted Metabolomics.Biology (Basel). 2024 Aug 31;13(9):683. doi: 10.3390/biology13090683. Biology (Basel). 2024. PMID: 39336110 Free PMC article.
-
Metabolite profiling and antioxidant capacity of natural Ophiocordyceps gracilis and its cultures using LC-MS/MS-based metabolomics: Comparison with Ophiocordyceps sinensis.Phytochem Anal. 2024 Mar;35(2):308-320. doi: 10.1002/pca.3289. Epub 2023 Oct 1. Phytochem Anal. 2024. PMID: 37779226
-
Integrated metabolomics and transcriptomics reveal metabolites difference between wild and cultivated Ophiocordyceps sinensis.Food Res Int. 2023 Jan;163:112275. doi: 10.1016/j.foodres.2022.112275. Epub 2022 Nov 29. Food Res Int. 2023. PMID: 36596185
-
A Systematic Review of the Mysterious Caterpillar Fungus Ophiocordyceps sinensis in Dong-ChongXiaCao ( Dōng Chóng Xià Cǎo) and Related Bioactive Ingredients.J Tradit Complement Med. 2013 Jan;3(1):16-32. doi: 10.4103/2225-4110.106538. J Tradit Complement Med. 2013. PMID: 24716152 Free PMC article. Review.
-
The Mechanisms of Pharmacological Activities of Ophiocordyceps sinensis Fungi.Phytother Res. 2016 Oct;30(10):1572-1583. doi: 10.1002/ptr.5673. Epub 2016 Jul 3. Phytother Res. 2016. PMID: 27373780 Review.
Cited by
-
Multiomics Provides a New Understanding of the Effect of Temperature Change on the Fermentation Quality of Ophiocordyceps sinensis.J Fungi (Basel). 2025 May 23;11(6):403. doi: 10.3390/jof11060403. J Fungi (Basel). 2025. PMID: 40558916 Free PMC article.
-
Integrated Multi-Omics Analysis to Investigate the Molecular Mechanisms Underlying the Response of Auricularia heimuer to High-Temperature Stress.J Fungi (Basel). 2025 Feb 20;11(3):167. doi: 10.3390/jof11030167. J Fungi (Basel). 2025. PMID: 40137205 Free PMC article.
-
Genomic and Multi-Omics Analysis of Phlebopus portentosus: Effects of Cultivation on Secondary Metabolites.J Fungi (Basel). 2025 Apr 18;11(4):323. doi: 10.3390/jof11040323. J Fungi (Basel). 2025. PMID: 40278143 Free PMC article.
References
LinkOut - more resources
Full Text Sources
Miscellaneous
