Review
. 2025 Jan 9;17(1):30.
doi: 10.3390/toxins17010030.

Species Differences in the Biotransformation of Aflatoxin B1: Primary Determinants of Relative Carcinogenic Potency in Different Animal Species

Affiliations
Review

Species Differences in the Biotransformation of Aflatoxin B1: Primary Determinants of Relative Carcinogenic Potency in Different Animal Species

David L Eaton et al. Toxins (Basel). .

Abstract

It has been known since the early days of the discovery of aflatoxin B1 (AFB1) that there were large species differences in susceptibility to AFB1. It was also evident early on that AFB1 itself was not toxic but required bioactivation to a reactive form. Over the past 60 years there have been thousands of studies to delineate the role of ~10 specific biotransformation pathways of AFB1, both phase I (oxidation, reduction) and phase II (hydrolysis, conjugation, secondary oxidations, and reductions of phase I metabolites). This review provides a historical context and substantive analysis of each of these pathways as contributors to species differences in AFB1 hepatoxicity and carcinogenicity. Since the discovery of AFB1 as the toxic contaminant in groundnut meal that led to Turkey X diseases in 1960, there have been over 15,000 publications related to aflatoxins, of which nearly 8000 have addressed the significance of biotransformation (metabolism, in the older literature) of AFB1. While it is impossible to give justice to all of these studies, this review provides a historical perspective on the major discoveries related to species differences in the biotransformation of AFB1 and sets the stage for discussion of other papers in this Special Issue of the important role that AFB1 metabolites have played as biomarkers of exposure and effect in thousands of human studies on the toxic effects of aflatoxins. Dr. John Groopman has played a leading role in every step of the way-from initial laboratory studies on specific AFB1 metabolites to the application of molecular biomarkers in epidemiological studies associating dietary AFB1 exposure with liver cancer, and the design and conduct of chemoprevention clinical trials to reduce cancer risk from unavoidable aflatoxin exposures by alteration of specific AFB1 biotransformation pathways. This article is written in honor of Dr. Groopman's many contributions in this area.

Keywords: aflatoxin; biomarkers; biotransformation; cytochrome P450; glutathione S-transferase; species differences.


Conflict of interest statement

The authors declare no conflicts of interest.

Figures

Figure 1
Figure 1
Basic steps in the oxidation of AFB1 to various metabolites. The human enzymes, where known, catalyzing these oxidations are listed. Each oxidation step shown in Figure 1 is discussed in detail below, with a focus on understanding important species differences in each oxidation step, as well as the specific enzyme isoforms that contribute to each reaction.
Figure 2
Figure 2
Hepatic microsomal oxidation of AFB1 to various oxidative metabolites in different species. The initial rates of formation (Vo) were determined in hepatic microsomes from rat, mouse, monkey, and human microsomes under identical experimental conditions. AFBO was determined by trapping as the GSH conjugate using BHA-induced mouse liver cytosol, which contains a high level of mGSTA3-3. Each metabolite was separated and quantitated by HPLC. Rates of AFBO formation as a percentage of that observed with rat liver microsomes are also shown. The rates of formation of AFQ1, AFM1, and AFP1 were calculated as a percentage of the rate of epoxidation observed for the respective species; these values are shown above each column. (From Ramsdell and Eaton [16]). Reprinted under AACR copyright permissions to authors.
Figure 3
Figure 3
AFB1 metabolite distribution at 1 μM and 10 μM in mouse, rat, and human hepatocytes. Isolated hepatocytes from each species were incubated for 4 h in cell culture medium. Metabolites were identified by HPLC-MS/MS. (From: Gerdemann et al. [6]; figure is reprinted under Creative Commons Attribution 4.0 International License).
Figure 4
Figure 4
Immuno-inhibition experiments using anti-peptide antiserum against turkey P450s 1A5 and 3A37 demonstrating the relative contribution of P450 1A5 and 3A37 toward AFB1 epoxidation in turkey liver microsomes. Inhibitory effects of anti-P450 1A5 and 3A37 immune serum (5 μg/mL/nmol P450). Initial rates of exo-AFBO formation in the presence of antiserum were calculated as percentage control (treatment with pre-immune serum only). Mean ± SD. (N = 3). From: Rawl and Coulombe, [85]. Reprinted under Open Access Creative Commons Attribution.
Figure 5
Figure 5
Phase II hydrolysis and conjugation reactions of phase I oxidation products of AFB1 biotransformation.
Figure 6
Figure 6
Effects of co-expression of human mEH on AFB-DNA adducts in yeast also co-expressing hCYP1A2 to activate AFB1 to AFBO. Two concentrations of AFB1 were used to expose yeast cells containing human CYP1A2 and mEH cDNAs (adapted from Kelly et al. [138]. * Co-expression of mEH blocked DNA adduction with significant effect (p < 0.05) at 1.25 mM AFB. Data are mean 6 SEM from samples analyzed in triplicate. (Figure available under Creative Commons Attribution 4.0 International license).
Figure 7
Figure 7
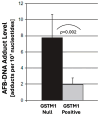
Modulation of AFB-DNA adduct formation in the context of the GSTM1 genotype status. A total of 11 different hepatocyte preparations were examined for AFB-DNA binding. Six of the samples were GSTM1-null and five were GSTM1-positive. AFB-DNA adducts per 107 nucleotides were calculated and are shown. Each bar represents the mean and SEM. Statistical significance was determined by unpaired t-test with equal variances. Adapted from: Gross-Steinmeyer et al. [157]. Reprinted with permission from Oxford Press, Oxford, UK OX2 6DP; license #5923750542730, 7 December 2024.
Figure 8
Figure 8
AFB-DNA adduct formation in mGstA3 knockout mice and wild-type. Mice (5 mGstA3 KO and 5 WT, 6 months of age, all males) were injected with a single dose of 5 mg/kg AFB1, dissolved in DMSO, in a volume of 100 μL/30 g of mouse weight, and euthanized 3 h later. Redrawn from: Ilic et al. [173], with permission from Elsevier Press, Berkeley, CA; license # 5923751463839, 7 December 2024.
Figure 9
Figure 9
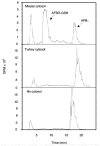
Reverse-phase HPLC radiochromatograms of cytosolic GST conjugation of AFBO in mouse and turkey. The top panel shows [3H]-AFBO-GST activity of BHA-induced mouse liver cytosol (500 mg protein) for comparison. The middle panel show the lack of GST-mediated [3H]-AFBO-conjugating ability of turkey hepatic cytosol (1200 mg protein). A control incubation with no cytosol is also presented (bottom panel). Even when a wide range of turkey cytosolic protein concentrations (400–1200 mg) was used, no GST-mediated trapping was detected [78]. Reprinted with permission from Elsevier Press, Berkeley, CA 94704, license # 5923770700438, 7 December 2024.
Figure 10
Figure 10
Timeline of research interest in aflatoxins, as indicated by the number of scientific publications each year from 1963 to December 2024. Data from a PubMed search on the term “aflatoxin” or “aflatoxins”.
Figure 11
Figure 11
Publication and citation history of Dr. John Groopman’s contributions to the past 45 years of aflatoxin research, including many papers related to species differences in biotransformation. (Figure developed from data obtained from a Web of Science citation search on “John D. Groopman” and “aflatoxins”).

Similar articles

Cited by

References

    1. Ayres J.L., Lee D.J., Wales J.H., Sinnhuber R.O. Aflatoxin structure and hepatocarcinogenicity in rainbow trout (Salmo gairdneri) J. Natl. Cancer Inst. 1971;46:561–564. - PubMed
    1. Lee D.J., Wales J.H., Sinnhuber R.O. Promotion of aflatoxin-induced hepatoma growth in trout by methyl malvalate and sterculate. Cancer Res. 1971;31:960–963. - PubMed
    1. Wogan G.N., Newberne P.M. Dose-response characteristics of aflatoxin B1 carcinogenesis in the rat. Cancer Res. 1967;27:2370–2376. - PubMed
    1. Wogan G.N., Paglialunga S., Newberne P.M. Carcinogenic effects of low dietary levels of aflatoxin B1 in rats. Food Cosmet. Toxicol. 1974;12:681–685. doi: 10.1016/0015-6264(74)90239-9. - DOI - PubMed
    1. Roebuck B.D., Wogan G.N. Species comparison of in vitro metabolism of aflatoxin B1. Cancer Res. 1977;37:1649–1656. - PubMed

LinkOut - more resources