. 2025 Mar 3;222(3):e20230647.
doi: 10.1084/jem.20230647. Epub 2025 Jan 24.

RNase T2 deficiency promotes TLR13-dependent replenishment of tissue-protective Kupffer cells

Affiliations

RNase T2 deficiency promotes TLR13-dependent replenishment of tissue-protective Kupffer cells

Ryota Sato et al. J Exp Med. .

Abstract

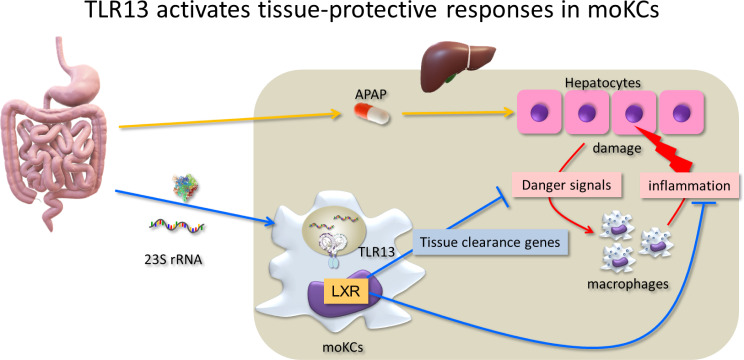
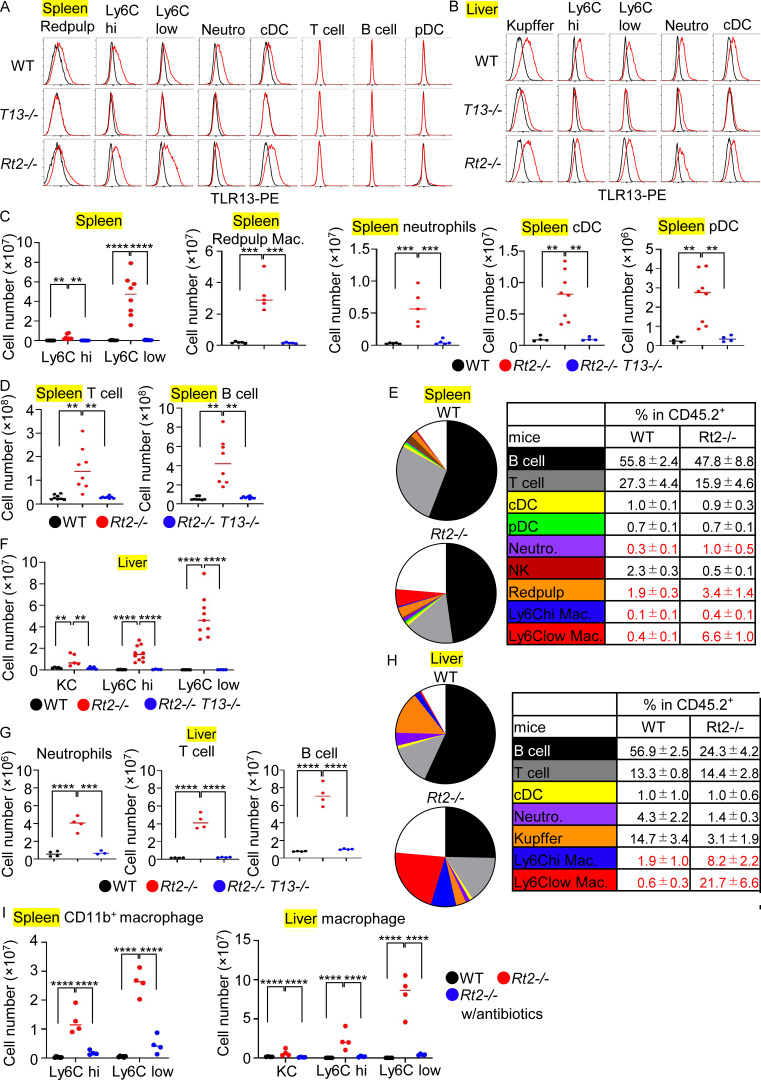
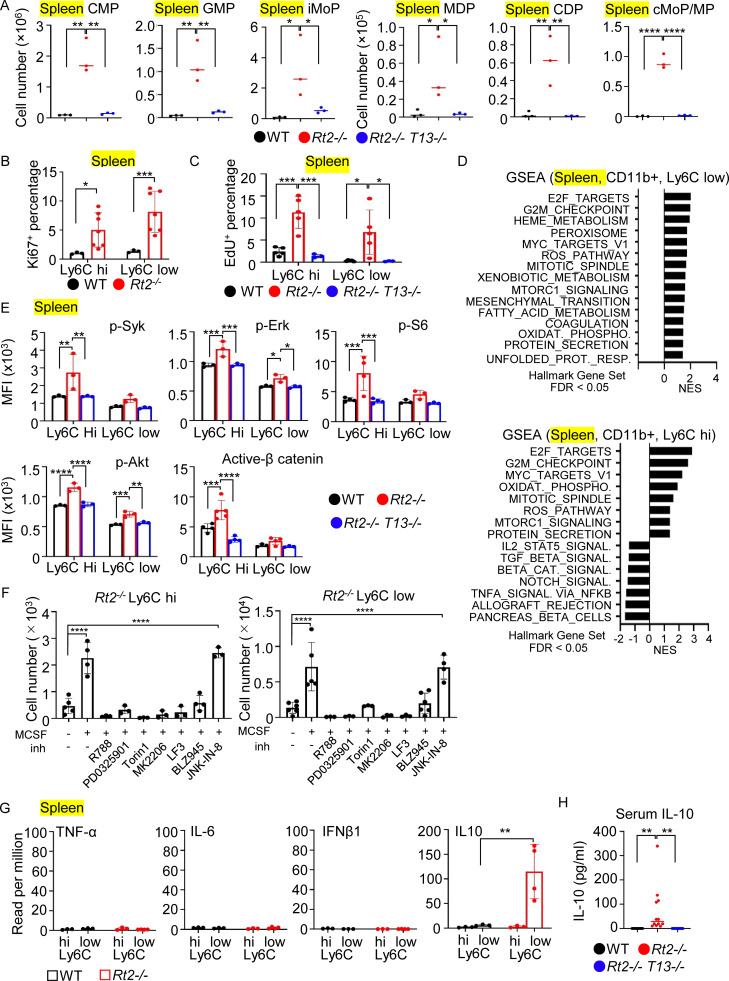
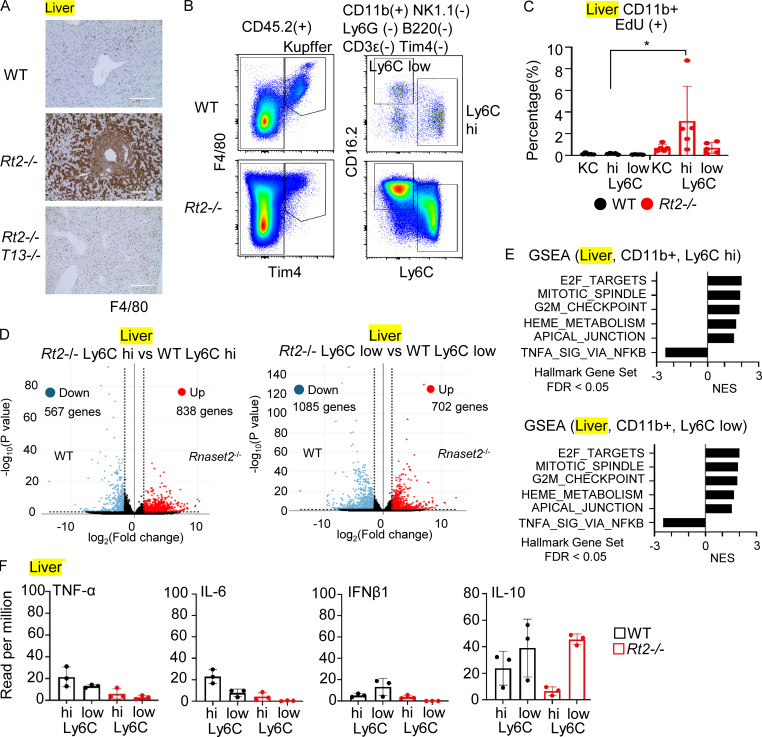
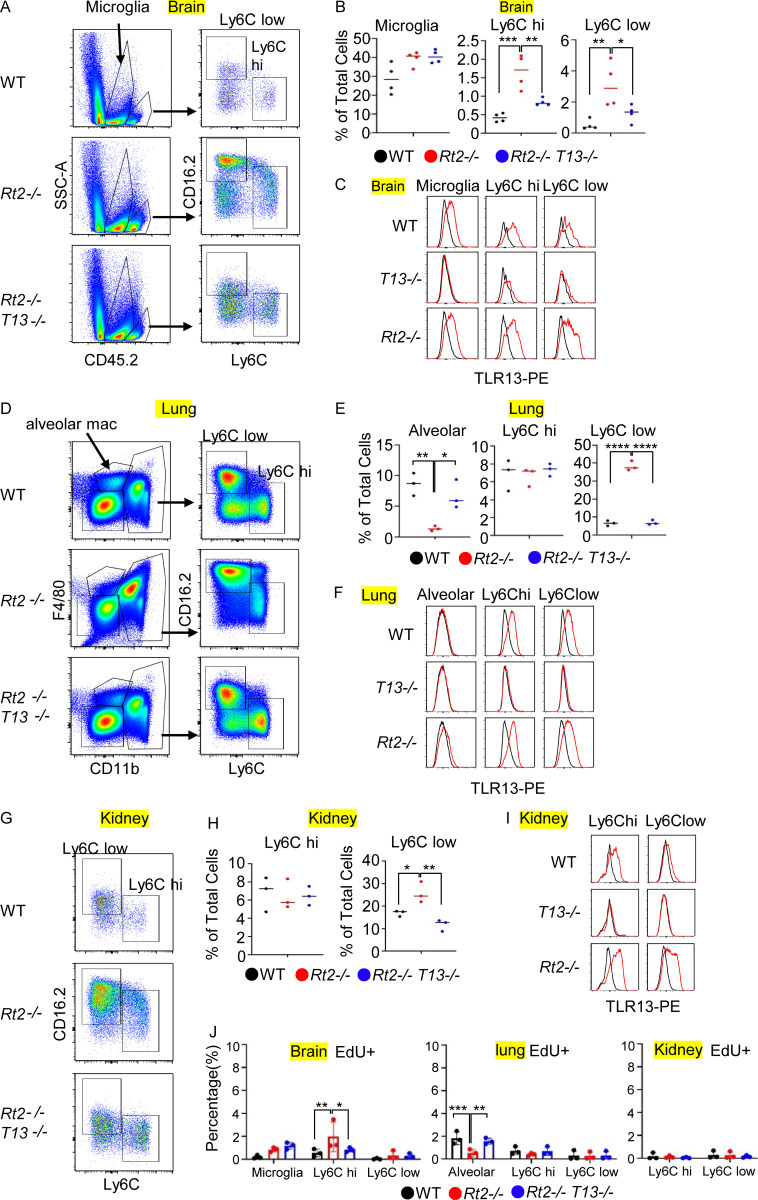
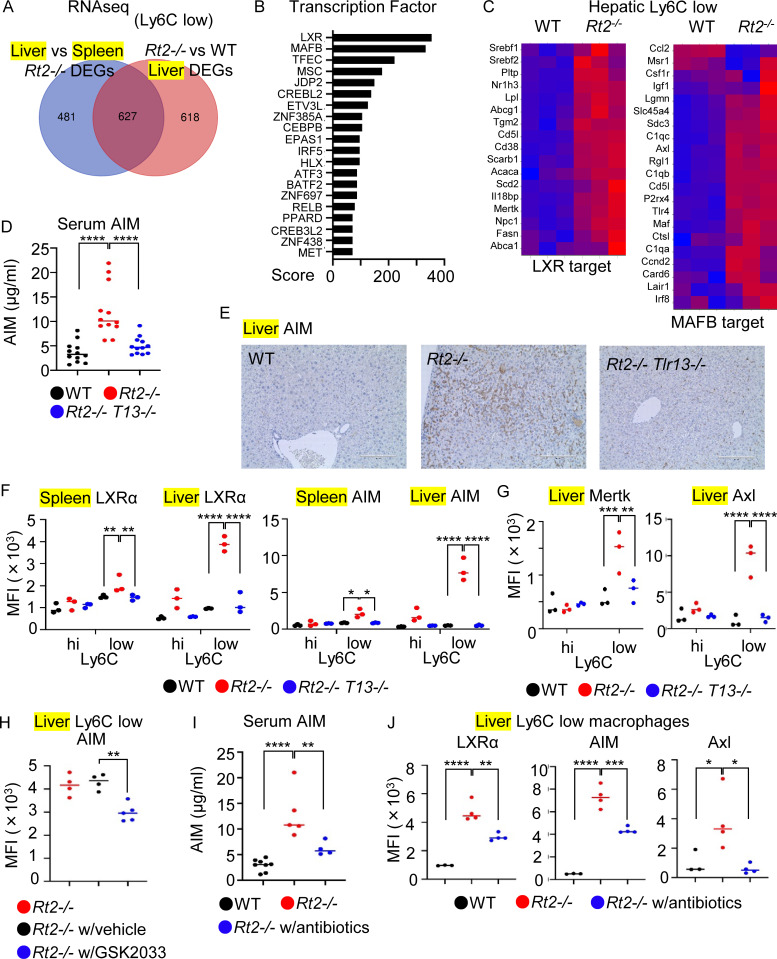
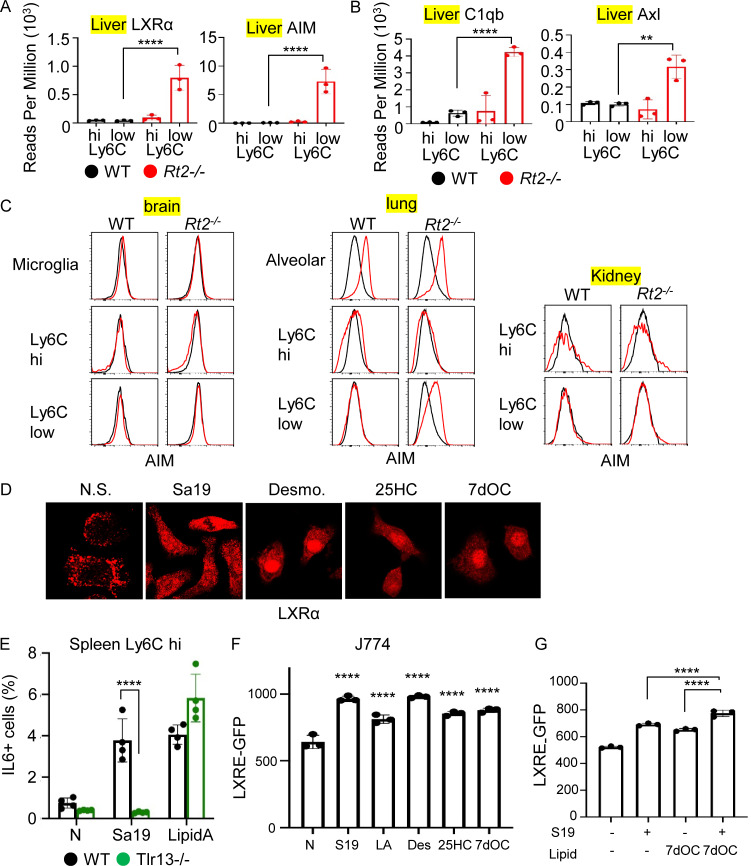
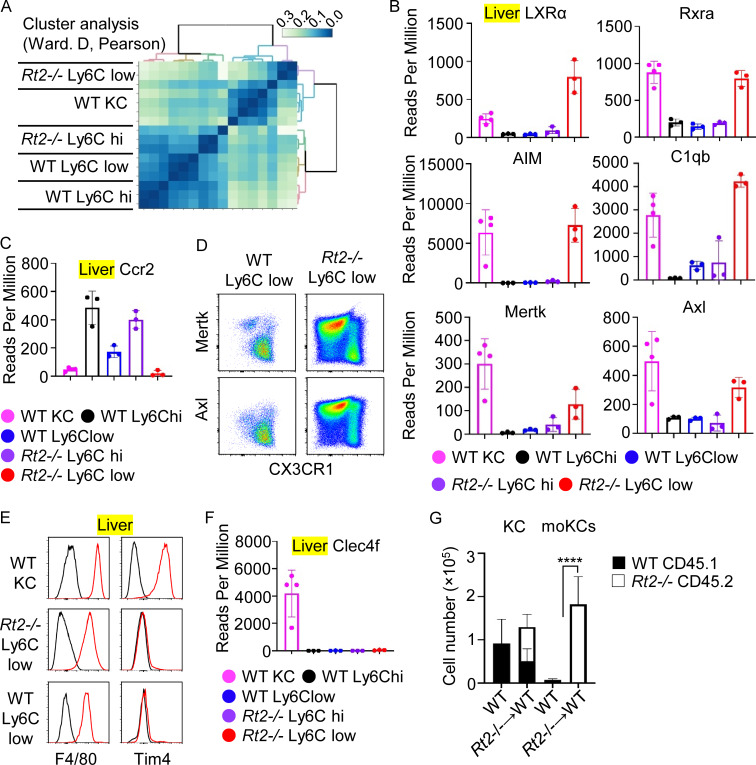
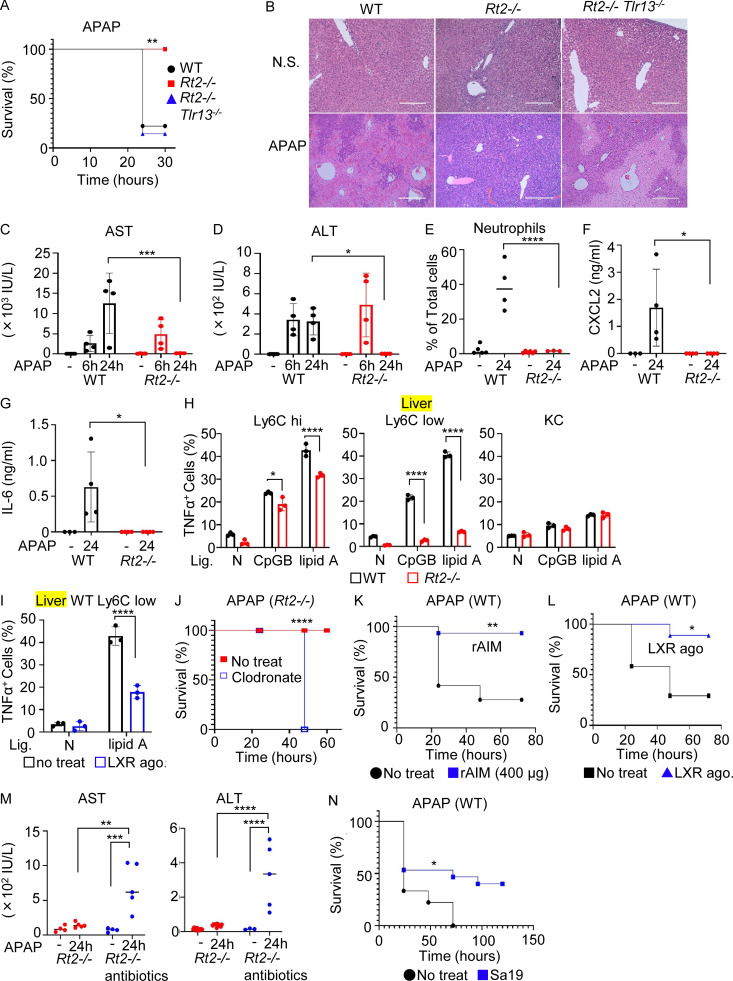
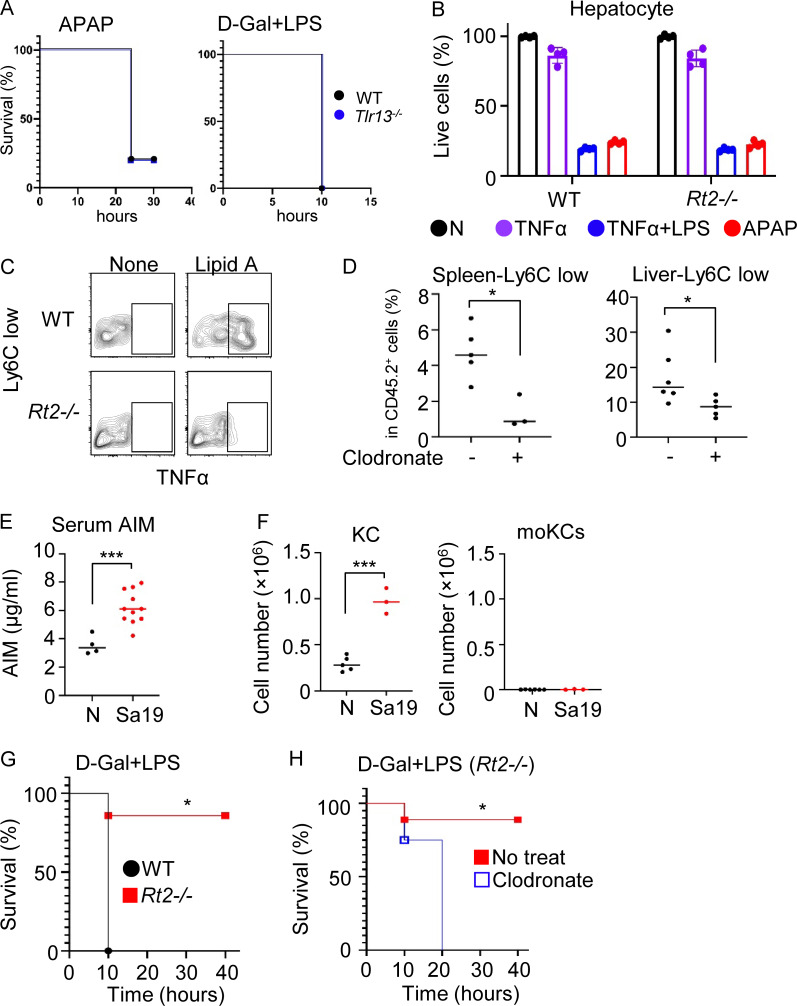
Lysosomal stress due to the accumulation of nucleic acids (NAs) activates endosomal TLRs in macrophages. Here, we show that lysosomal RNA stress, caused by the lack of RNase T2, induces macrophage accumulation in multiple organs such as the spleen and liver through TLR13 activation by microbiota-derived ribosomal RNAs. TLR13 triggered emergency myelopoiesis, increasing the number of myeloid progenitors in the bone marrow and spleen. Splenic macrophages continued to proliferate and mature into macrophages expressing the anti-inflammatory cytokine IL-10. In the liver, TLR13 activated monocytes/macrophages to proliferate and mature into monocyte-derived KCs (moKCs), in which, the liver X receptor (LXR) was activated. In accumulated moKCs, tissue clearance genes such as MerTK, AXL, and apoptosis inhibitor of macrophage (AIM) were highly expressed, while TLR-dependent production of proinflammatory cytokines was impaired. Consequently, Rnaset2-/- mice were resistant to acute liver injuries elicited by acetaminophen (APAP) and LPS with D-galactosamine. These findings suggest that TLR13 activated by lysosomal RNA stress promotes the replenishment of tissue-protective Kupffer cells.


Conflict of interest statement

Disclosures: R. Fukui reported grants from Daiichi Sankyo outside the submitted work. No other disclosures were reported.

Figures

None
Graphical abstract
Figure S1.
Figure S1.
Analyses of Tlr13 −/− , Rnaset2 −/− , and Rnaset2 −/− Tlr13 −/− mice. (A) Survival curve of wild-type mice (black) and Rnaset2−/− mice (red). (B) Schematic representation of Tlr13 gene targeting. The filled and open boxes represent coding and 3′-untranslated regions of the Tlr13 gene, respectively. Neo indicates the neomycin resistance gene: B, BamH I; and E, EcoR I. (C) PCR analyses with primers indicated in B to determine genotypes of indicated mice. (D) Production of IL-6 and CCL5 by BM-derived macrophages left unstimulated or stimulated with indicated TLR ligands. Results represent mean values with SD from triplicates. (E) Hb concentration, hematocrit, and mean corpuscular volume of RBCs in indicated mice (n = 8–16). (F) Percentage of IL-6+ cells in splenic Ly6Clow or Ly6Chi macrophages from wild-type mice with or without antibiotics treatment after in vitro stimulation with the TLR13 ligand Sa19 (5 µg/ml) or the TLR4 ligand lipid A (1 µg/ml) together with Brefeldin A for 3 h (n = 3). (G) Immunoblotting of whole cell lysates from wild-type and Rnaset2−/− Ba/F3 with anti-RNase T2 mAb. β-actin was also immunoprobed to show that the amounts of samples are equal. (H) Ba/F3 expressing Tlr3, Tlr7, or Tlr13-HA tag were subjected to membrane-permeabilized staining with mAbs to TLR3 (PaT3), TLR7 (A94B10), TLR13 (M13), and αHA. (I and J) The gating strategy of splenic cells (I) and hepatic cells (J). (K) Serum titer of autoantibodies to SSA, Sm, and dsDNAs in indicated mice (n = 8–26). (L) The numbers of CD11b+ Ly6Chi and CD11b+ Ly6Clow macrophages in the spleens of indicated mice (n = 5–8). *P < 0.05, **P < 0.01, ***P < 0.001 and ****P < 0.0001. Source data are available for this figure: SourceData FS1.
Figure 1.
Figure 1.
TLR13 responses to bacterial rRNAs drive hepatosplenomegaly. (A) Spleen photograph and splenic weights of wild-type (WT), Rt2−/− (Rnaset2−/−), Rt2−/−Unc93b1−/− (U93), Rt2−/−Tlr3−/− (T3), Rt2−/−Tlr7−/− (T7), and Rt2−/−Tlr13−/− (T13) mice (n = 8–25). (B) Liver photograph and liver weights of indicated mice (n = 10–25). (C) Platelet counts of indicated mice (n = 4–25). (D) RNA concentrations of lysosomal fractions from spleen and liver of wild-type and Rt2−/− mice. (E) PCR amplification of 23S rRNA of Lactobacillus helveticus and Lactococcus lactis. PCR templates were fecal DNA and cDNAs prepared from lysosomal RNAs from D. (F) Dot plots show weights of spleen and liver from wild-type and Rt2−/− mice with or without antibiotic treatment (n = 4–6). (G) Schematic diagram of fragments derived from E. coli 23S rRNA. The red triangle denotes the minimal 12-mer sequence to activate TLR13. Ba/F3 cells expressing TLR13, Unc93b1, and NFκB-GFP were stimulated with modified Sa19 (S-oligo), Sa19, and rRNA fragments of indicated length at 25 µg/ml. Red and gray histograms show GFP expression in wild-type and Rt2−/− Ba/F3 cells left unstimulated (black) and stimulated with indicated ssRNA for 24 h (red). *P < 0.05, **P < 0.01, ***P < 0.001 and ****P < 0.0001. Source data are available for this figure: SourceData F1.
Figure 2.
Figure 2.
TLR13-dependent macrophage accumulation in the spleen and liver. (A and B) TLR13 expression in indicated immune cells in the spleen (A) and liver (B) of indicated mice. Red and black histograms show staining with anti-TLR13 mAb and isotype-matched antibody, respectively. (C and D) The cell numbers of indicated immune cells in the spleen from indicated mice (n = 5–8). (E and H) The percentages of indicated immune cells in the spleen and liver of wild-type and Rt2−/− mice. (F and G) The cell numbers of indicated immune cells in the liver in indicated mice (n = 5–8). (I) The cell numbers of splenic or hepatic macrophages in indicated mice with or without antibiotics treatment (n = 4). **P < 0.01, ***P < 0.001 and ****P < 0.0001.
Figure S2.
Figure S2.
TLR13 responses in the BM , spleen, and liver of Rnaset2 −/− mice. (A) The numbers of monocyte/DC progenitors in the BM of indicated mice (n = 3–4). (B) The numbers of monocyte/DC progenitors in the spleen of WT and Slc29a3−/− mice (n = 3–4). (C) Dot plots show the expression of Ki67 and CD16.2 in splenic macrophages from WT and Rnaset2−/− mice. (D and E) Volcano plots displaying log2 fold change of expression (x axes) and log10 normalized expression (y axes) for the comparison of splenic Ly6Chi macrophages from Rnaset2−/− mice versus those from wild-type mice (n = 3) (D), and that of splenic Ly6Clow macrophages from Rnaset2−/− mice versus those from wild-type mice (n = 3–4) (E). (F) Bars show the numbers of Ly6Chi and Ly6Clow macrophages from indicated mice that survived in vitro 3 days culture with M-CSF (0, 1, 3, 5 ng/ml). (G and H) Bars and dots show reads per million (RPM) of indicated ISGs in indicated splenic and liver macrophages (n = 3–4). *P < 0.05, **P < 0.01, ***P < 0.001 and ****P < 0.0001.
Figure 3.
Figure 3.
Emergency myelopoiesis, macrophage proliferation, and Il-10 production in the spleen. (A) The numbers of monocyte/DC progenitors in the spleen of indicated mice (n = 3). (B and C) The percentages of Ki67+ and EdU+ cells in splenic Ly6Chi and Ly6Clow macrophages from indicated mice (n = 7). (D) GSEA of genes with >1.5-fold changes in comparison of splenic Ly6Chi and Ly6Clow macrophages from Rt2−/− mice versus those from wild-type mice. The bars indicate normalized enrichment scores (NESs) of hallmark gene sets with FDR < 0.05. (E) Mean fluorescence intensity (MFI) values of flow cytometry staining of splenic Ly6Chi and Ly6Clow macrophages from indicated mice with antibodies to indicated signaling molecules (n = 3–5). (F) Bars show the numbers of splenic Ly6Chi and Ly6Clow macrophages from Rt2−/− mice that survived in vitro 3 days culture with M-CSF (5 ng/ml) and indicated inhibitors such as Syk (R788, 1 µM), MEK (PD0325901, 1 µM), mTOR (Torin 1, 0.25 µM), AKT (MK2266, 1 µM), β-catenin (LF3, 30 µM), and CSF1R (BLZ945, 1 µM), or JNK (JNK-IN-8, 1 µM). (G) Bars and dots show reads per million (RPM) of TNF-α, IL-6, IFNβ1, and IL10 in indicated splenic macrophages (n = 3–4). (H) Serum levels of IL-10 in indicated mice (n = 12–14). *P < 0.05, **P < 0.01, ***P < 0.001 and ****P < 0.0001.
Figure 4.
Figure 4.
TLR13-dependent macrophage proliferation in the liver. (A) Immunohistochemistry showing F4/80 expression in the livers of indicated mice. Scale bar, 200 μm. (B) FACS dot plots show expression of F4/80, Tim4, Ly6C, and CD16.2 in hepatic macrophages from indicated mice. (C) The percentages of the EdU+ cells in indicated hepatic macrophage subsets from indicated mice. (D) Volcano plots show log2 fold change of expression (x axes) and log10 normalized expression (y axes) for the comparisons of hepatic Ly6Chi and Ly6Clow macrophages from Rnaset2−/− mice versus those from wild-type mice (n = 3). Genes with >1.5-fold upregulated and downregulated expression are shown in red and blue, respectively. (E) GSEA of genes with >1.5-fold changes in comparison of hepatic Ly6Chi and Ly6Clow macrophages from Rnaset2−/− mice versus those from wild-type mice. The bars indicate normalized enrichment scores (NESs) of hallmark gene sets with FDR < 0.05. (F) Bars and dots show reads per million (RPM) of TNF-α, IL-6, IFNβ1, and IL10 in indicated splenic macrophages (n = 3). *P < 0.05.
Figure S3.
Figure S3.
TLR13 responses in various organs of Rnaset2 −/− . (A) Gating strategy to detect microglia, Ly6Chi, and Ly6Clow macrophages in the brains of indicated mice. (B) The percentages of F4/80+ CD45.2int microglia, Ly6Chi, and Ly6Clo macrophage in CD45+ cells from the brain of indicated mice (n = 4). (C, F, and I) TLR13 expression in indicated immune cells in the brain, lung, and kidney of indicated mice. Red and black histograms show staining with anti-TLR13 mAb and isotype-matched antibody, respectively. (D) Gating strategy to detect alveolar, Ly6Chi, and Ly6Clow macrophages from the lungs of indicated mice. (E) The percentages of F4/80+ CD11bint alveolar, Ly6Chi, and Ly6Clow macrophage in CD45+ cells from the lungs of indicated mice (n = 4). (G) Gating strategy to detect Ly6Chi and Ly6Clow macrophages from the kidneys of indicated mice. (H) The percentages of Ly6Chi and Ly6Clow macrophages in CD45+ cells from the kidney of indicated mice (n = 3). (J) The percentages of the EdU+ cells in indicated macrophage subsets from the indicated organs of indicated mice. *P < 0.05, **P < 0.01, ***P < 0.001 and ****P < 0.0001.
Figure 5.
Figure 5.
LXRα activation in hepatic Ly6C low macrophages of Rnaset2 −/− mice. (A) Venn diagrams show the numbers of DEGs in the comparisons of hepatic versus splenic Ly6Clow macrophages from Rt2−/− mice (blue) and of hepatic Ly6Clow macrophages from Rt2−/− mice versus those from wild-type mice. (B) Enrichr analyses of the 627 DEGs identified by the above two comparisons (A). (C) Heatmaps showing expression of LXR and MAFB target genes in hepatic Ly6Clow macrophages from indicated mice. (D) Serum levels of AIM in indicated mice (n = 12). (E) Immunohistochemistry of AIM expression in the liver of indicated mice. Scale bar, 200 µm. (F and G) Dot plots show the MFI values of indicated proteins in splenic and hepatic Ly6Clow macrophages from indicated mice. (H) MFI values of AIM in hepatic Ly6Clow macrophages with or without treatment of LXR inhibitor GSK 2033 (n = 4–5). (I and J) Serum levels of AIM and MFI values of LXRα, AIM and Axl of hepatic Ly6Clow macrophages in indicated mice with or without antibiotics (n = 5–8 for I, n = 3–4 for J). *P < 0.05, **P < 0.01, ***P < 0.001 and ****P < 0.0001.
Figure S4.
Figure S4.
TLR13 activates transcription factor LXRα in macrophages. (A and B) Bars show reads per million (RPM) of LXRα, AIM (A), C1qb, and Axl (B) in Ly6Chi and Ly6Clow macrophages from wild-type and Rnaset2−/− mice. (C) Histograms show staining with anti-AIM (red) and isotype-matched antibodies (black) in macrophages from the brain, lung, and kidney. (D) Localization of LXR in J774 cells left unstimulated or stimulated with the TLR13 ligand (Sa19) or LXR ligands such as Desmosterol, 25HC, and 7dOC. (E) The percentages of IL-6+ cells in splenic Ly6Chi macrophages from indicated mice after in vitro stimulation with the TLR13 ligand Sa19 (5 µg/ml) or the TLR4 ligand lipid A (1 µg/ml) together with Brefeldin A for 3 h. (F and G) MFI values of of GFP in LXRE-GFP-expressing J774 cells after stimulation with Sa19 (5 µg/ml), lipid A (1 µg/ml) and LXR agonists (10 µg/ml). **P < 0.01 and ****P < 0.0001.
Figure 6.
Figure 6.
Hepatic Ly6C low macrophages in Rnaset2 −/− mice are moKCs. (A) Cluster analyses of the genes expressed in Ly6Chi and Ly6Clow macrophages from wild-type and Rnaset2−/− mice (n = 3–4). (B, C, and F) Bars show reads per million (RPM) of indicated genes in indicated macrophages (n = 3–4). (D) Dot plots show expression of MerTK, Axl, and CX3CR1 in hepatic Ly6Clow macrophages from wild-type and Rnaset2−/− mice. (E) Red and black histograms show staining with antibodies to indicated molecules and isotype-matched control, respectively. (G) The numbers of KCs and moKCs in wild-type mice and those that were irradiated and received BM cells from Rnaset2−/− mice. Closed and open bars show the numbers of macrophages from wild-type (CD45.1) and Rnaset2−/− mice (CD45.2). ****P < 0.0001.
Figure 7.
Figure 7.
Rnaset2 −/− mice are resistant to acute liver injuries. (A) Survival curve of indicated mice with APAP challenge at 750 mg/kg (n = 11–15). (B) H&E staining of the liver of indicated mice 24 h after APAP challenge at 500 mg/kg. Scale bar, 400 µm. (C, D, F, and G) Dot plots show serum levels of AST (C), ALT (D), CXCL2 (F), and IL-6 (G) in indicated mice at 6 and 24 h after APAP challenge at 500 mg/kg (n = 4–6). (E) Dot plots show the percentages of neutrophils that infiltrated the liver in indicated mice 24 h after APAP challenge at 500 mg/kg (n = 4). (H) Percentage of TNF-α+ cells in indicated hepatic macrophage subsets from wild-type and Rt2−/− mice after in vitro culture with the TLR9 ligand CpG-B (200 nM) or the TLR4/MD-2 ligand lipid A (1 µg/ml) together with Brefeldin A for 3 h (n = 3). (I) Percentage of TNFα+ cells in hepatic Ly6Clow macrophages in wild-type mice after in vitro culture with lipid A (1 µg/ml) and Brefeldin A for 3 h, with or without LXR agonist (n = 3). (J) Survival curve of Rt2−/− mice challenged with APAP at 750 mg/kg. Indicated mice had been intravenously administered with clodronate at 25 mg/kg 24 h before APAP challenge (n > 4). (K) Survival curve of wild-type mice left untreated or administered twice with recombinant AIM (400 µg) before APAP challenge (n = 10–15). (L) Survival curve of wild-type mice left untreated or administered twice with LXR agonist before APAP challenge (n = 5–10). (M) Serum levels of AST and ALT in Rt2−/− mice with or without antibiotic treatment (n = 5). (N) Survival curve of wild-type mice left untreated or administered twice with the TLR13 ligand Sa19 before APAP challenge (n = 5–8). *P < 0.05, **P < 0.01, ***P < 0.001 and ****P < 0.0001.
Figure S5.
Figure S5.
TLR13 protects against acute liver damage. (A) Survival curve of indicated mice after APAP challenge at 750 mg/kg or intraperitoneal administration of LPS and D-Gal at 100 ng/mouse and 12.5 mg/mouse, respectively (n = 5–10). (B) The percentage of live hepatocytes from wild-type and Rnaset2−/− mice after stimulation with TNF-α, TNF-α + LPS, or APAP. (C) Representative contour plot showing TNF-α+ cells in hepatic Ly6Clow macrophages from wild-type and Rnaset2−/− mice after in vitro stimulation with the TLR4 ligand lipid A (1 µg/ml) and Brefeldin A for 3 h. (D) Dot plots show the percentage of splenic and hepatic Ly6Clow macrophages in wild-type mice treated with clodronate (25 mg/mice) at 16 h prior to analysis (n = 4–6). (E) Serum levels of AIM in wild-type mice with or without Sa19 administration (n = 4–11). (F) The numbers of KCs and moKCs in the liver of wild-type mice with and without Sa19 administration. (G and H) Survival curve of mice after intraperitoneal administration of LPS and D-Gal at 100 ng/mouse and 12.5 mg/mouse, respectively. Indicated mice intravenously received clodronate at 25 mg/kg 24 h before administration of LPS and D-Gal (n = 5–10). *P < 0.05 and ***P < 0.001.

References

    1. Akashi-Takamura, S., Furuta T., Takahashi K., Tanimura N., Kusumoto Y., Kobayashi T., Saitoh S., Adachi Y., Doi T., and Miyake K.. 2006. Agonistic antibody to TLR4/MD-2 protects mice from acute lethal hepatitis induced by TNF-alpha. J. Immunol. 176:4244–4251. 10.4049/jimmunol.176.7.4244 - DOI - PubMed
    1. Allen, R.M., Michell D.L., Cavnar A.B., Zhu W., Makhijani N., Contreras D.M., Raby C.A., Semler E.M., DeJulius C., Castleberry M., et al. . 2022. LDL delivery of microbial small RNAs drives atherosclerosis through macrophage TLR8. Nat. Cell Biol. 24:1701–1713. 10.1038/s41556-022-01030-7 - DOI - PMC - PubMed
    1. Allen, R.M., Zhao S., Ramirez Solano M.A., Zhu W., Michell D.L., Wang Y., Shyr Y., Sethupathy P., Linton M.F., Graf G.A., et al. . 2018. Bioinformatic analysis of endogenous and exogenous small RNAs on lipoproteins. J. Extracell. Vesicles. 7:1506198. 10.1080/20013078.2018.1506198 - DOI - PMC - PubMed
    1. Arai, S., Kitada K., Yamazaki T., Takai R., Zhang X., Tsugawa Y., Sugisawa R., Matsumoto A., Mori M., Yoshihara Y., et al. . 2016. Apoptosis inhibitor of macrophage protein enhances intraluminal debris clearance and ameliorates acute kidney injury in mice. Nat. Med. 22:183–193. 10.1038/nm.4012 - DOI - PubMed
    1. Bonnardel, J., T’Jonck W., Gaublomme D., Browaeys R., Scott C.L., Martens L., Vanneste B., De Prijck S., Nedospasov S.A., Kremer A., et al. . 2019. Stellate cells, hepatocytes, and endothelial cells imprint the kupffer cell identity on monocytes colonizing the liver macrophage niche. Immunity. 51:638–654.e9. 10.1016/j.immuni.2019.08.017 - DOI - PMC - PubMed

LinkOut - more resources