. 2025 Feb 4;19(4):4582-4600.
doi: 10.1021/acsnano.4c14675. Epub 2025 Jan 24.

Engineered Extracellular Vesicles Modified by Angiopep-2 Peptide Promote Targeted Repair of Spinal Cord Injury and Brain Inflammation

Affiliations

Engineered Extracellular Vesicles Modified by Angiopep-2 Peptide Promote Targeted Repair of Spinal Cord Injury and Brain Inflammation

Guang Kong et al. ACS Nano. .

Abstract

Engineered extracellular vesicles play an increasingly important role in the treatment of spinal cord injury. In order to prepare more effective engineered extracellular vesicles, we biologically modified M2 microglia. Angiopep-2 (Ang2) is an oligopeptide that can target the blood-brain barrier. Through single-cell sequencing and immunofluorescence experiments, we confirmed that the expression of LRP-1, the targeted receptor of Ang2, was elevated after spinal cord injury. Subsequently, we integrated the Ang2 peptide segment into M2 microglia to obtain Ang2-EVs, which could successfully target the site of spinal cord injury. However, in order to improve the function of Ang2-EVs, we pretreated M2 microglia with melatonin, which has anti-inflammatory effects, to obtain M-Ang2-EVs. The results of single-nucleus sequencing of the mouse spinal cord verified that neurons and OPCs gradually transformed into subtypes related to nerve repair functions after treatment with M-Ang2-EVs. This is consistent with the sequencing and enrichment analysis of miRNAs contained in M-Ang2-EVs. We further verified through experiments that M-Ang2-EVs can promote microglia/macrophages to phagocytose sphingomyelin, promote axon remyelination and axon elongation, and maintain the integrity of the blood-spinal barrier. Since Ang2 can also target the blood-brain barrier, we found that M-Ang2-EVs can also reduce brain inflammation that results from spinal cord injury. Our study applied the Angiopep-2 peptide to spinal cord injury to enhance the targeting of injured cells, and successfully construct engineered extracellular vesicles that can target the spinal cord injury site and the brain.

Keywords: angiopep-2; axonal regeneration; cerebral inflammation; engineered extracellular vesicles; melatonin; spinal cord injury.


Conflict of interest statement

The authors declare no competing financial interest.

Figures

Figure 1
Figure 1
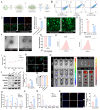
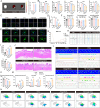
Expression of LRP-1 increased after spinal cord injury. (A) Heatmaps revealed the expression of LRP-1 in Sham group and SCI group. (B) Heatmaps revealed the expression of LRP-1 in spinal cord at different time points after injury. (C) t-Distributed Stochastic Neighbor Embedding (tSNE) shows the distribution of various cell populations after spinal cord injury. (D) The distribution of LRP-1 in various cell populations after spinal cord injury. (E) tSNE reveals the expression of LRP-1 in different cells at various time points after spinal cord injury. (F,G) Immunofluorescence staining after injury shows the expression of LRP-1 in microglia/macrophages, astrocytes, and endothelial cells. LRP-1 (white), IBA-1 labeled microglia/macrophages, GFAP labeled astrocytes and CD31 labeled endothelial cells (red), n = 5. (H,I): Immunofluorescence staining reveals the expression trends of LRP-1 in microglia, astrocytes, and endothelial cells in vitro injury environment. n = 5. *P < 0.05, **P < 0.01, ***P < 0.001.
Figure 2
Figure 2
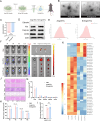
Preparation and characterization of Ang2-EVs. (A) The preparation process of extracellular vesicles derived from M2 microglia cells engineered with Ang2-targeting peptide. (B) Flow cytometry identifies the conversion efficiency of M2 microglia cells. (C) Immunofluorescence staining identifies the conversion efficiency of M2 microglia cells. Arg-1 labeled M2 microglia(red) and IBA-1 labeled microglia(green), n = 4. (D) EGFP green fluorescence represents successful integration of Ang2 into microglia cells. (E) qRT-PCR is used to identify the expression of Ang2 in M2 microglia cells and in extracellular vesicles derived from M2 microglia cells, validating the efficiency of Ang2 integration. n = 5. (F) TEM is used to observe the overall morphology of EVs and Ang2-EVs. (G) Zeta potential of EVs and Ang2-EVs. n = 5. (H) NTA analysis describes the diameter distribution of EVs and Ang2-EV. (I) The stability assessment of EVs and Ang2-EVs. n = 5. (J) Western blot analysis was used to identify surface markers of cells, EVs, and Ang2-EVs. (K,L) Observation of the targeting specificity and quantification of Dil-labeled Ang2-EVs in an in vitro simulated environment. n = 4. (M) CCK-8 assay detects the impact of Ang2-EVs on the viability of microglial cells. n = 6. (N) In vitro imaging shows the distribution of PBS, EVs, and Ang2-EVs in vivo, ex vivo spinal cord, and visceral organs. (O–Q) Quantitative distribution of PBS, EVs, and Ang2-EVs in vivo, spinal cord, and visceral organs. n = 3. (R) Fluorescence and quantitative analysis of the distribution of EVs and Ang2-EVs at the injury site in spinal cord tissue. n = 4. *P < 0.05, **P < 0.01, ***P < 0.001.
Figure 3
Figure 3
Construction and characterization of M-Ang2-EVs. (A) The preparation process of M-Ang2-EVs. (B) TEM comparison of the overall morphology of Ang2-EVs and M-Ang2-EVs. (C) Comparison analysis of the zeta potential between Ang2-EVs and M-Ang2-EVs. n = 5. (D) Western blot analysis to identify surface markers of Ang2-EVs and M-Ang2-EVs. (E) NTA for identifying the diameter distribution of Ang2-EVs and M-Ang2-EVs. (F) IVIS imaging shows the distribution of PBS, Ang2-EVs, and M-Ang2-EVs in vivo, ex vivo spinal cord, and visceral organs. (G–I) Quantitative analysis of PBS, Ang2-EVs, and M-Ang2-EVs in vivo, ex vivo spinal cord, and visceral organs. n = 3. (J) Representative HE staining of heart, liver, spleen, lung and kidney after treatment with PBS, EVs, Ang2-EVs and M-Ang2-EVs. (K) Heatmap depicting the differential miRNA expression between Ang2-EVs and M-Ang2-EVs. *P < 0.05, **P < 0.01, ***P < 0.001.
Figure 4
Figure 4
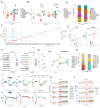
M-Ang2-EVs promote the reconstruction of nerve conduction function after spinal cord injury. (A,B) UMAP shows snRNA-seq analysis from PBS-and M-Ang2-EVs-treated mouse spinal cord cell populations. The color corresponds to the aggregation of cell populations. (C) Dot plot of the top six degs for each cluster. The color of the dot indicates the average RNA expression of the gene in the cell type, and the size of the dot indicates the percentage of cells in the cluster that express the gene. (D) Proportion of each cell population in the spinal cord of mice with SCI after treatment with PBS and M-Ang2-EVs. (E) Volcano plot of gene expression in OPC and Neuron populations in spinal cord tissue after treatment M-Ang2-EVs and PBS. (F) Results of GO enrichment analysis of genes highly expressed in OPC and Neuron populations in spinal cord tissue after M-Ang2-EVs treatment compared to PBS treatment. (G) UMAP visualization shows the distribution of neuron and OPC subsets. (H) Proportion of neuron and OPC subtype in the spinal cord of SCI mice treated with PBS and M-Ang2-EVs. (I) Pseudotime-ordered analysis of neuron subpopulation differentiation trajectories in spinal cord injury. (J) Pseudotime-ordered analysis of OPC subpopulation differentiation trajectories in spinal cord injury. (K,L) Dynamic plots show the expression of selected genes in neuron and OPC subsets.
Figure 5
Figure 5
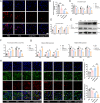
M-Ang2-EVs promote axonal remyelination and axon guidance by targeting microglia/macrophage. (A) The KEGG Enrichment ScatterPlot of differential genes between PBS and Ang2-EVs illustrates the biological functions of M-Ang2-EVs. (B) Dil-labeled M-Ang2-EVs are engulfed by microglia/macrophages at the injury site (Arrows show colocation). (C) Immunofluorescence staining demonstrates the phagocytosis of myelin debris by microglia/macrophages in different treatment groups, MBP labeled sphingomyelin (red), IBA-1 labeled microglia/macrophages (green) (Asterisk indicates colocation). (D) Quantification of myelin phagocytosis by microglia/macrophages at the spinal cord injury site after treatment with PBS, EVs, Ang2-EVs, and M-Ang2-EVs. n = 5. (E) LFB staining identifies the extent of axonal myelination at the spinal cord injury site after treatment with PBS, EVs, Ang2-EVs, and M-Ang2-EVs. (F) Quantification of LFB staining of axonal myelination at the spinal cord injury site after treatment with PBS, EVs, Ang2-EVs, and M-Ang2-EVs. n = 6. (G) TEM was used to observe the myelin morphology at the spinal cord injury site after treatment with PBS, EVs, Ang2-EVs, and M-Ang2-EVs. (H) G-ratio of axon myelin at the injury site after treatment with PBS, EVs, Ang2-EVs, and M-Ang2-EVs. n = 10. (I) Quantification of myelinated and unmyelinated axons at the injury site after treatment with PBS, EVs, Ang2-EVs, and M-Ang2-EVs. n = 10. (J,K): Representative immunofluorescence images and quantitative analysis of NeuN + neurons (green) in the Z1-Z4 regions near the core of the lesion at the injury site after treatment with different groups. n = 6. (L) Representative immunofluorescence images showing the distribution of astroglial scars and the growth of neuronal fibers at the injury site after treatment with different groups. GFAP labeled glial scars(red), NF200 labeled neurofilaments(green). (M) Quantification of NF200+ area in the center of spinal cord injury as a percentage of the total area of distal uninjured axons, n = 3. *P < 0.05, **P < 0.01, ***P < 0.001.
Figure 6
Figure 6
M-Ang2-EVs promotes blood-spinal barrier repair by targeting astrocytes and endothelial cells (A) The KEGG Enrichment BarPlot illustrates the biological functions of M-Ang2-EVs. (B) Representative immunofluorescence staining images showing M-Ang2-EVs engulfed by astrocytes and endothelial cells at the spinal cord injury site, (arrows show colocation). (C,D) Western Blot was used to detect the expression of PI3K-AKT pathway in spinal cord tissue under different treatments, n = 3. (E) CCK-8 evaluated the effects of PBS, EVs, Ang2-EVs, and M-Ang2-EVs on astrocyte and endothelial cell viability. n = 6. (F) FITC-Dextran evaluated the effects of PBS, EVs, Ang2-EVs, and M-Ang2-EVs on BSCB permeability at spinal cord injury sites. (G) Quantification of perivascular FITC-Dextran fluorescence intensity after PBS, EVs, Ang2-EVs, and M-Ang2-EVs treatment. n = 4. (H) Representative colocalization images of vascular tight junction proteins (Occludin, green) (Claudin5, green) with blood vessels (CD31, red) at the injury site following treatment with different groups, (Asterisk indicates colocation). (I) Line plot of colocalization intensity of Occludin and Claudin5 with CD31. (J) Quantitative analysis of the colocalization intensity of Occludin and Claudin5 with CD31. n = 5. (K,L) Immunofluorescence and quantization of Occludin and Claudin5 expression in bEnd.3 cells after PBS, EVs, Ang2-EVs, and M-Ang2-EVs treatment. n = 4. (M) Quantitative analysis of TEER in bEnd.3 cells after PBS, EVs, Ang2-EVs, and M-Ang2-EVs treatment. n = 5. *P < 0.05, **P < 0.01, ***P < 0.001.
Figure 7
Figure 7
M-Ang2-EVs prevents inflammation progression after SCI. (A) DHE staining elucidates the degree of oxidative stress at the site of spinal cord injury following treatment with various therapeutic groups (DHE: red). (B) Quantitative analysis of DHE immunofluorescence staining. n = 5. (C) ELISA assesses the expression of proinflammatory cytokines (TNF-α, IL-1β, IL-6) at the site of spinal cord injury after treatment with different therapeutic groups. n = 5. (D) ELISA evaluates the expression of anti-inflammatory cytokines (TGF-β, IL-4, IL-10) at the site of spinal cord injury post-treatment with various therapeutic interventions. n = 5. (E,F) Western Blot analysis and quantitative assessment of the expression of markers for different subtypes of microglia/macrophages (M1: iNOS, M2: Arg1) at the site of spinal cord injury after treatment with PBS, EVs, Ang2-EVs, and M-Ang2-EVs. n = 4. (G) qRT-PCR examination of the expression of markers for different subtypes of microglia/macrophages (M1: iNOS, TNF-α, IL-1β; M2: Arg1, CD206, YM1/2) at the site of spinal cord injury following treatment with PBS, EVs, Ang2-EVs, and M-Ang2-EVs. n = 6. (H,I) Immunofluorescence staining for markers of M1/M2 subtypes of microglia/macrophages (IBA-1) and quantitative analysis of the number of positive cells. *P < 0.05, **P < 0.01, ***P < 0.001.
Figure 8
Figure 8
M-Ang2-EVs can promote the recovery of cognitive function and motor function after spinal cord injury (A) IVIS imaging and quantification shows accumulation of Ang2-EVs and M-Ang2-EVs in the brain. n = 3. (B) Quantification of brain inflammation-related markers following different treatment modalities in Sham and SCI conditions. n = 6. (C,D) Representative immunofluorescence staining and quantitative analysis of the M1 polarization marker iNOS in microglia in the brain following different treatment modalities in Sham and SCI conditions, iNOS labeled M1 polarized microglia marker(red), TEME119 labeled microglia(green). n = 6. (E) Three-dimensional reconstruction of microglial morphology in the brain following different treatment modalities in Sham and SCI conditions. (F) Quantification of Y-maze, NOR test, and TS results to assess the improvement in spatial cognitive ability and depressive behavior in SCI mice. n = 10. (G) BMS score assesses the motor function of spinal cord injury mice after treatment with PBS, EVs, Ang2-EVs, and M-Ang2-EVs. (H) Electrophysiological assessment with MEP analysis of SCI mice after treatment with PBS, EVs, Ang2-EVs, and M-Ang2-EVs. (I) Quantification of peak-to-peak MEP amplitude and latency of SCI mice after treatment with PBS, EVs, Ang2-EVs, and M-Ang2-EVs. n = 6. (J) Bladder wall thickness was used to evaluate bladder recovery in SCI mice after treatment. (K) Quantification of bladder wall thickness. n = 6. (L,N) Representative paw prints, hind paw pressure images and temporal views of limb support from Catwalk gait analysis. (M) Quantitative analysis of regularity index, stands, and hind paw print area in Catwalk gait analysis of spinal cord injury mice following different treatment modalities. n = 6. *P < 0.05, **P < 0.01, ***P < 0.001.

References

    1. McDonald J. W.; Sadowsky C. Spinal-cord injury. Lancet 2002, 359 (9304), 417–425. 10.1016/S0140-6736(02)07603-1. - DOI - PubMed
    1. Anjum A.; Yazid M. D.; Fauzi Daud M.; Idris J.; Ng A. M. H.; Selvi Naicker A.; Ismail O. H. R.; Athi Kumar R. K.; Lokanathan Y. Spinal Cord Injury: Pathophysiology, Multimolecular Interactions, and Underlying Recovery Mechanisms. Int. J. Mol. Sci. 2020, 21 (20), 7533.10.3390/ijms21207533. - DOI - PMC - PubMed
    1. Hu X.; Xu W.; Ren Y.; Wang Z.; He X.; Huang R.; Ma B.; Zhao J.; Zhu R.; Cheng L. Spinal cord injury: molecular mechanisms and therapeutic interventions. Signal Transduction Targeted Ther. 2023, 8 (1), 245.10.1038/s41392-023-01477-6. - DOI - PMC - PubMed
    1. Ramos-Zaldívar H. M.; Polakovicova I.; Salas-Huenuleo E.; Corvalán A. H.; Kogan M. J.; Yefi C. P.; Andia M. E. Extracellular vesicles through the blood-brain barrier: a review. Fluids Barriers CNS 2022, 19 (1), 60.10.1186/s12987-022-00359-3. - DOI - PMC - PubMed
    1. Nakazaki M.; Morita T.; Lankford K. L.; Askenase P. W.; Kocsis J. D. Small extracellular vesicles released by infused mesenchymal stromal cells target M2 macrophages and promote TGF-β upregulation, microvascular stabilization and functional recovery in a rodent model of severe spinal cord injury. J. Extracell. Vesicles 2021, 10 (11), e1213710.1002/jev2.12137. - DOI - PMC - PubMed

Publication types

MeSH terms